
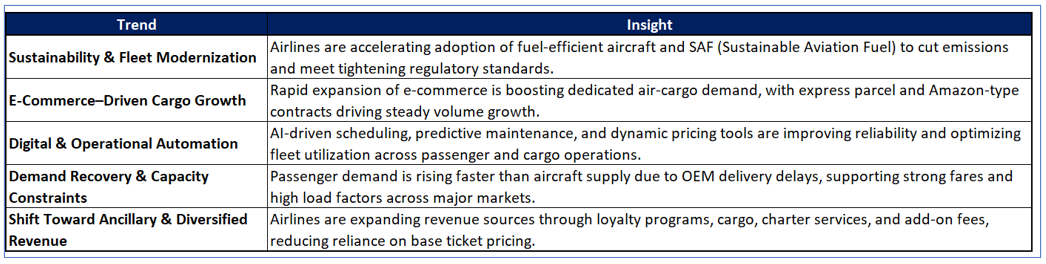
Kalkine’s Global Travel & Leisure Report offers a comprehensive view of the key companies and evolving trends across the travel value chain covering countries including US, Canada, Australia, UK, and New Zealand. This includes airlines, hospitality chains, digital travel platforms, as well as the rapidly growing leisure, entertainment, and gaming segments that are redefining the way people engage with travel experiences.

Airline Service and Cargo Market: A Dynamic Growth Trajectory:


Kalkine’s Global Travel & Leisure Report covers the Investment Highlights, Key Financial Metrics, Risks, Technical Analysis along with the Valuation, Target Price, and Recommendation on Sun Country Airlines Holdings Inc (NASDAQ: SNCY).
Section 1: Company Overview and Fundamentals Insights
Company Overview: Sun Country Airlines Holdings, Inc. (NASDAQ: SNCY) operates Sun Country Airlines, a hybrid low-cost air carrier that deploys shared resources across its scheduled service, charter, and cargo businesses. The Company focuses on serving leisure and visiting friends and relatives (VFR) passengers, charter customers, and providing crew, maintenance, and insurance (CMI) service to Amazon.com Services, LLC (Amazon), with flights throughout the United States and to destinations in Canada, Mexico, Central America, and the Caribbean.
Kalkine’s Global Travel and Leisure Report cover the Investment Highlights, Key Financial Metrics, Risks, and Technical Analysis along with the Valuation, Target Price, and Recommendation on the stock.
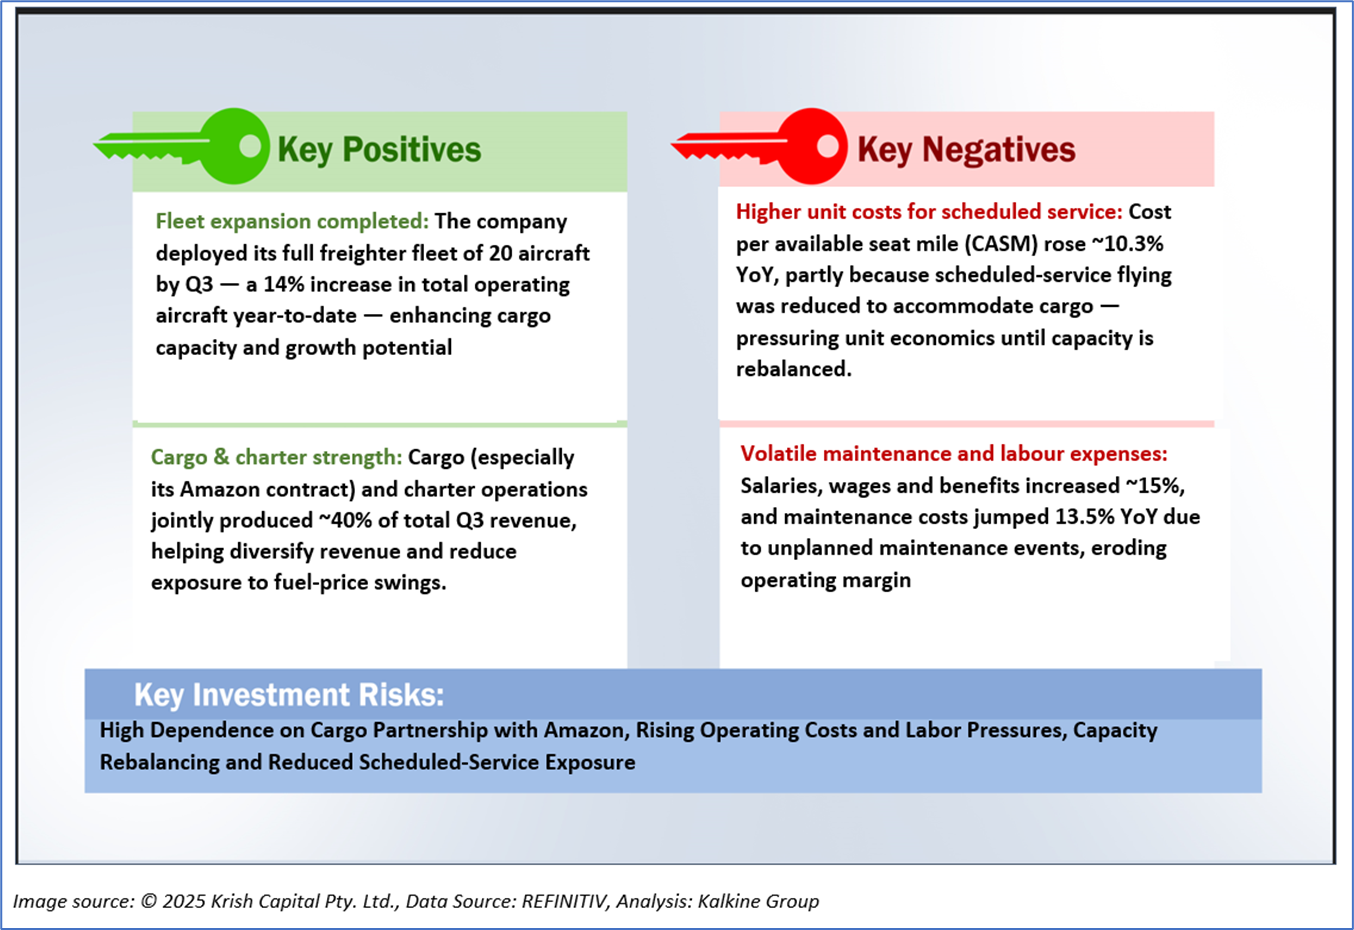
1.2 The Key Positives, Negatives, Investment Highlights, and Risks
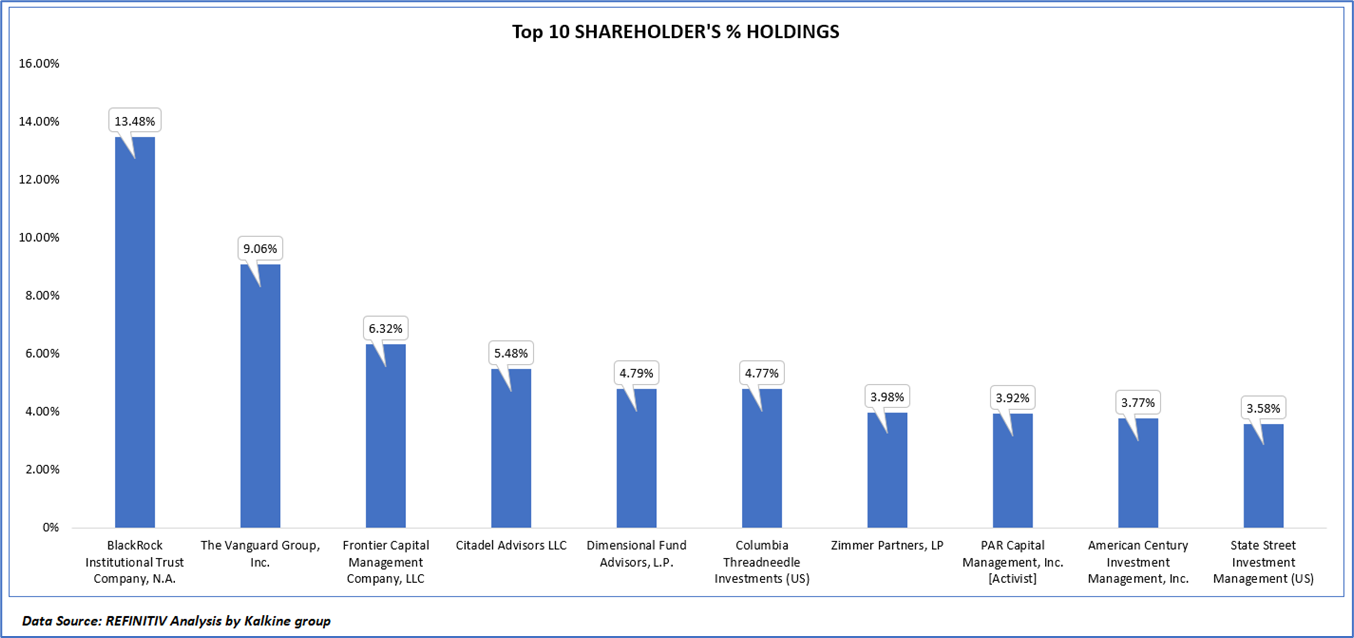
1.3 Top 10 Shareholders:
The top 10 shareholders together form ~59.15% of the total shareholding. BlackRock Institutional Trust Company, N.A. and The Vanguard Group, Inc. Ltd. hold maximum stakes of 13.48% and 9.06%, respectively.
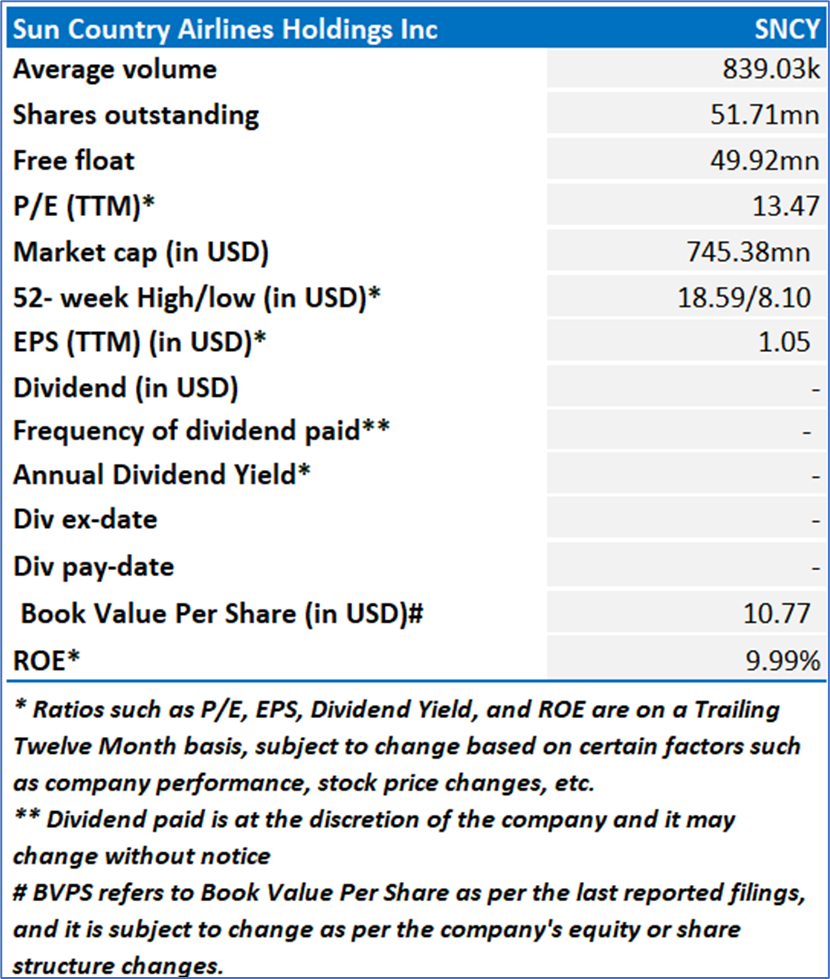
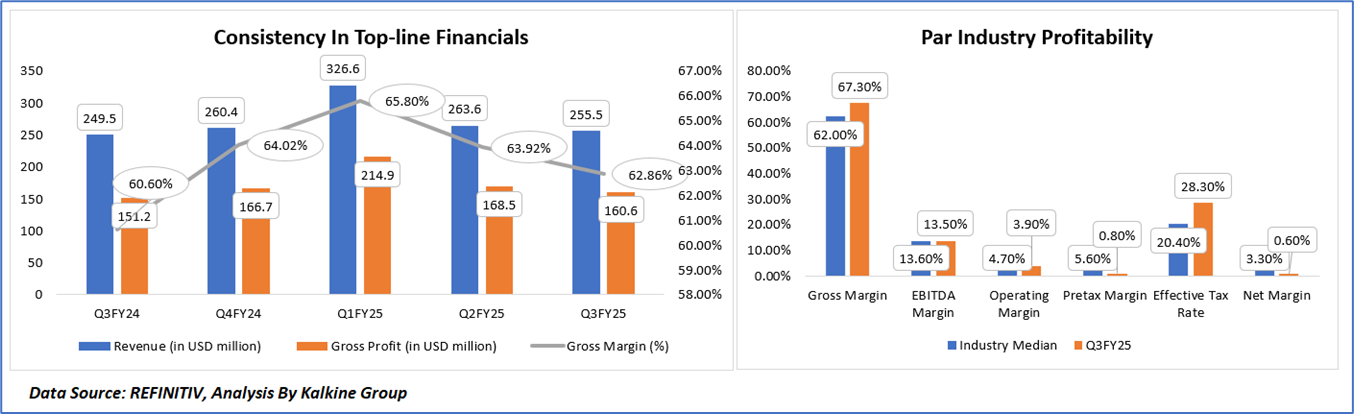
1.4 Key Metrics:
Sun Country’s Q3FY25 margins present a mixed picture when evaluated against industry medians. The Company’s gross margin of 67.3% exceeds the sector median of 62%, reflecting strong revenue quality supported by its diversified cargo and charter mix. However, EBITDA margin of 13.5% is broadly in line with the industry’s 13.6%, indicating that cost pressures—particularly labor and maintenance—are limiting incremental operating leverage. Further down the P&L, operating margin (3.9%) trails the industry median of 4.7%, and pretax margin (0.8%) significantly underperforms the 5.6% benchmark, underscoring the impact of elevated unit costs and reduced scheduled service flying. The higher effective tax rate (28.3% vs. 20.4%) further compressed profitability, contributing to a net margin of just 0.6%, well below the 3.3% industry norm.
From Q3FY24 to Q3FY25, Sun Country’s revenue trajectory remained broadly stable, though fluctuations reflect shifts in fleet utilization and business mix, peaking at USD 326.6 million in Q1FY25 before normalizing to USD 255.5 million in Q3FY25. Gross profit followed a similar pattern, reaching a high of USD 214.9 million in Q1FY25 before easing to USD 160.6 million in Q3FY25. Despite this moderation, the Company’s gross margin remained consistently above 60% throughout the five-quarter period, though it has trended lower—from 65.8% in Q1FY25 to 62.9% in Q3FY25—indicating rising cost pressures as cargo growth displaced higher-margin scheduled services. The overall trend suggests that while Sun Country’s revenue base remains resilient, margin compression is becoming more visible as cost intensities increase and the business continues to rebalance capacity between scheduled, cargo, and charter operations.
Section 2: Business Updates, Financial and Operational Highlights
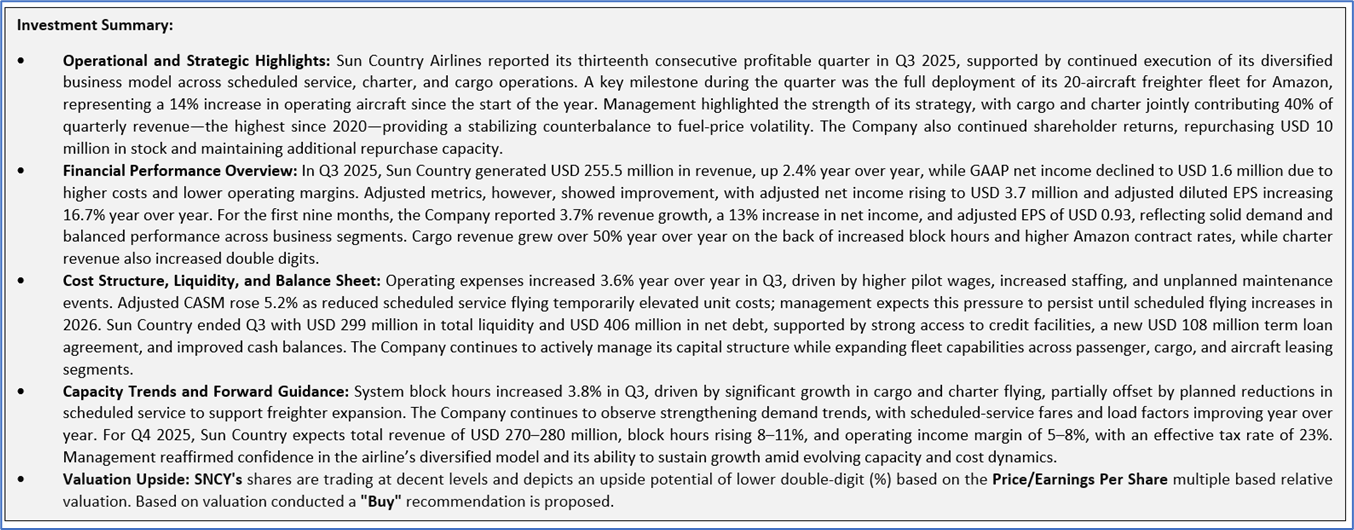
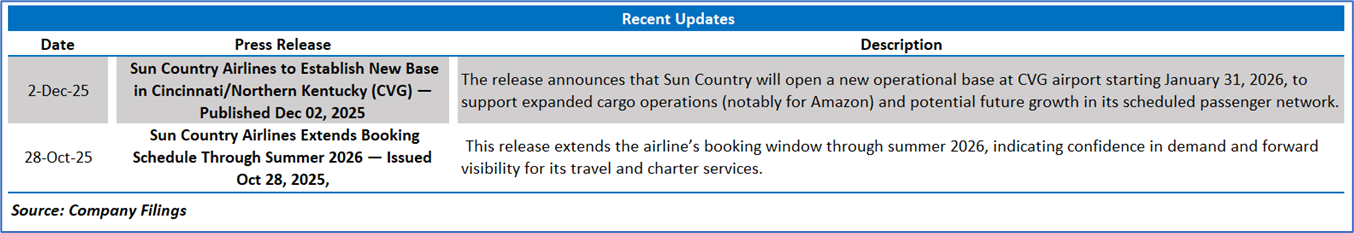
2.1 Recent Business Updates:
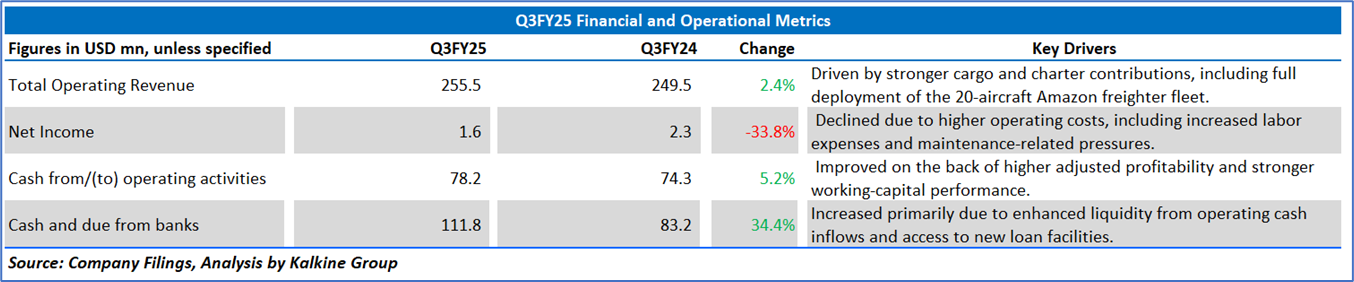
2.2 Q3FY25 Results Highlights (for the 03 months ending September 30, 2025): Below are some key financial highlights:
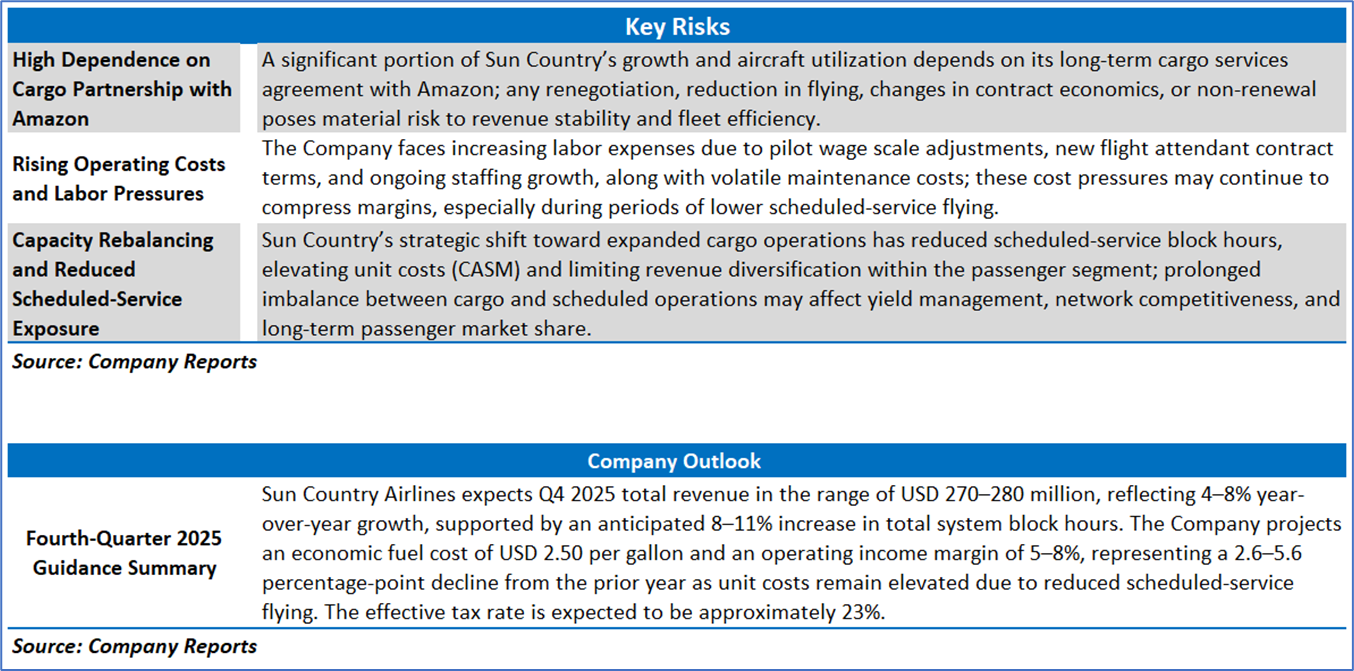
Section 3: Key Risks and Outlook:
Section 4: Stock Recommendation Summary
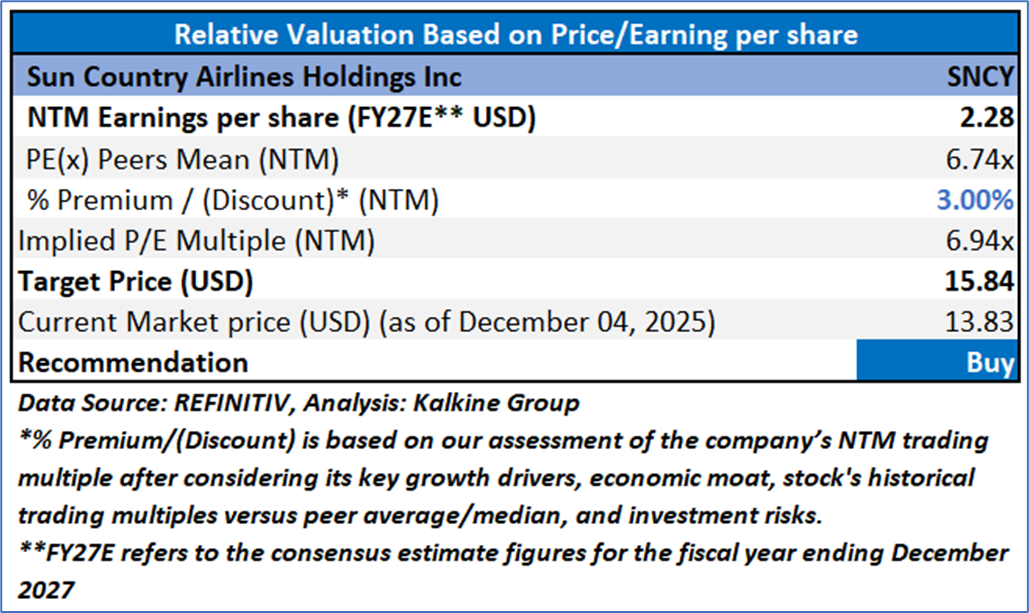
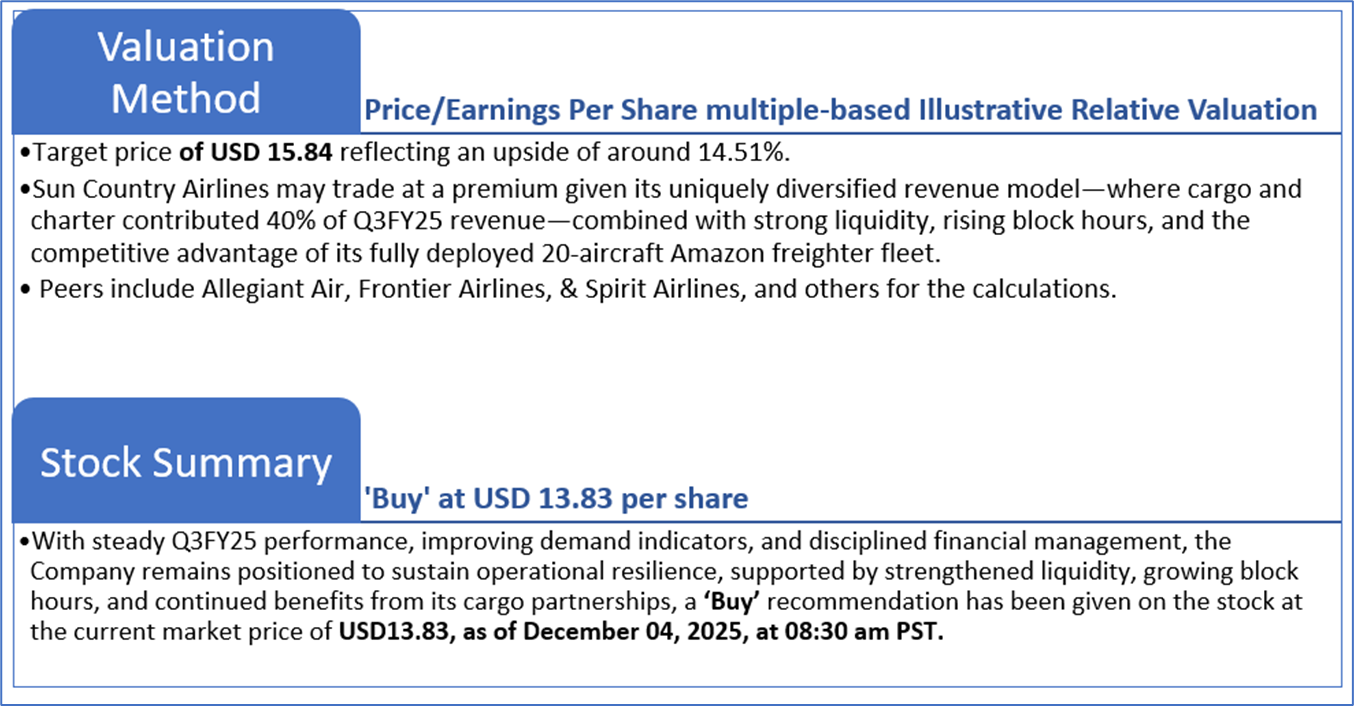
4.2 Fundamental Valuation
Valuation Methodology: Price/ Earnings Per Share Multiple Based Relative Valuation (Illustrative)
Markets are trading in a highly volatile zone currently due to certain macro-economic issues and geopolitical tensions prevailing. Therefore, it is prudent to follow a cautious approach while investing.
Note 1: Past performance is neither an indicator nor a guarantee of future performance.
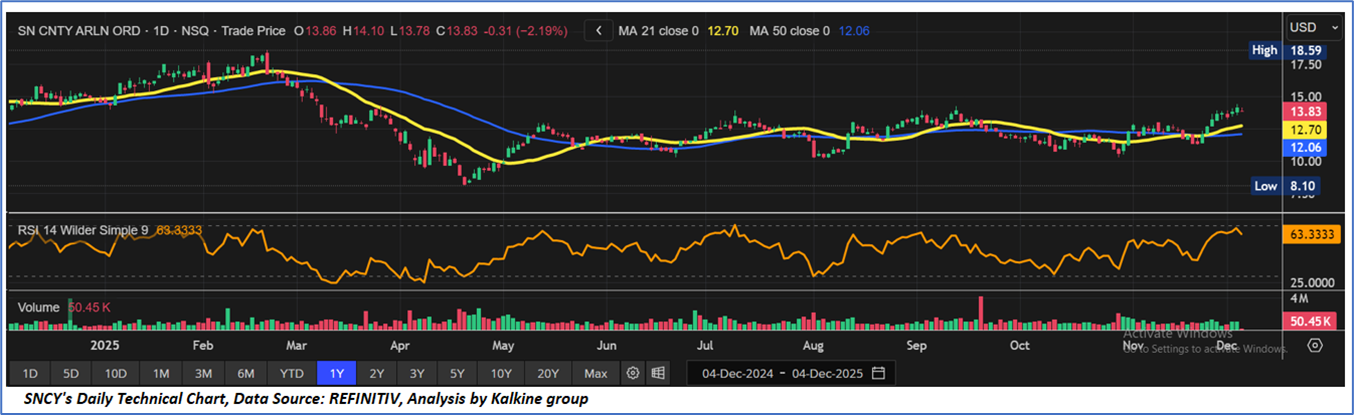
Note 2: The reference date for all price data, currency, technical indicators, support, and resistance levels is December 04, 2025. The reference data in this report has been partly sourced from REFINITIV.
Note 3: Investment decisions should be made depending on an individual's appetite for upside potential, risks, holding duration, and any previous holdings. An 'Exit' from the stock can be considered if the Target Price mentioned as per the Valuation and or the technical levels provided has been achieved and is subject to the factors discussed above.
Note 4: Dividend Yield may vary as per the stock price movement.
Note 5: Kalkine reports are prepared based on the stock prices captured either from REFINITIV or Trading View. Typically, REFINITIV or Trading View may reflect stock prices with a delay which could be a lag of 25-30 minutes. There can be no assurance that future results or events will be consistent with the information provided in the report. The information is subject to change without any prior notice.
Technical Indicators Defined: -
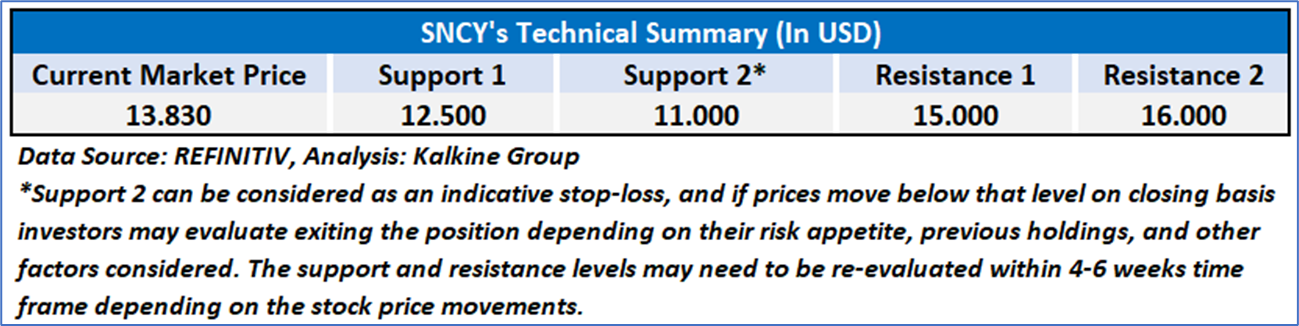
Support: A level at which the stock prices tend to find support if they are falling, and a downtrend may take a pause backed by demand or buying interest. Support 1 refers to the nearby support level for the stock and if the price breaches the level, then Support 2 may act as the crucial support level for the stock.
Resistance: A level at which the stock prices tend to find resistance when they are rising, and an uptrend may take a pause due to profit booking or selling interest. Resistance 1 refers to the nearby resistance level for the stock and if the price surpasses the level, then Resistance 2 may act as the crucial resistance level for the stock.
Stop-loss: It is a level to protect further losses in case of unfavourable movement in the stock prices.
This report (“Report”) has been issued by Kalkine New Zealand Limited (FSP691351) (NZBN:9429047678101) (“Kalkine”). Kalkine is a Financial Advice Provider (“FAP”) and is authorised by a Class 1 Financial Advice Provider Licence issued by Financial Markets Authority (“FMA”) to provide financial advice. Kalkine provides only general financial advice through its research reports following a person becoming a member. The reports contain buy/sell/hold and other recommendations in relation to equity securities, managed funds and other managed investment schemes and other financial advice products. The recommendations and opinions in this Report and on Kalkine website do not take into account any of your investment objectives, financial situation or needs. Before you make a decision about whether to acquire a financial product, you should obtain the Product Disclosure Statement from the product issuer. You should consider the appropriateness of advice taking into account your own objectives, financial situation and needs and seek independent financial advice before making any financial decisions. If you act on the advice in the research reports, you may have to pay fees, expenses or other amounts (but not to Kalkine).
The information in this Report and on the Kalkine website has been prepared from a wide variety of sources, which Kalkine, to the best of its knowledge and belief, considers accurate. Kalkine has made every effort to ensure the reliability of the information contained in its reports (including this Report), newsletters and websites. All information represents our views at the date of publication and may change without notice.
Kalkine does not issue, sell or deal in any financial products. The information in this Report does not constitute an offer to sell securities or other financial products or a solicitation of an offer to buy securities or other financial products. Our reports contain general recommendations to invest in securities and other financial products. Kalkine is not responsible for, and does not guarantee, the performance of, or returns on, any investments mentioned in this Report.
This Report may contain information on past performance of particular investments. Past performance is not a reliable indicator of future performance. Returns stated do not take into account transaction costs and taxes.
Further information about the complaints and dispute resolution process, as well as information about Kalkine’s duties are available on Kalkine’s website. Please read our Financial Advice Provider (FAP) disclosure statement and Complaints Handling Guide, which are available on the website.
Copyright 2025 Krish Capital Pty. Ltd. (ABN 61629651510). All Rights Reserved. No part of this Report, or its content, may be reproduced in any form without our prior consent.
Past performance is not a reliable indicator of future performance.
 Please wait processing your request...