
Company Overview:
Foley Wines Limited (NZX: FWL) is an integrated wine company producing table wines with the marketing and sales of premium wines in New Zealand and various export markets. Fonterra Co-operative Group Limited (NZX: FCG) is a dairy co-operative, owned and supplied by nearly 9,000 farming families in Aotearoa, NZ.
Kalkine’s Sector Report covers the Key Financial Metrics, Risks, Outlook, Technical Analysis along with the Valuation, Target Price, and Recommendation on the stock.
1. Sector Landscape and Outlook
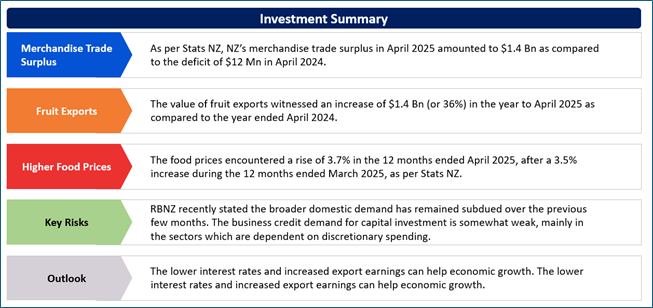
As per Stats NZ, NZ’s merchandise trade surplus in April 2025 amounted to $1.4 Bn as compared to the deficit of $12 Mn in April 2024. The country has witnessed only 4 monthly surpluses of more than $1 Bn. The last two were encountered in 2020 and 2 out of the 4 were also in April months. As per the release, the overlap of the dairy as well as fruit industry seasons contributed to this high. NZ imported $6.4 billion and exported $7.8 billion of goods in April 2025.
The value of fruit exports witnessed an increase of $1.4 Bn (or 36%) in the year to April 2025 as compared to the year ended April 2024. Notably, 65% (or $3.5 Bn) was sent to 4 main destinations. Kiwifruit, apples, and cherries have been tagged as the largest contributors.
Exhibit 1: Monthly Trade Balance ($ Mn), Jan 2025 – April 2025
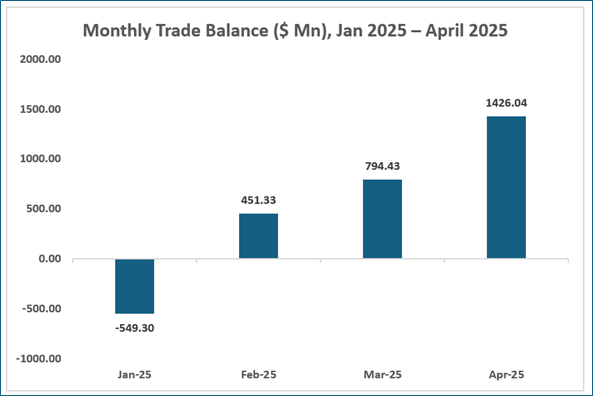
Data Source: This work is based on/includes Stats NZ’s data which are licensed by Stats NZ for reuse under the Creative Commons Attribution 4.0 International Licence; Chart Created by Kalkine Group
Food Prices Witnessed an Increase Annually
The food prices encountered a rise of 3.7% in the 12 months ended April 2025, after a 3.5% increase during the 12 months ended March 2025, as per Stats NZ. The increased prices for the grocery food group as well as the non-alcoholic beverages group resulted in most of the annual rise in food prices, reflecting a rise of 5.2% and 6.8%, respectively. Notably, price increases that were witnessed were widespread as all 5 food groups encountered an increase. The fruit and vegetables group rose for the first time since the month of January 2024 as prices increased 0.2% during the 12 months ended April 2025.
The appreciation in price for the grocery food group was because of increased prices for milk, butter, and cheese. The Price rises in dairy products contributed to the increases for April 2025. The milk and cheese prices witnessed a rise of 15.1% and 24%, respectively during the 12 months ended April 2025.
Exhibit 2: Food Prices (Annual % Change)
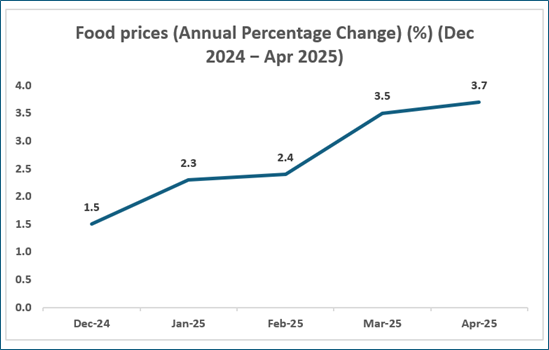
Data Source: This work is based on/includes Stats NZ’s data which are licensed by Stats NZ for reuse under the Creative Commons Attribution 4.0 International Licence; Chart Created by Kalkine Group
Higher Prices for Non-alcoholic Beverages Group
As per Stats NZ, the average price for 500 grams of butter stood at $7.42 in April 2025. This was ~$3 more expensive as compared to this time of the previous year. Furthermore, a rise in non-alcoholic beverages group was because of increased prices for instant coffee, which were up by 21.3% during the 12 months ended April 2025. Notably, the instant coffee prices went up by $1.44 on the YoY basis. Therefore, the average cost amounted to $8.21 per 100g.
Key Risks and Challenges:
RBNZ recently stated the broader domestic demand has remained subdued over the previous few months. Notably, the household consumption was impacted by the increased interest rates, a weakness in the labour market, softness in housing market as well as subdued momentum in net migration flows. Furthermore, the heightened uncertainty related to the international trade and high debt-servicing costs resulted in the weakness in business investment. Also, the business credit demand for capital investment is somewhat weak, mainly in the sectors which are dependent on discretionary spending.
Exhibit 3. Key Risks in Consumer Staples Sector:
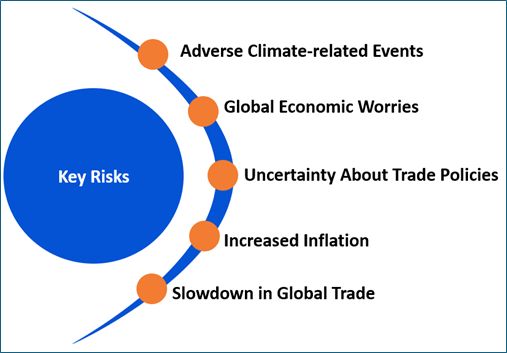
Source: Analysis by Kalkine Group
Outlook:
As per RBNZ, the Monetary Policy Committee discussed developments related to the domestic economic activity. Notably, higher-than-anticipated export prices as well as a reduced exchange rate helped the primary sector incomes and broad-based economic growth. That being said, household spending and residential investment remained weaker compared to the expectations. The Committee also mentioned about the significant spare productive capacity which is available in the economy. The anticipations of future inflation, along with the degree of spare productive capacity, remains consistent with annual CPI inflation remaining close to the target midpoint in the medium term. The lower interest rates and increased export earnings can help economic growth.
As per Situation and Outlook for Primary Industries (SOPI) December 2024, the dairy export revenue is expected to increase 10% to $25.5 Bn during the year to 30 June 2025. The is because of a decline in export revenue in 2023/24. The global dairy prices are projected to be higher in 2024/25 as a result of tight global supply from critical dairy exporting regions like the US and the EU.
Apart from the sector-specific factors, an analysis on 2 NZX-listed companies is provided. This report covers their insights, outlook, performance and potential as expected to be delivered in the near to medium term.
1) Foley Wines Limited (Recommendation: Speculative Buy, Potential Upside: Low Double-Digit) (M-Cap: NZD 39.4 Mn)
Business Description:
Foley Wines Limited (NZX: FWL) is an integrated wine company producing table wines with the marketing and sales of premium wines in New Zealand and various export markets.
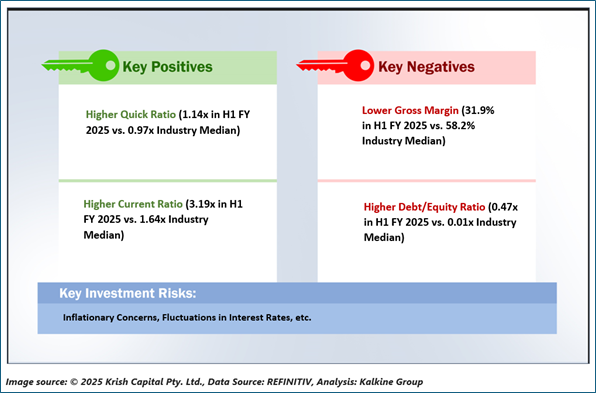
Outlook:
FWL has wrapped up the harvest for 2025 vintage. The harvest stood at 8,638 tonnes throughout the Grove Mill and Vavasour wineries in Marlborough, Te Kairanga and Martinborough Vineyard wineries in Martinborough and Mt Difficulty winery in Central Otago, reflecting a rise of 35% as compared to last year’s harvest of 6,404 tonnes and a rise of 6% on the 2023 harvest of 8,137 tonnes. The company established healthy routes to market for the branded products and its inventory remains in good shape. FWL is expecting increased gross margins and, hopefully with the support of downward pressure on interest rates, it is anticipating a better financial position for FY 2026.
Technical Overview:
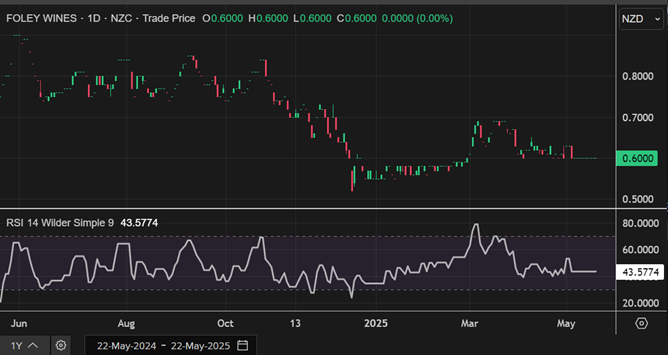
FWL Daily Technical Chart, Data Source: REFINITIV
Technical Commentary
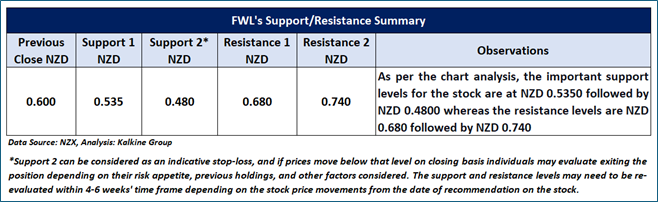
On the daily chart, FWL prices are trading above the horizontal trendline support level and taking support from the trendline. Moreover, the momentum oscillator RSI (14-period) is showing a reading of ~43.58 level. However, prices remain below the 21-period Simple Moving Average (SMA), a key trend-following indicator, which may act as near-term resistance. An important support level for the stock is at NZD 0.535, while the key resistance level is placed at NZD 0.68.
Stock Recommendation
Considering the facts above, a ‘Speculative Buy’ recommendation on the stock has been provided at the closing market price of NZD 0.600 per share as on 22 May 2025.
2) Fonterra Co-operative Group Limited (Recommendation: Hold, Potential Upside: Low Double-Digit) (M-Cap: NZD 7.61 Bn, Annual Dividend Yield: 14.92%)
Business Description:
Fonterra Co-operative Group Limited (NZX: FCG) is a dairy co-operative, owned and supplied by ~9,000 farming families in Aotearoa, NZ.
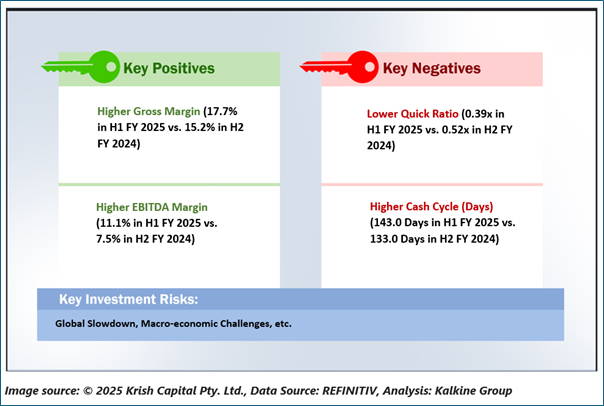
Outlook:
An independent report, which has prepared by Northington Partners for the purposes of s109LA of the Dairy Industry Restructuring Act 2001, was provided to shareholders by the Fonterra Co-operative Council. Fonterra is possessing a healthier balance sheet which helped the rise in its dividend policy from payout of 40% - 60% of earnings to 60% - 80% (excluding abnormal gains). Consistent with the Fonterra’s FY 2025 earnings guidance, along with the revised dividend payout policy, total dividends for FY 2025 are expected to be in the vicinity of 47 cents.
Technical Overview:
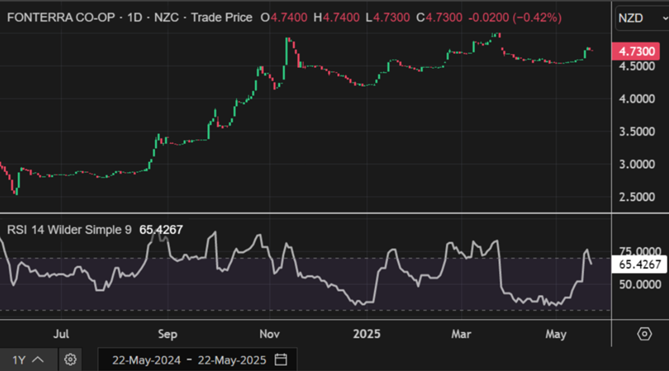
FCG Daily Technical Chart, Data Source: REFINITIV
Technical Commentary
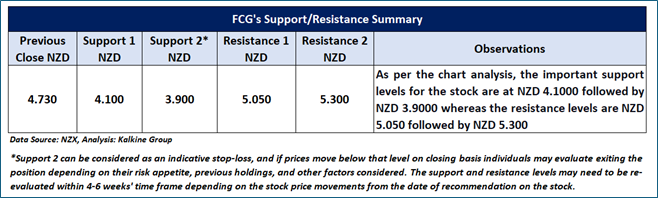
On the daily chart, FCG is trading above a rising trendline support, indicating that the stock is currently finding support and maintaining an upward trajectory. The 14-period Relative Strength Index (RSI) is at approximately 65.43, reflecting strong momentum. Additionally, prices are trading above the 21-period Simple Moving Average (SMA), which acts as a dynamic support zone, reinforcing the bullish bias. An important support level for the stock is at NZD 4.10, while the key resistance level is placed at NZD 5.05.
Stock Recommendation
Considering the facts above, a ‘Hold’ recommendation on the stock has been provided at the closing market price of NZD 4.73 per share, down by 0.42% as on 22 May 2025
Markets are trading in a highly volatile zone currently due to certain macro-economic issues and geopolitical tensions prevailing. Therefore, it is prudent to follow a cautious approach while investing.
Note 1: Past performance is not a reliable indicator of future performance.
Note 2: The reference date for all price data, currency, technical indicators, support, and resistance levels is May 22, 2025. The reference data in this report has been partly sourced from REFINITIV.
Note 3: Investment decisions should be made depending on an individual's appetite for upside potential, risks, holding duration, and any previous holdings. An 'Exit' from the stock can be considered if the Target Price mentioned as per the Valuation and or the technical levels provided has been achieved and is subject to the factors discussed above.
Note 4: Annual Dividend Yield is on a Trailing Twelve Month (TTM1) basis and are subject to change based on factors such as company performance, stock price changes, etc.
Note 5: Kalkine reports are prepared based on the stock prices captured either from REFINITIV or Trading View. Typically, REFINITIV or Trading View may reflect stock prices with a delay which could be a lag of 25-30 minutes. There can be no assurance that future results or events will be consistent with the information provided in the report. The information is subject to change without any prior notice.
Technical Indicators Defined: -
Support: A level at which the stock prices tend to find support if they are falling, and a downtrend may take a pause backed by demand or buying interest. Support 1 refers to the nearby support level for the stock and if the price breaches the level, then Support 2 may act as the crucial support level for the stock.
Resistance: A level at which the stock prices tend to find resistance when they are rising, and an uptrend may take a pause due to profit booking or selling interest. Resistance 1 refers to the nearby resistance level for the stock and if the price surpasses the level, then Resistance 2 may act as the crucial resistance level for the stock.
Stop-loss: It is a level to protect further losses in case of unfavourable movement in the stock prices.
Disclaimer This report has been issued by Kalkine New Zealand Limited (FSP691351) (NZBN:9429047678101) (“Kalkine”). Kalkine is a Financial Advice Provider (“FAP”) and is authorised by a Class 1 Financial Advice Provider Licence issued by Financial Markets Authority (“FMA”) to provide financial advice. Kalkine provides only general financial advice through its research reports following a person becoming a member. The reports contain buy/sell/hold and other recommendations in relation to equity securities, managed funds and other managed investment schemes and other financial advice products. The recommendations and opinions in this report and on Kalkine website do not take into account any of your investment objectives, financial situation or needs. Before you make a decision about whether to acquire a financial product, you should obtain the Product Disclosure Statement from the product issuer. You should consider the appropriateness of advice taking into account your own objectives, financial situation and needs and seek independent financial advice before making any financial decisions. If you act on the advice in the research reports, you may have to pay fees, expenses or other amounts (but not to Kalkine). Further information about the complaints and dispute resolution process, as well as information about Kalkine’s duties are available on Kalkine’s website. Please read our Financial Advice Provider (FAP) disclosure statement and Complaints Handling Guide, which are available on the website.
Past performance is not a reliable indicator of future performance.
 Please wait processing your request...