
Section 1: Company Overview and Fundamentals
1.1 Company Overview:
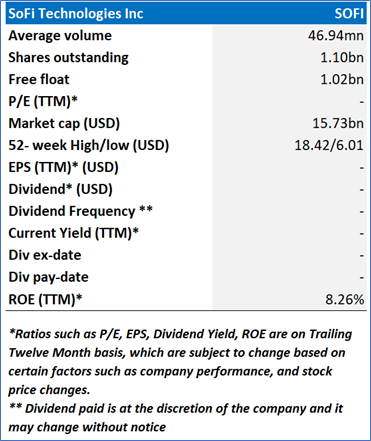
SoFi Technologies, Inc. (NASDAQ: SOFI) is a provider of financial services. The Company, through its lending and financial services products, allows members to borrow, save, spend, invest, and protect their money. It operates through three segments: Lending, Technology Platform and Financial Services. The Lending Segment offers personal loans, student loans, home loans and related servicing. Its platform supports the full transaction lifecycle, including credit application, underwriting, approval, funding, and servicing.
Kalkine’s American Tech Report covers the Company Overview, Key positives & negatives, Investment summary, Key investment metrics, Top 10 shareholding, Business updates and insights into company recent financial results, Key Risks & Outlook, Price performance and technical summary, Target Price, and Recommendation on the stock.
Price Performance:
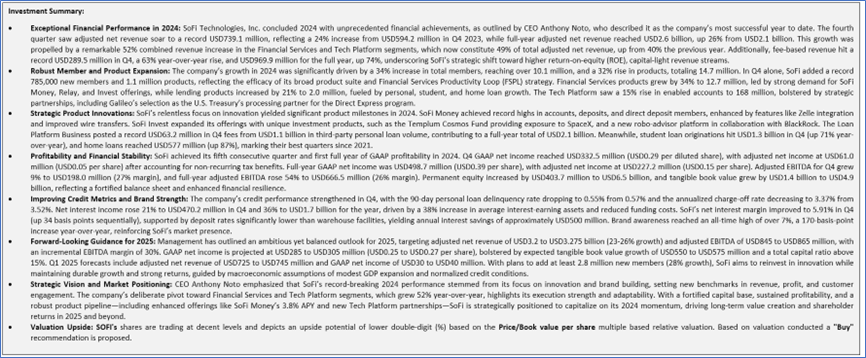
1.2 The Key Positives, Negatives, and Investment summary

1.3 Top 10 shareholders:
The top 10 shareholders together form ~27.11% of the total shareholding, signifying concentrated shareholding. The Vanguard Group, Inc., and BlackRock Institutional Trust Company, N.A. are the biggest shareholders, holding the maximum stake in the company at ~8.95% and ~3.84%, respectively.

1.4 Key Metrics:
From 2020 to 2024, SoFi Technologies, Inc. demonstrated remarkable financial growth, with total net revenue increasing significantly from USD751 million in 2020 to a record USD3,766 million in 2024, reflecting a compound annual growth rate (CAGR) of approximately 50%, driven by robust expansion in its financial services and technology platforms. Total noninterest income also rose steadily, reaching USD958 million in 2024 from USD388 million in 2020, underscoring the success of fee-based and capital-light revenue streams, such as loan platform fees and interchange revenue. However, despite consistent revenue growth, SoFi reported net losses from 2020 to 2023, ranging from USD224.05 million to USD300.74 million, primarily due to high operating costs, investments in growth, and macroeconomic challenges; the pivotal shift to a net income of USD498.67 million in 2024 marks its first year of GAAP profitability, signaling improved operational efficiency, cost management, and a strategic focus on higher-margin products, as evidenced by its record adjusted EBITDA and member growth in Q4 2024. This turnaround highlights SoFi’s resilience and ability to leverage its innovative fintech model, though sustained profitability will depend on managing credit risks, interest rate volatility, and competitive pressures in 2025 and beyond.

Section 2: Business Updates and Financial Highlights
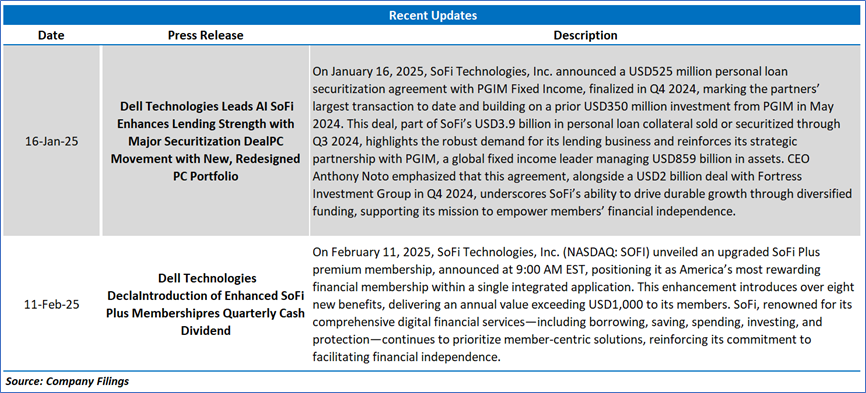
2.1 Recent Updates:
The below picture gives an overview of the recent updates:
2.2 Insights of FY24:

Section 3: Key Risks and Outlook:


Section 4: Stock Recommendation Summary:
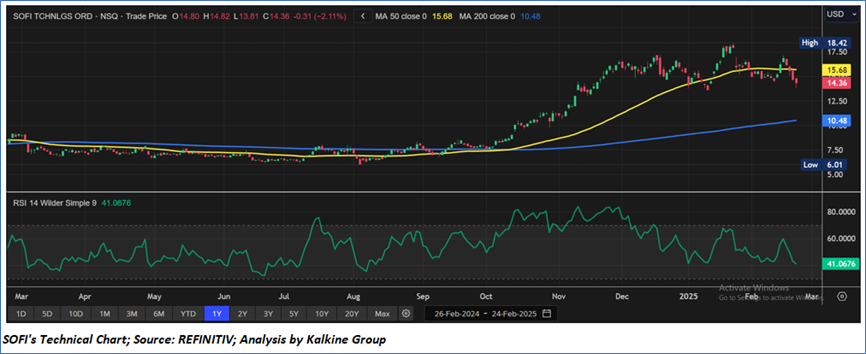
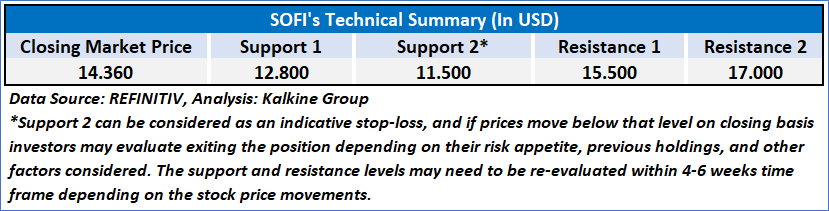
4.1 Technical Summary:
Price Performance:
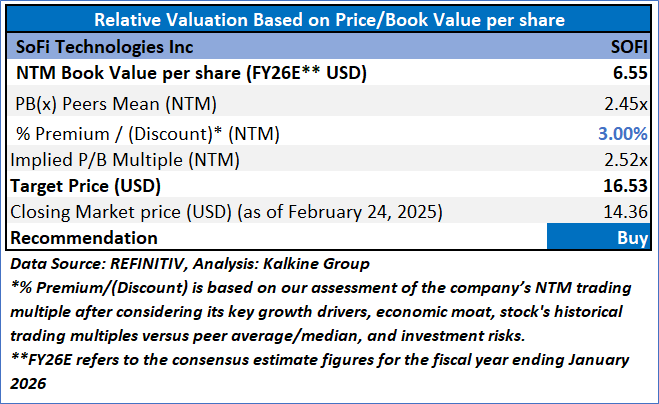
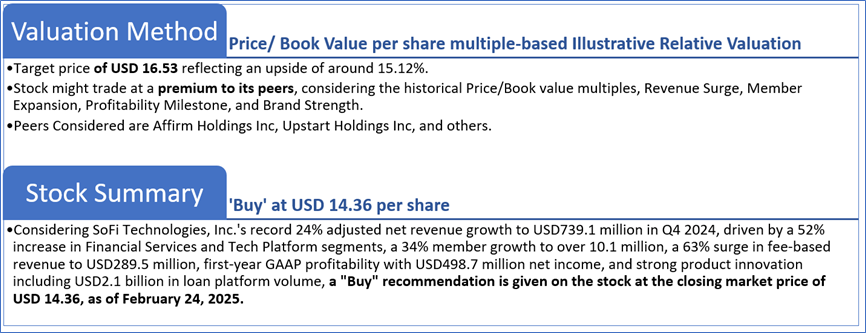
4.2 Fundamental Valuation
Valuation Methodology: Price/Book Value Per Share Multiple Based Relative Valuation
Markets are trading in a highly volatile zone currently due to certain macroeconomic issues and geopolitical tensions prevailing. Therefore, it is prudent to follow a cautious approach while investing.
Note 1: Past performance is not a reliable indicator of future performance.
Note 2: The reference date for all price data, currency, technical indicators, support, and resistance levels is February 24, 2025. The reference data in this report has been partly sourced from REFINITIV.
Note 3: Investment decisions should be made depending on an individual's appetite for upside potential, risks, holding duration, and any previous holdings. An 'Exit' from the stock can be considered if the Target Price mentioned as per the Valuation and or the technical levels provided has been achieved and is subject to the factors discussed above.
Note 4: The report publishing date is as per the Pacific Time Zone.
Technical Indicators Defined: -
Support: A level at which the stock prices tend to find support if they are falling, and a downtrend may take a pause backed by demand or buying interest. Support 1 refers to the nearby support level for the stock and if the price breaches the level, then Support 2 may act as the crucial support level for the stock.
Resistance: A level at which the stock prices tend to find resistance when they are rising, and an uptrend may take a pause due to profit booking or selling interest. Resistance 1 refers to the nearby resistance level for the stock and if the price surpasses the level, then Resistance 2 may act as the crucial resistance level for the stock.
Stop-loss: It is a level to protect against further losses in case of unfavorable movement in the stock prices.
Disclaimer This report has been issued by Kalkine New Zealand Limited (FSP691351) (NZBN:9429047678101) (“Kalkine”). Kalkine is a Financial Advice Provider (“FAP”) and is authorised by a Class 1 Financial Advice Provider Licence issued by Financial Markets Authority (“FMA”) to provide financial advice. Kalkine provides only general financial advice through its research reports following a person becoming a member. The reports contain buy/sell/hold and other recommendations in relation to equity securities, managed funds and other managed investment schemes and other financial advice products. The recommendations and opinions in this report and on Kalkine website do not take into account any of your investment objectives, financial situation or needs. Before you make a decision about whether to acquire a financial product, you should obtain the Product Disclosure Statement from the product issuer. You should consider the appropriateness of advice taking into account your own objectives, financial situation and needs and seek independent financial advice before making any financial decisions. If you act on the advice in the research reports, you may have to pay fees, expenses or other amounts (but not to Kalkine). Further information about the complaints and dispute resolution process, as well as information about Kalkine’s duties are available on Kalkine’s website. Please read our Financial Advice Provider (FAP) disclosure statement and Complaints Handling Guide, which are available on the website.
Past performance is not a reliable indicator of future performance.
 Please wait processing your request...