
Section 1: Company Overview and Fundamentals
1.1 Company Overview:
Snowflake Inc. (NYSE: SNOW) enables every organization to mobilize their data with Snowflakes Data Cloud. The Company’s platform powers the Data Cloud, enabling customers to consolidate data into a single source of truth to drive meaningful business insights, apply artificial intelligence (AI) to solve business problems, build data applications, and share data and data products. Its platform supports a range of workload, including data warehouse, data lake, data engineering, AI/machine learning (ML), applications, collaboration, cybersecurity, and Unistore.
Kalkine’s American Tech Report covers the Company Overview, Key positives & negatives, Investment summary, Key investment metrics, Top 10 shareholding, Business updates and insights into company recent financial results, Key Risks & Outlook, Price performance and technical summary, Target Price, and Recommendation on the stock.
Stock Performance:
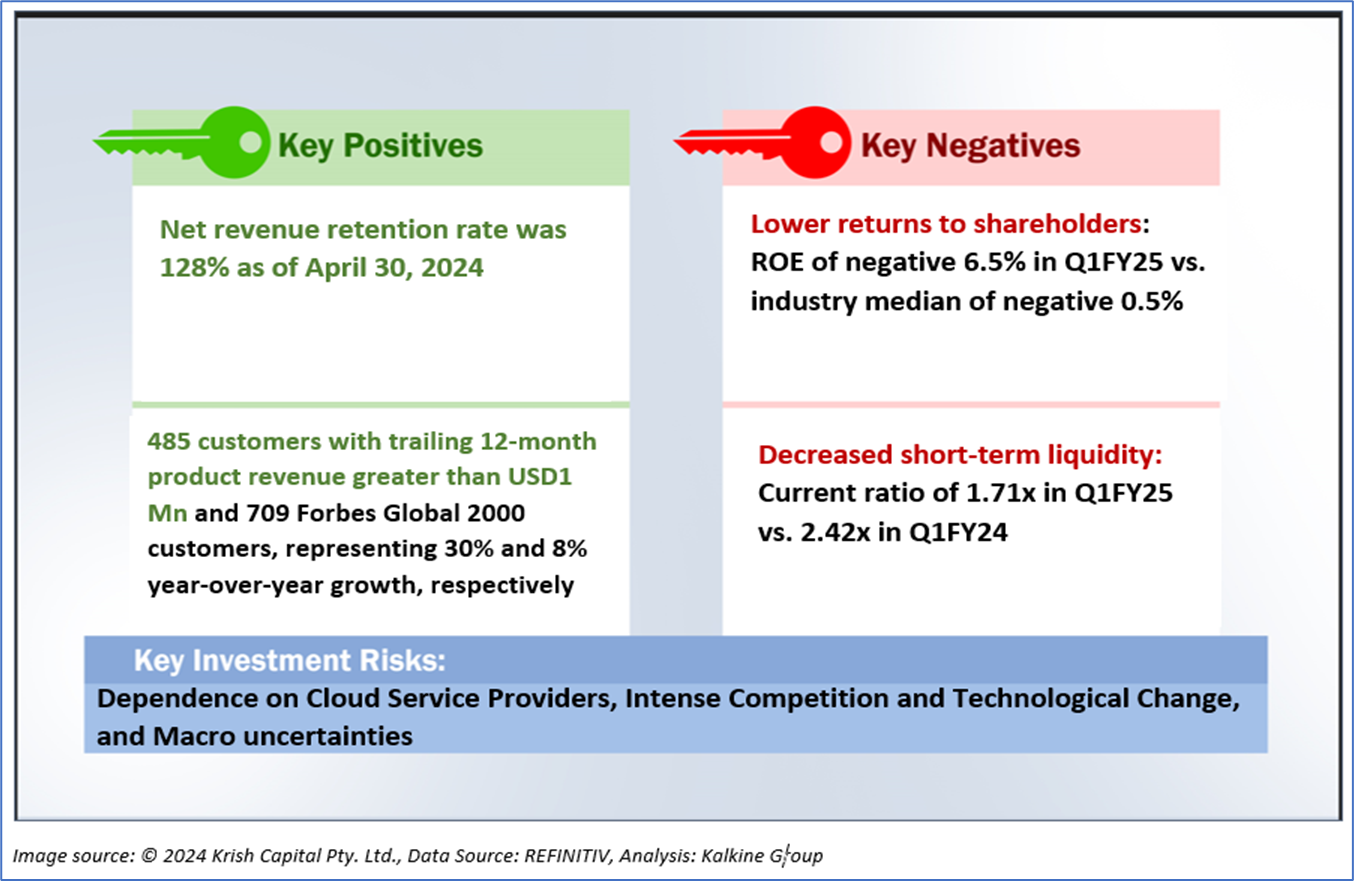
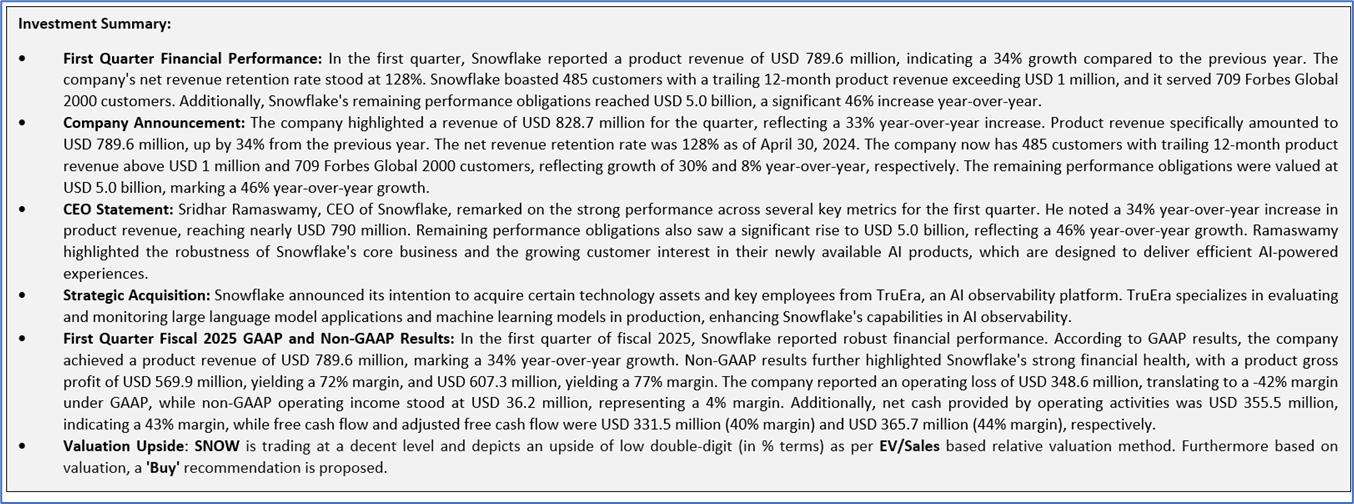
1.2 The Key Positives, Negatives, and Investment summary
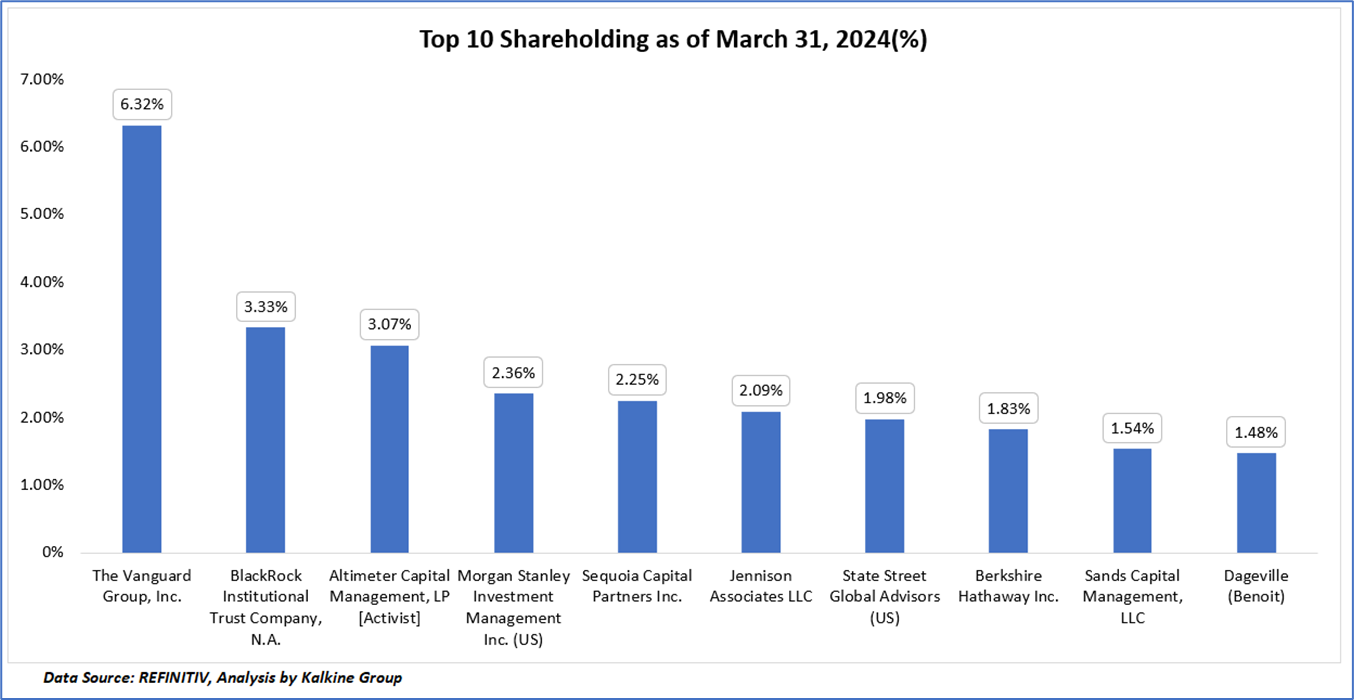
1.3 Top 10 shareholders:
The top 10 shareholders together form ~26.25% of the total shareholding, signifying diverse shareholding. The Vanguard Group, Inc., and BlackRock Institutional Trust Company, N.A., are the biggest shareholders, holding the maximum stake in the company at ~6.32% and ~3.33%, respectively.
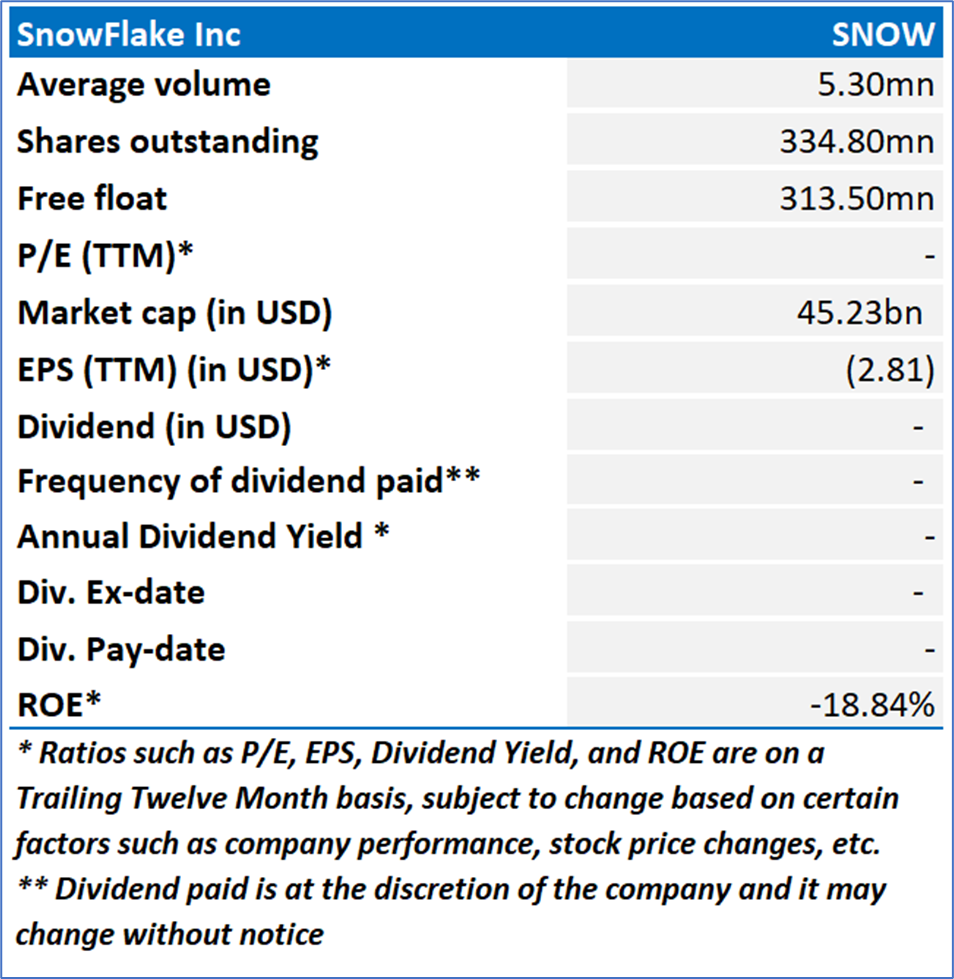
1.4 Key Metrics:
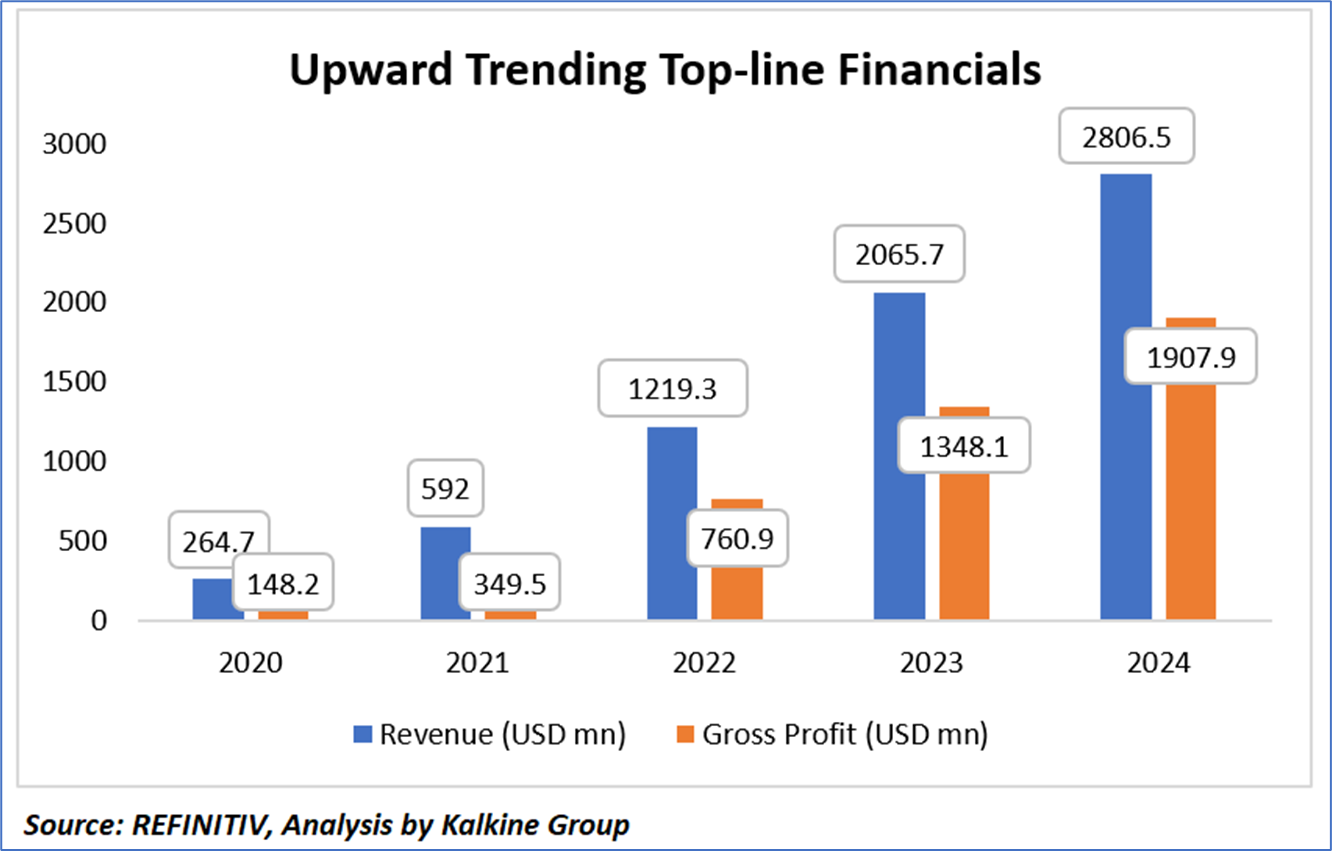
Between 2020 and 2024, Snowflake exhibited impressive growth in both revenue and gross profit, reflecting the company's robust market performance and operational efficiency. In 2020, Snowflake reported a revenue of USD 264.7 million, which more than doubled to USD 592 million in 2021. This remarkable growth trajectory continued, with revenue increasing to USD 1219.3 million in 2022, USD 2065.7 million in 2023, and reaching USD 2806.5 million in 2024. Such consistent revenue growth over these five years highlights Snowflake's strong market presence and effective sales strategies.
Parallel to revenue growth, Snowflake's gross profit also saw significant increases, underscoring the company's ability to scale efficiently. In 2020, the gross profit was USD 148.2 million, which surged to USD 349.5 million in 2021. By 2022, gross profit had more than doubled again to USD 760.9 million. This upward trend continued with gross profit reaching USD 1348.1 million in 2023 and USD 1907.9 million in 2024. The substantial increase in gross profit, along with the rising revenue, indicates Snowflake's growing profitability and operational excellence, suggesting a strong potential for continued financial success in the future.
Section 2: Business Updates and Corporate Business Highlights
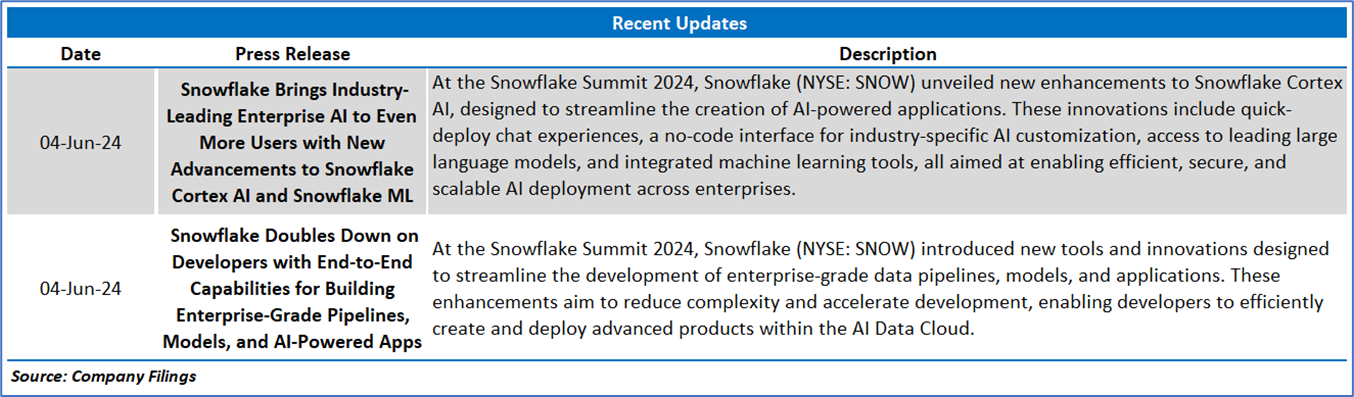
2.1 Recent Updates:
The below picture gives an overview of the recent updates:
2.2 Insights of Q1FY25:

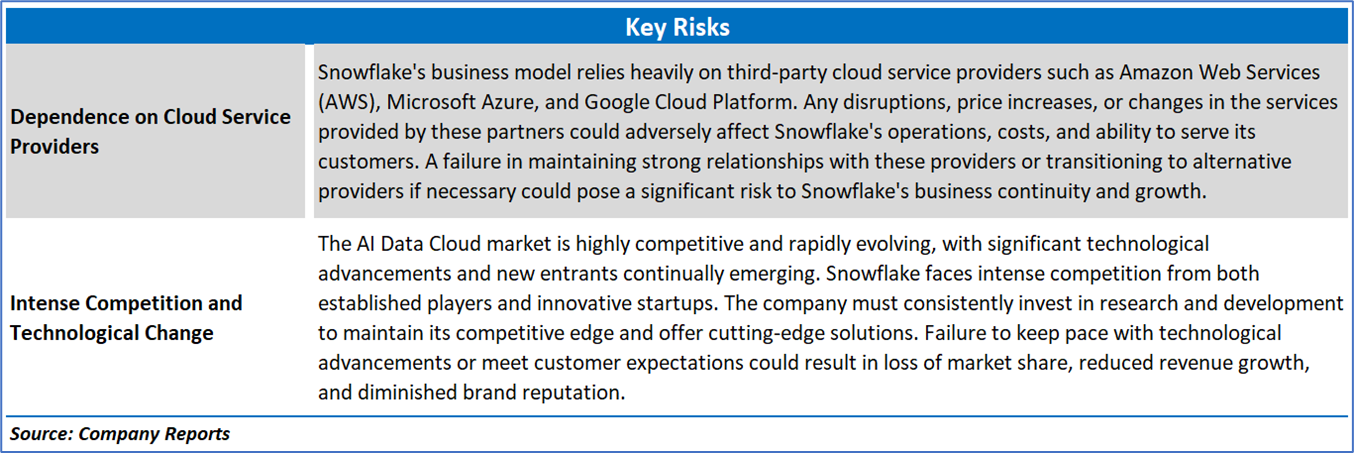
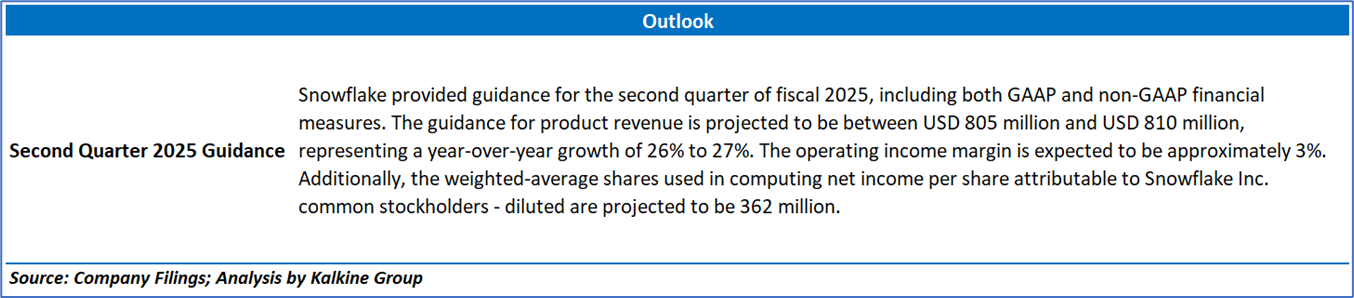
Section 3: Key Risks & Outlook:
Section 4: Stock Recommendation Summary:
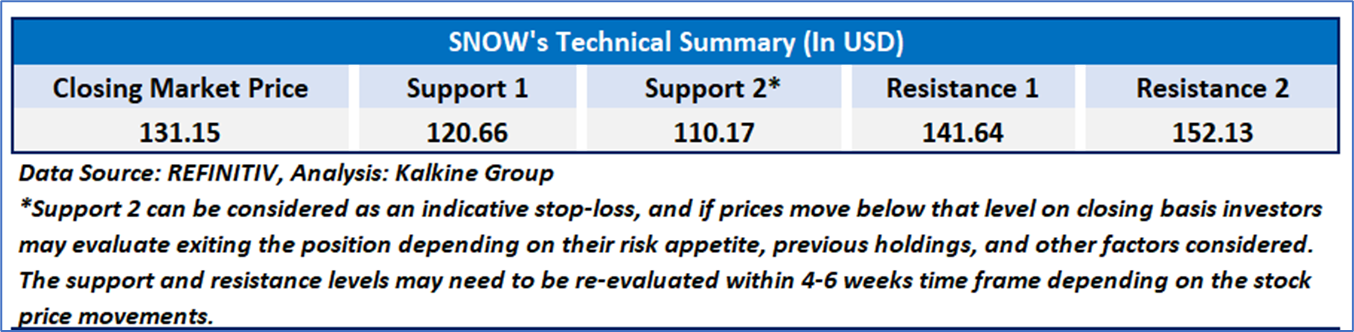
4.1 Price Performance and Technical Summary:
Stock Performance:

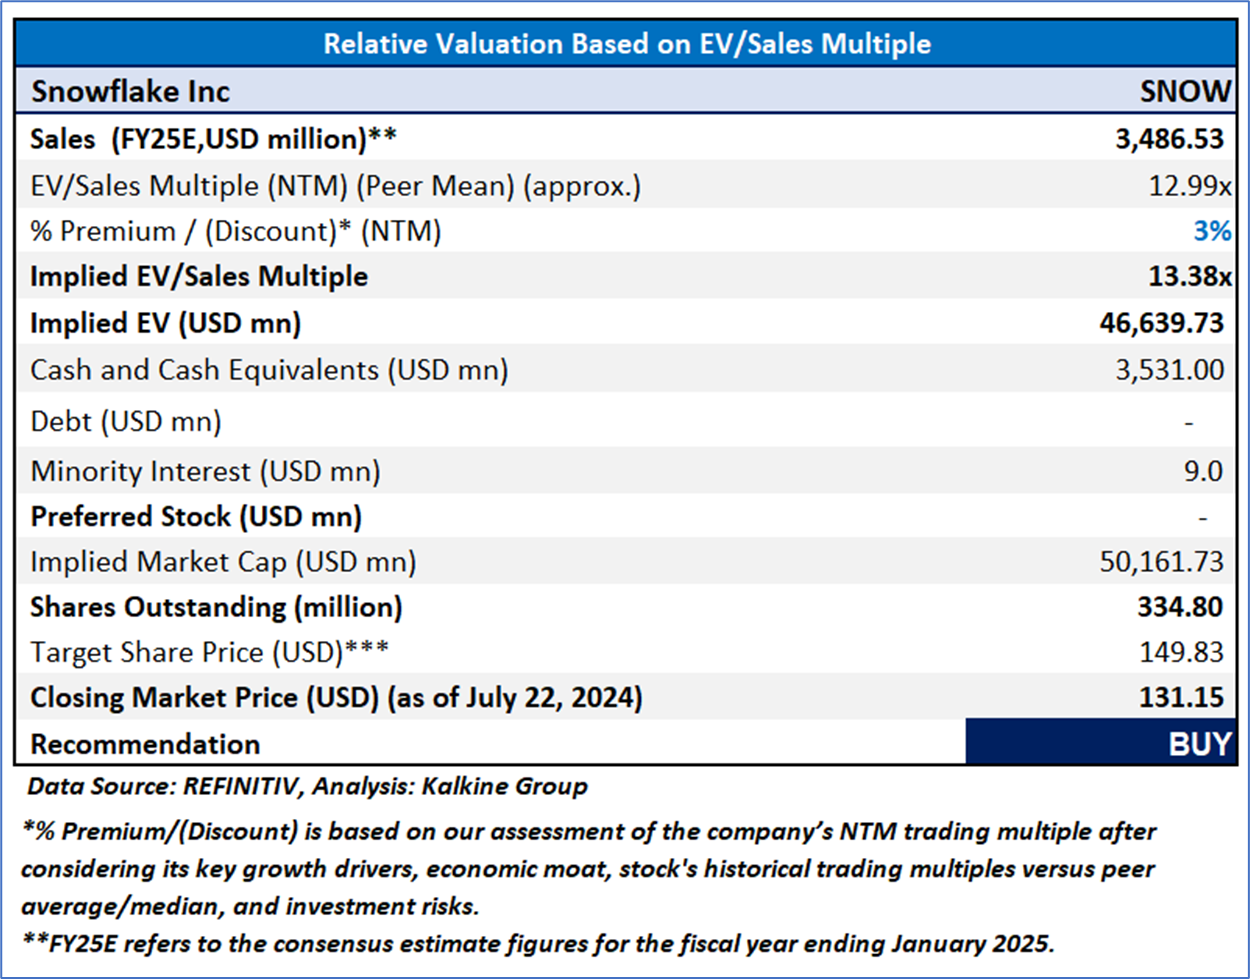
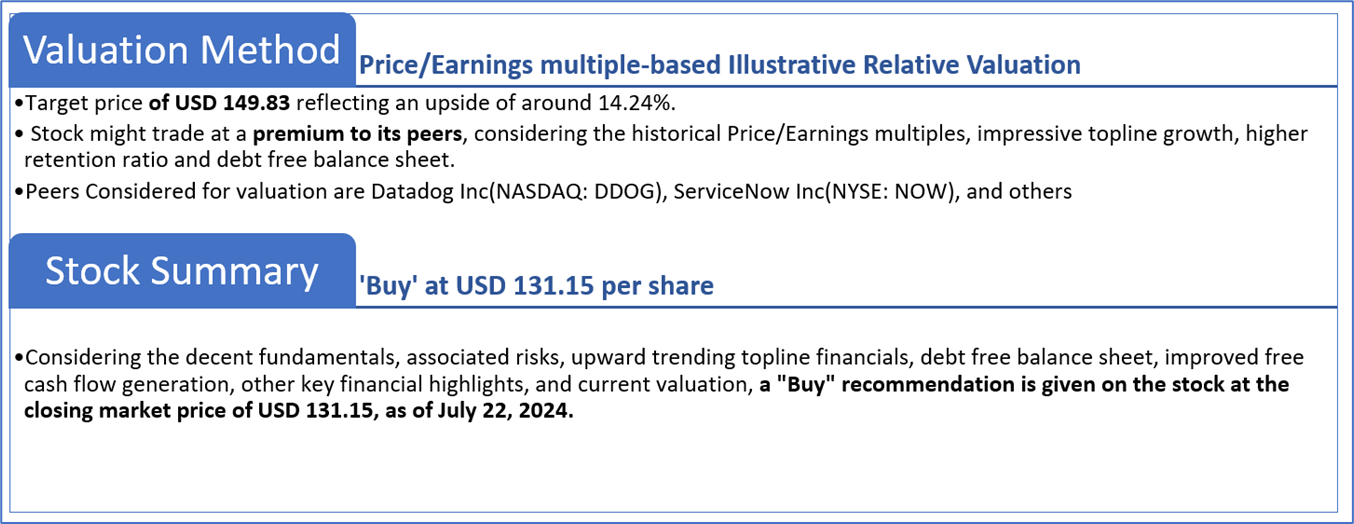
4.2 Fundamental Valuation
Valuation Methodology: EV/Sales Multiple Based Relative Valuation
Markets are trading in a highly volatile zone currently due to certain macroeconomic issues and geopolitical tensions prevailing. Therefore, it is prudent to follow a cautious approach while investing.
Note 1: Past performance is not a reliable indicator of future performance.
Note 2: The reference date for all price data, currency, technical indicators, support, and resistance levels is July 22, 2024. The reference data in this report has been partly sourced from REFINITIV.
Note 3: Investment decisions should be made depending on an individual's appetite for upside potential, risks, holding duration, and any previous holdings. An 'Exit' from the stock can be considered if the Target Price mentioned as per the Valuation and or the technical levels provided has been achieved and is subject to the factors discussed above.
Note 4: The report publishing date is as per the Pacific Time Zone.
Technical Indicators Defined: -
Support: A level at which the stock prices tend to find support if they are falling, and a downtrend may take a pause backed by demand or buying interest. Support 1 refers to the nearby support level for the stock and if the price breaches the level, then Support 2 may act as the crucial support level for the stock.
Resistance: A level at which the stock prices tend to find resistance when they are rising, and an uptrend may take a pause due to profit booking or selling interest. Resistance 1 refers to the nearby resistance level for the stock and if the price surpasses the level, then Resistance 2 may act as the crucial resistance level for the stock.
Stop-loss: It is a level to protect against further losses in case of unfavorable movement in the stock prices.
Disclaimer This report has been issued by Kalkine New Zealand Limited (FSP691351) (NZBN:9429047678101) (“Kalkine”). Kalkine is a Financial Advice Provider (“FAP”) and is authorised by a Class 1 Financial Advice Provider Licence issued by Financial Markets Authority (“FMA”) to provide financial advice. Kalkine provides only general financial advice through its research reports following a person becoming a member. The reports contain buy/sell/hold and other recommendations in relation to equity securities, managed funds and other managed investment schemes and other financial advice products. The recommendations and opinions in this report and on Kalkine website do not take into account any of your investment objectives, financial situation or needs. Before you make a decision about whether to acquire a financial product, you should obtain the Product Disclosure Statement from the product issuer. You should consider the appropriateness of advice taking into account your own objectives, financial situation and needs and seek independent financial advice before making any financial decisions. If you act on the advice in the research reports, you may have to pay fees, expenses or other amounts (but not to Kalkine). Further information about the complaints and dispute resolution process, as well as information about Kalkine’s duties are available on Kalkine’s website. Please read our Financial Advice Provider (FAP) disclosure statement and Complaints Handling Guide, which are available on the website.
Past performance is not a reliable indicator of future performance.
 Please wait processing your request...