Section 1: Company Overview and Fundamentals
Company Overview:
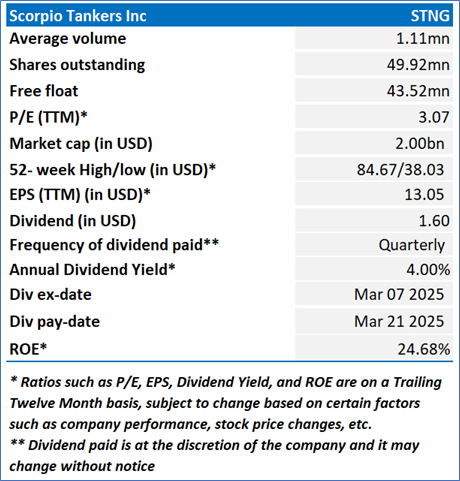
Scorpio Tankers Inc (NYSE: STNG) is a Monaco-based provider in the transportation of refined petroleum products. The Company involves in the oil, seaborne transportation of refined petroleum products from the tanker industry to the international shipping markets. It operates through four segments: Handymax, MR (Medium Range), Long Range 1 (LR1)/Panamax and Long Range 2 (LR2)/Aframax.
Kalkine’s Diversified Opportunities Report covers the Company Overview, Key positives & negatives, Investment summary, Key investment metrics, Top 10 shareholding, Business updates and insights into company recent financial results, Key Risks & Outlook, Price performance and technical summary, Target Price, and Recommendation on the stock.
Stock Performance:
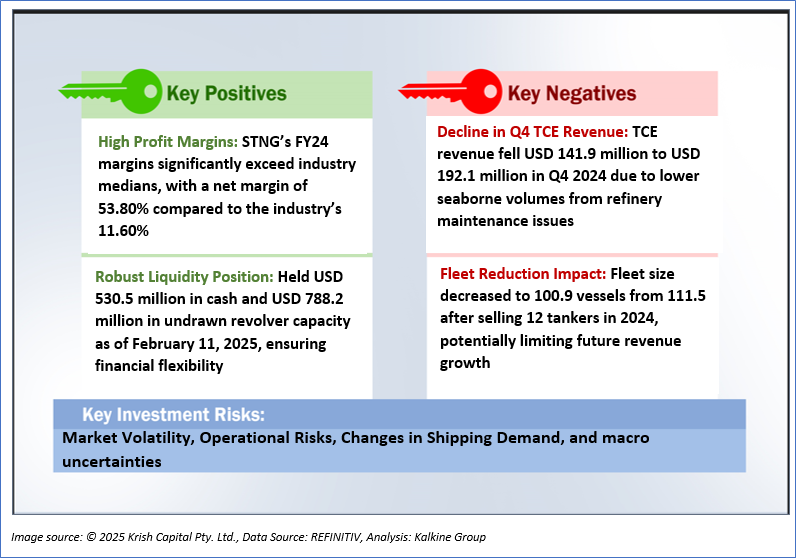
1.2 The Key Positives, Negatives, and Investment summary
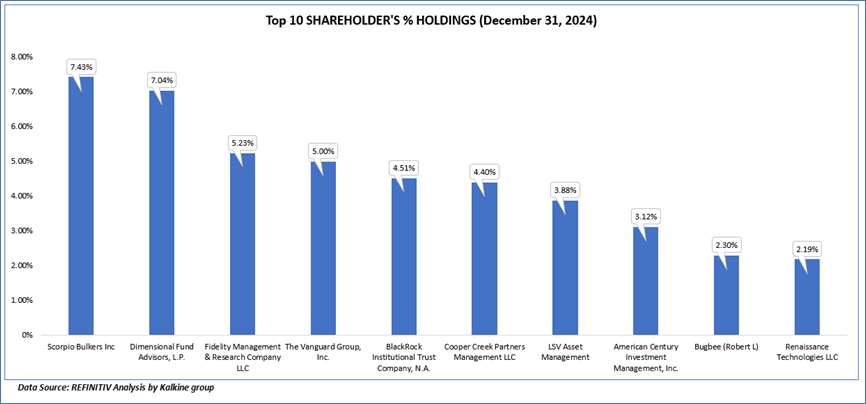
1.3 Top 10 shareholders:
The top 10 shareholders together form ~45.10% of the total shareholding, signifying concentrated shareholding. Scorpio Bulkers Inc and Dimensional Fund Advisors, L.P. are the biggest shareholders, holding the maximum stake in the company at 7.43% and 7.04%, respectively.
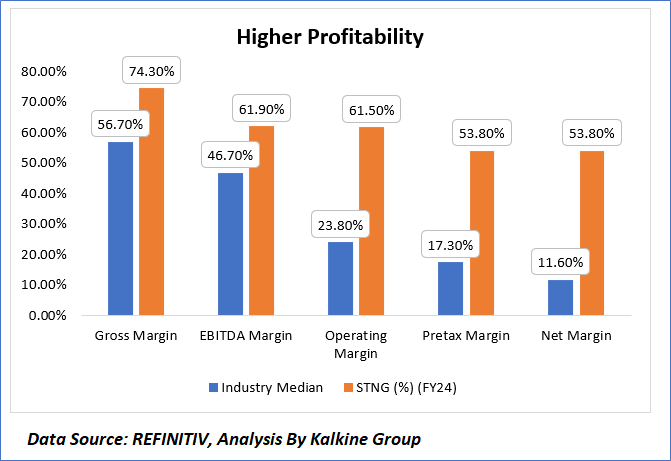
1.4 Key Metrics
Scorpio Tankers Inc. (NYSE: STNG) exhibits exceptional financial performance in FY 2024, significantly outperforming industry medians across key profitability metrics, which underscores its operational efficiency and justifies a potential premium valuation compared to peers. The Company achieved a gross margin of 74.3% against an industry median of 56.7%, reflecting superior cost management in vessel operations despite a reduced fleet size. Its EBITDA margin of 61.9% and operating margin of 61.5% far exceed the industry medians of 46.7% and 23.8%, respectively, driven by strong TCE revenue from time charters (e.g., USD 30,803 per day for LR2 vessels in Q4 2024) and effective deleveraging efforts that lowered financial expenses by USD 27.9 million in Q4. Additionally, STNG’s pretax margin of 53.8% and net margin of 53.8% surpass the industry medians of 17.3% and 11.6%, respectively, bolstered by a 32% annual net income growth to USD 668.8 million and a USD 176.5 million gain on vessel sales, highlighting its ability to generate substantial profits in a challenging market environment characterized by declining seaborne volumes and refinery maintenance issues.
`
Section 2: Business Updates and Corporate Business Highlights
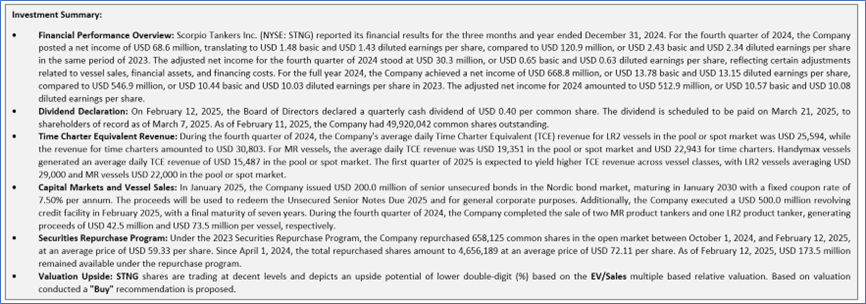
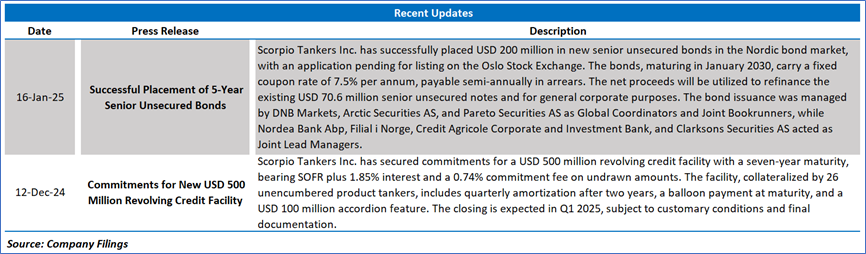
2.1 Recent Updates:
The below picture gives an overview of the recent updates:
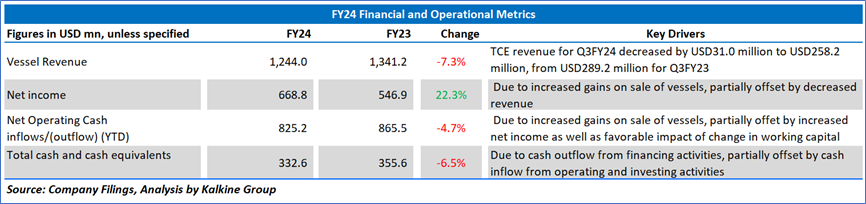
2.2 Insights of FY24:
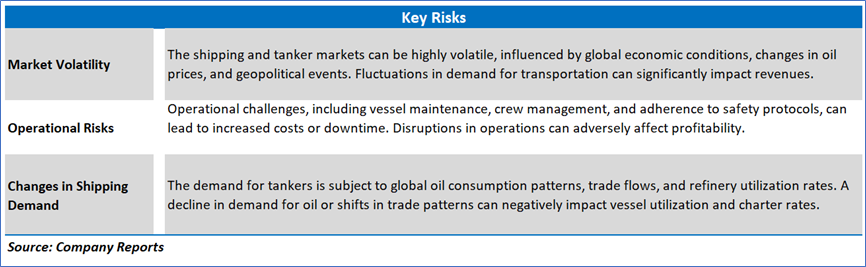
Section 3: Key Risks & Outlook
Section 4: Stock Recommendation Summary:
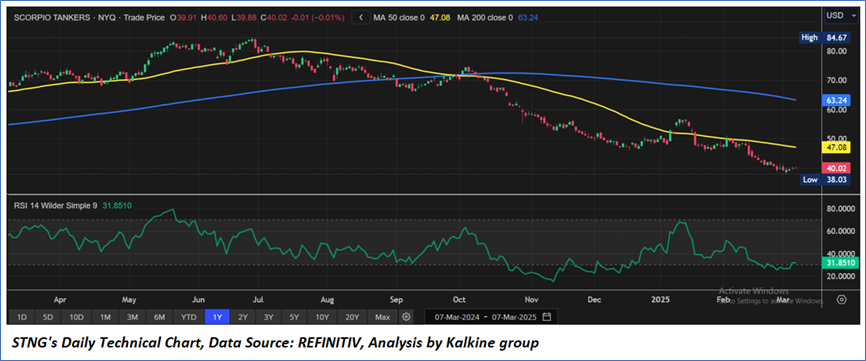
4.1 Price Performance and Technical Summary:
Stock Performance:
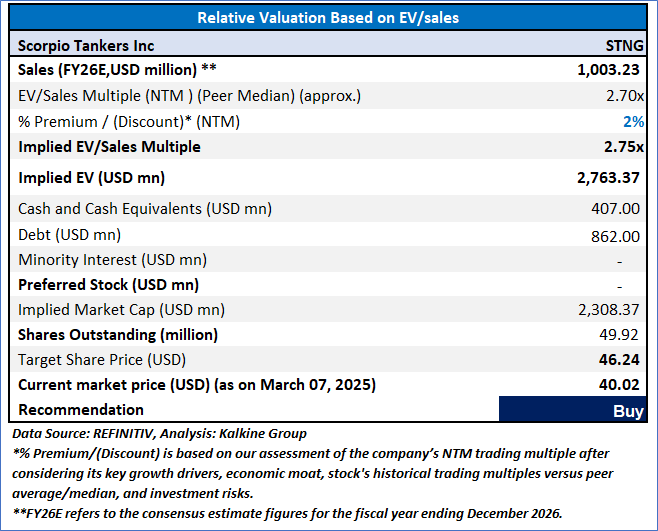
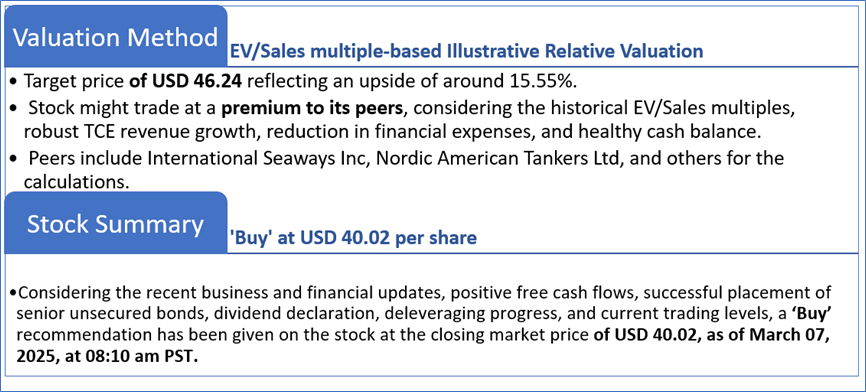
4.2 Fundamental Valuation
Valuation Methodology: EV/Sales Multiple Based Relative Valuation
Markets are trading in a highly volatile zone currently due to certain macroeconomic issues and geopolitical tensions prevailing. Therefore, it is prudent to follow a cautious approach while investing.
Note 1: Past performance is not a reliable indicator of future performance.
Note 2: The reference date for all price data, currency, technical indicators, support, and resistance levels is March 07, 2025. The reference data in this report has been partly sourced from REFINITIV.
Note 3: Investment decisions should be made depending on an individual's appetite for upside potential, risks, holding duration, and any previous holdings. An 'Exit' from the stock can be considered if the Target Price mentioned as per the Valuation and or the technical levels provided has been achieved and is subject to the factors discussed above.
Note 4: The report publishing date is as per the Pacific Time Zone.
Technical Indicators Defined: -
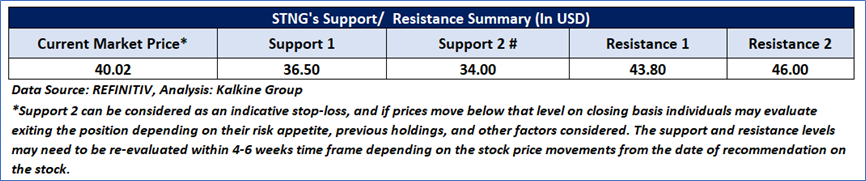
Support: A level at which the stock prices tend to find support if they are falling, and a downtrend may take a pause backed by demand or buying interest. Support 1 refers to the nearby support level for the stock and if the price breaches the level, then Support 2 may act as the crucial support level for the stock.
Resistance: A level at which the stock prices tend to find resistance when they are rising, and an uptrend may take a pause due to profit booking or selling interest. Resistance 1 refers to the nearby resistance level for the stock and if the price surpasses the level, then Resistance 2 may act as the crucial resistance level for the stock.
Stop-loss: It is a level to protect against further losses in case of unfavorable movement in the stock prices.
Disclaimer This report has been issued by Kalkine New Zealand Limited (FSP691351) (NZBN:9429047678101) (“Kalkine”). Kalkine is a Financial Advice Provider (“FAP”) and is authorised by a Class 1 Financial Advice Provider Licence issued by Financial Markets Authority (“FMA”) to provide financial advice. Kalkine provides only general financial advice through its research reports following a person becoming a member. The reports contain buy/sell/hold and other recommendations in relation to equity securities, managed funds and other managed investment schemes and other financial advice products. The recommendations and opinions in this report and on Kalkine website do not take into account any of your investment objectives, financial situation or needs. Before you make a decision about whether to acquire a financial product, you should obtain the Product Disclosure Statement from the product issuer. You should consider the appropriateness of advice taking into account your own objectives, financial situation and needs and seek independent financial advice before making any financial decisions. If you act on the advice in the research reports, you may have to pay fees, expenses or other amounts (but not to Kalkine). Further information about the complaints and dispute resolution process, as well as information about Kalkine’s duties are available on Kalkine’s website. Please read our Financial Advice Provider (FAP) disclosure statement and Complaints Handling Guide, which are available on the website.
Past performance is not a reliable indicator of future performance.
 Please wait processing your request...