
This report is an updated version of the report published on 24 September 2025 at 11:41 AM AEST.
Section 1: Company Overview and Fundamental Insights
1.1 Company Overview: Santos Limited (ASX: STO) is an Australian oil and gas exploration and production company headquartered in Adelaide, South Australia. Founded in 1954, it is one of Australia’s largest domestic suppliers of natural gas and liquefied natural gas (LNG), with operations across Australia, Papua New Guinea, Timor-Leste, and the United States. Santos owns and operates oil, gas, and LNG assets both onshore and offshore, supplying domestic markets and exporting LNG primarily to Asia. Kalkine’s Resources Report covers the Investment Highlights, Management Insights, Key Financial Metrics, Risks, Technical Analysis along with the Valuation, Target Price, and Recommendation on the stock.

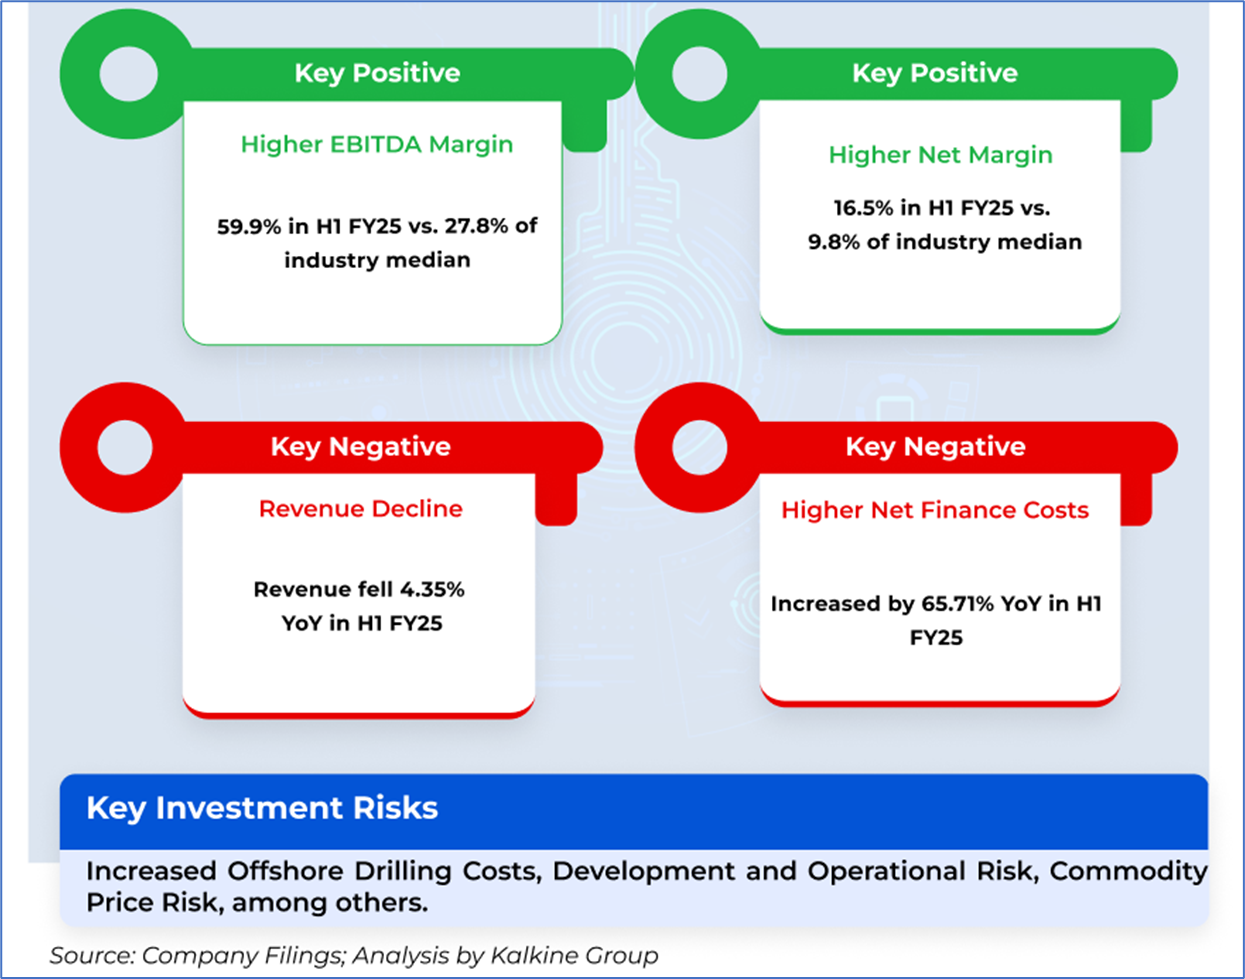
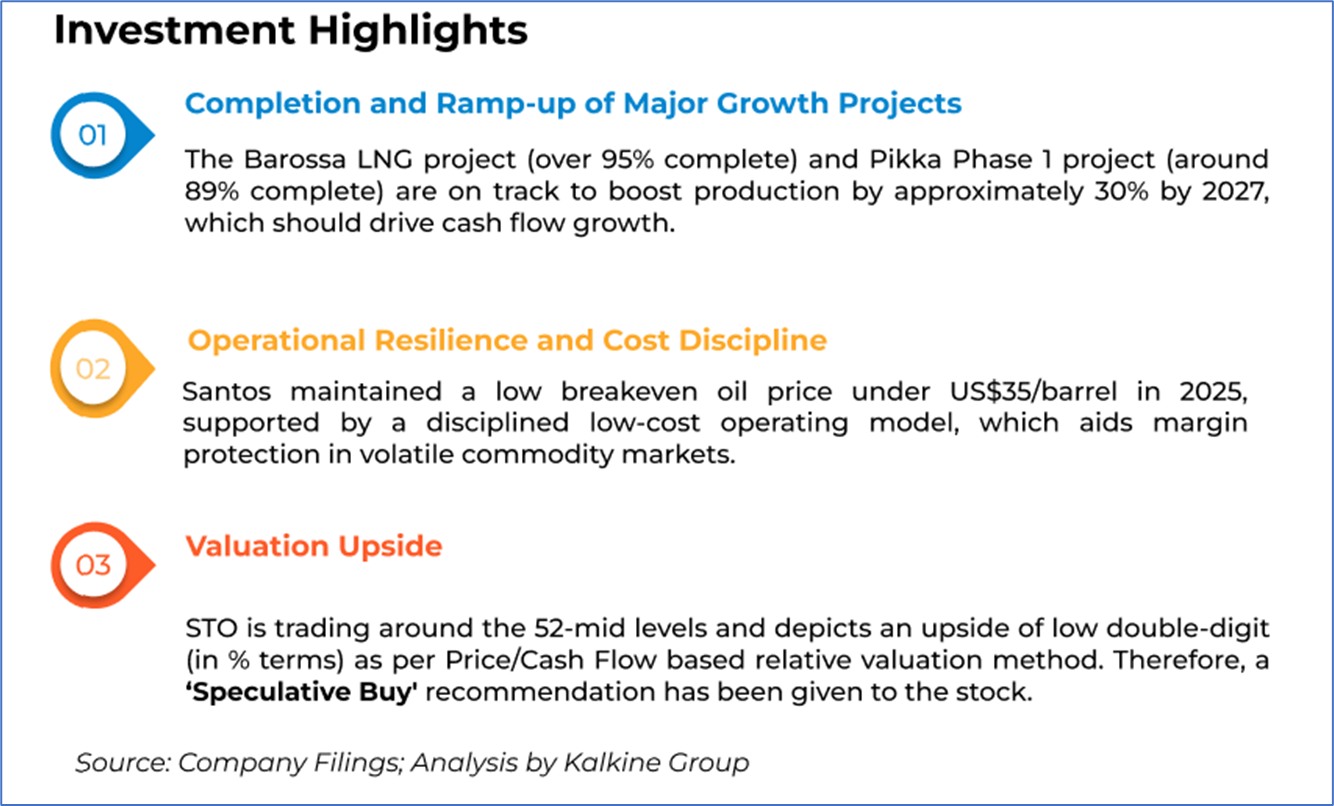
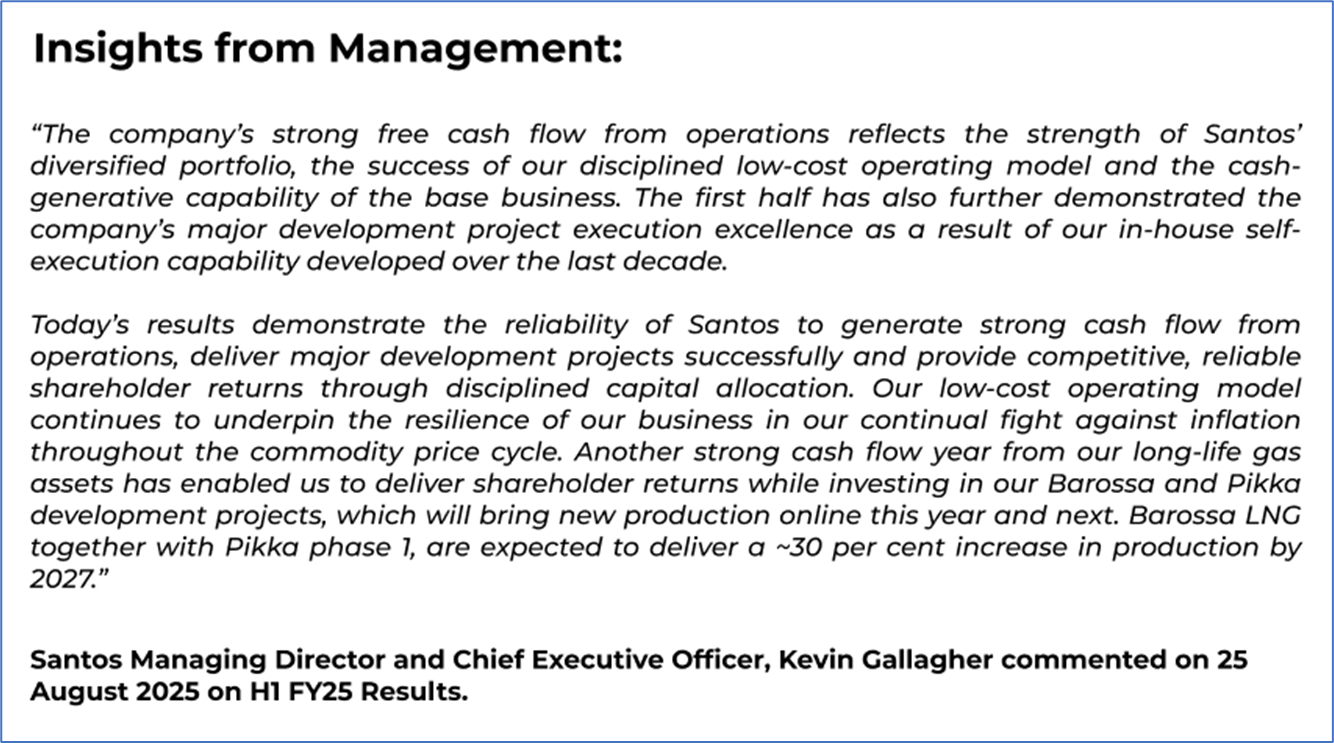
1.2 The Key Positives, Negatives, Investment Highlights, and Management Insights
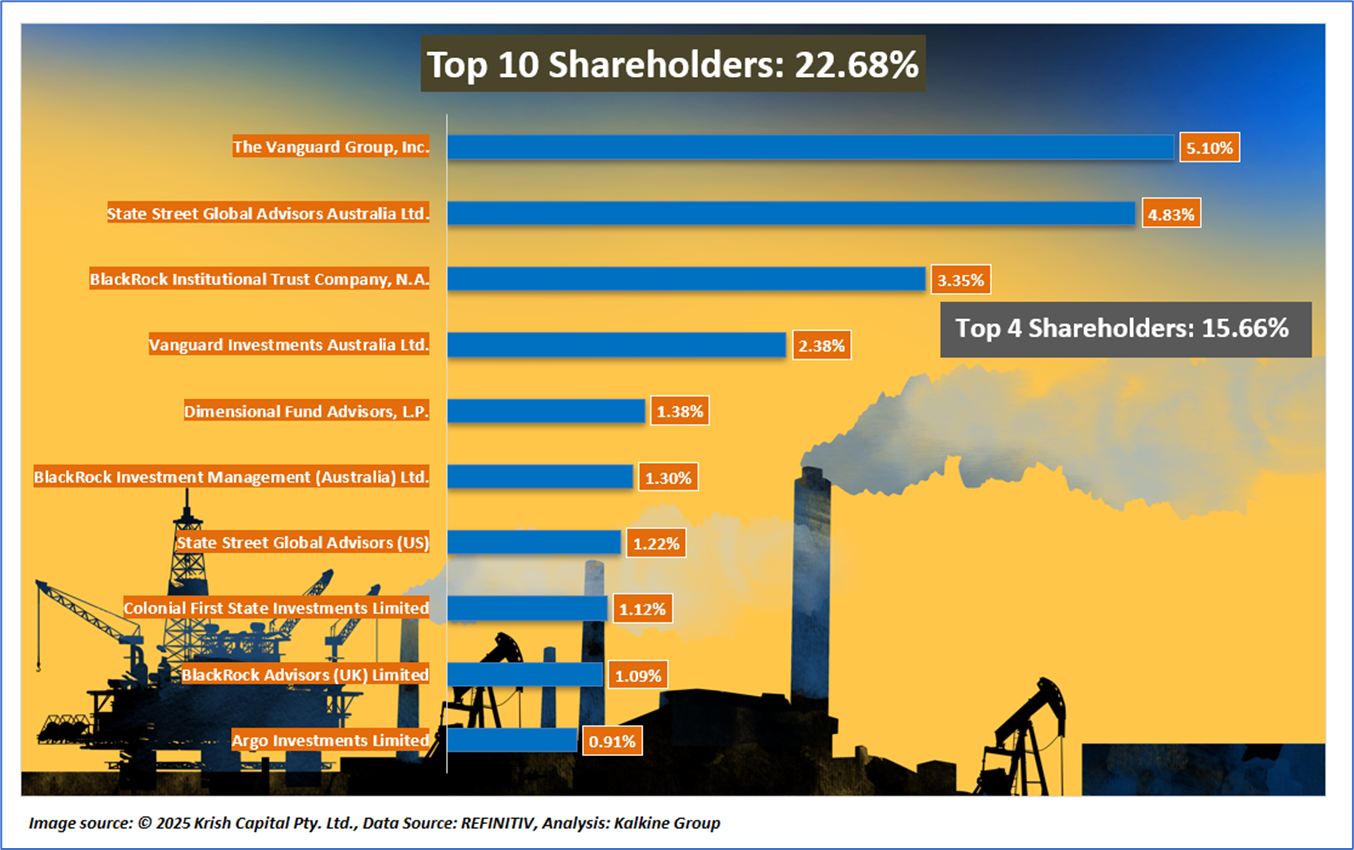
1.3 Top 10 Shareholders:
The top 10 shareholders together form 22.68% of the total shareholding. The Vanguard Group, Inc. and State Street Global Advisors Australia Ltd. hold maximum stakes in the company at 5.10% and 4.83%, respectively.
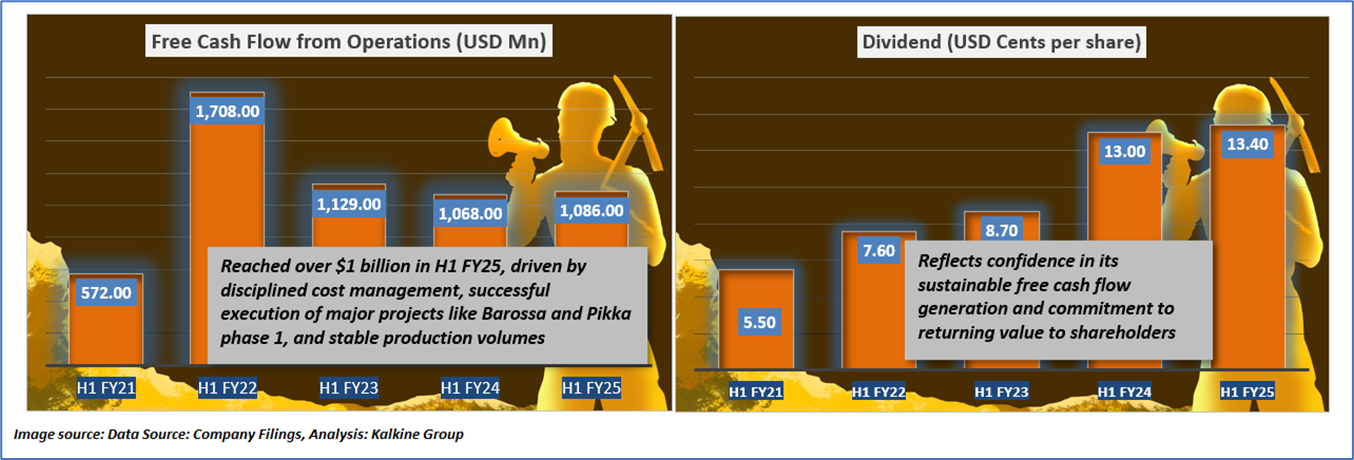
1.4 Key Metrics and Milestones: The trend in Santos’ free cash flow from operations and dividends reflects the company’s operational execution and strategic growth initiatives. Since H1 FY21, Santos has significantly ramped up its free cash flow, driven by disciplined cost management and the successful advancement of large-scale projects such as Barossa and Pikka phase 1. These projects have de-risked production volumes and improved cost efficiency, enabling the company to generate stable cash flows above US$1 billion in recent half-years. This stable cash flow foundation supports a progressive increase in dividends, highlighting Santos’ commitment to returning value to shareholders while maintaining resources for reinvestment and sustainable growth. The aligned growth in cash flow and dividends embodies Santos’ strategy to balance operational excellence, capital discipline, and shareholder returns in a challenging energy market environment.
Section 2: Business Updates, Financial and Operational Highlights
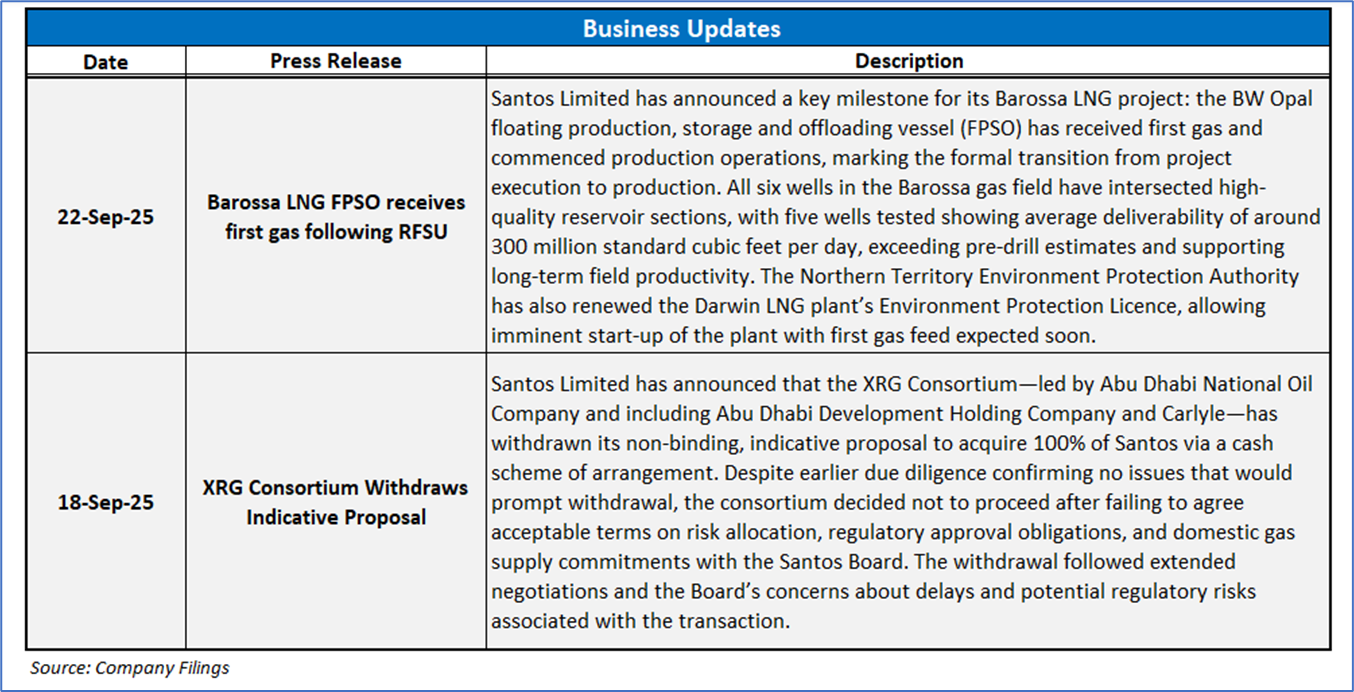
2.1 Recent Business Updates:
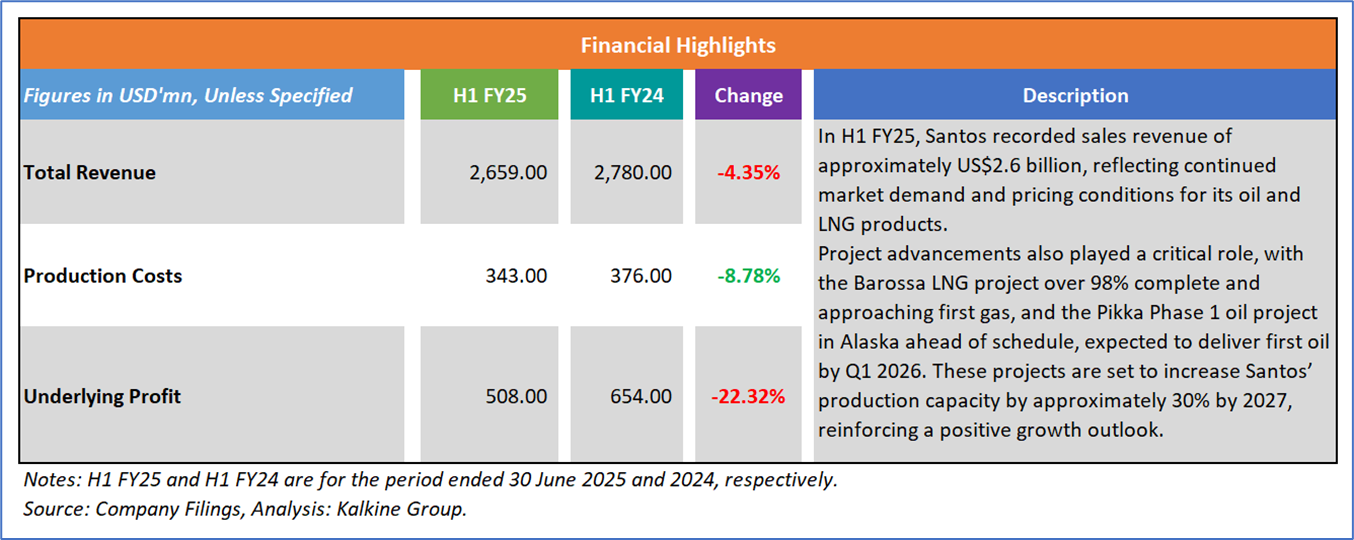
2.2 Financial Highlights: Below mentioned are some key financial highlights:
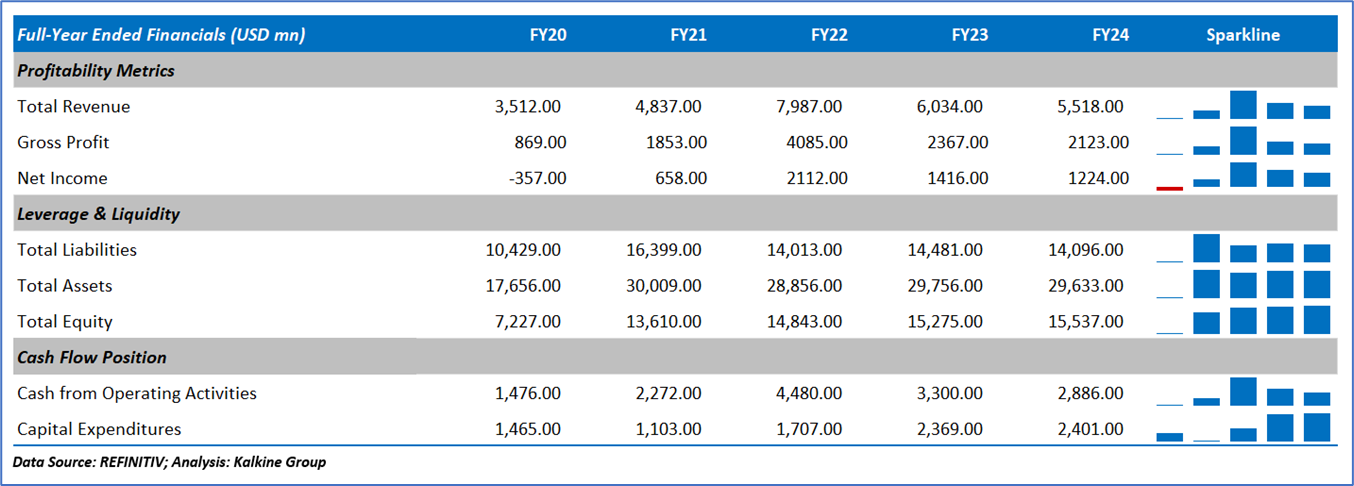
2.3 Historical Financial Trend
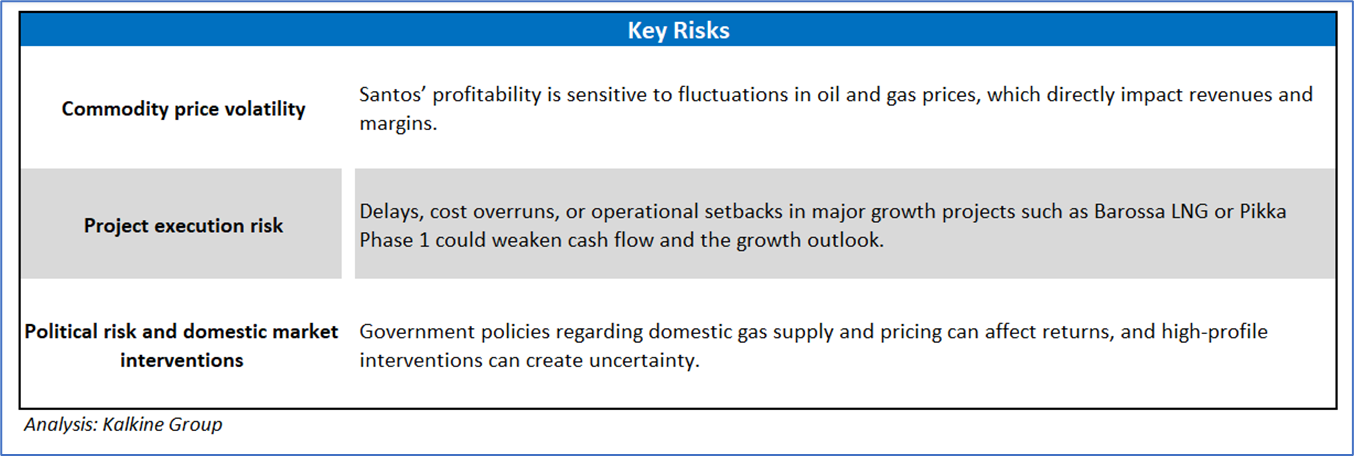
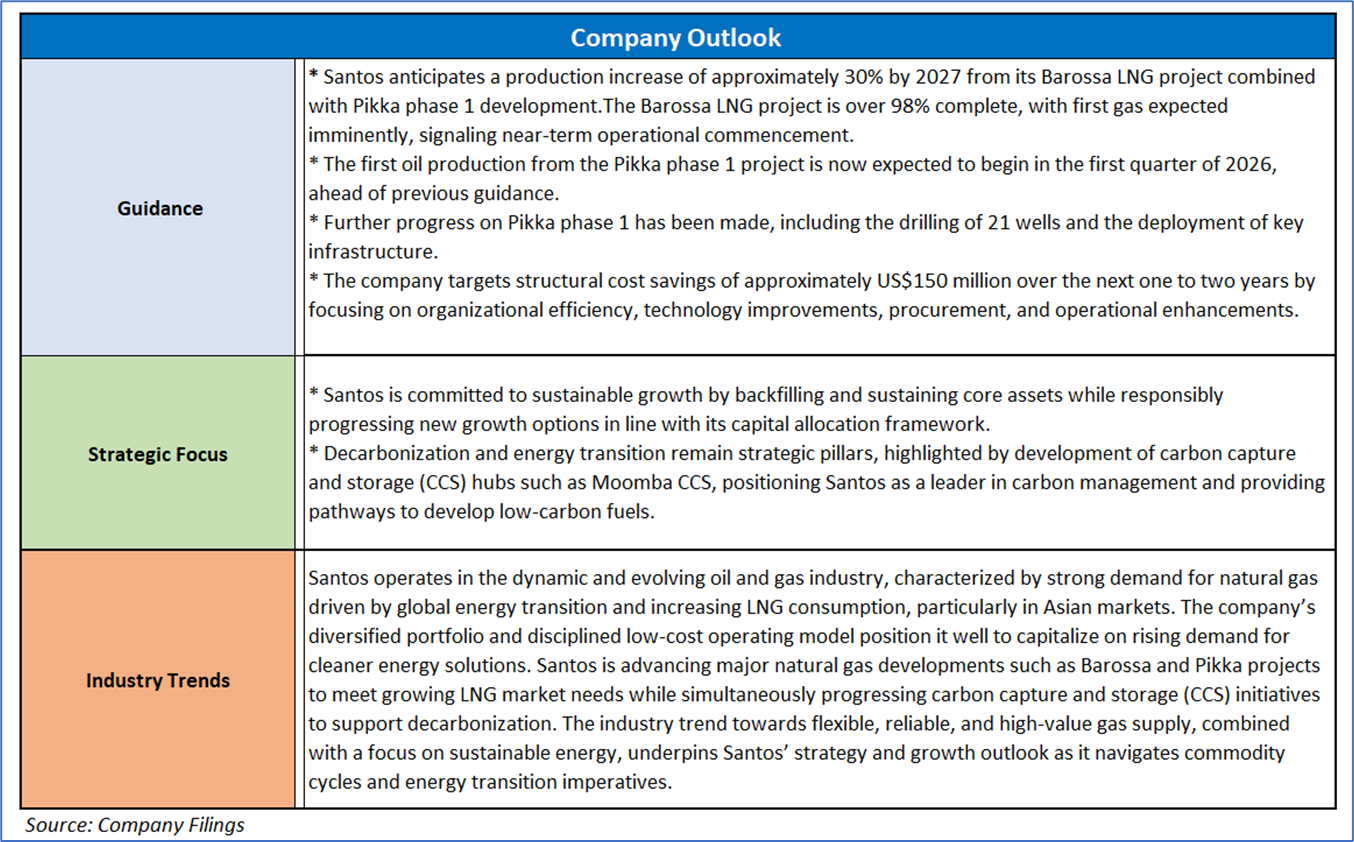
Section 3: Key Risks and Outlook:
Section 4: Stock Recommendation Summary
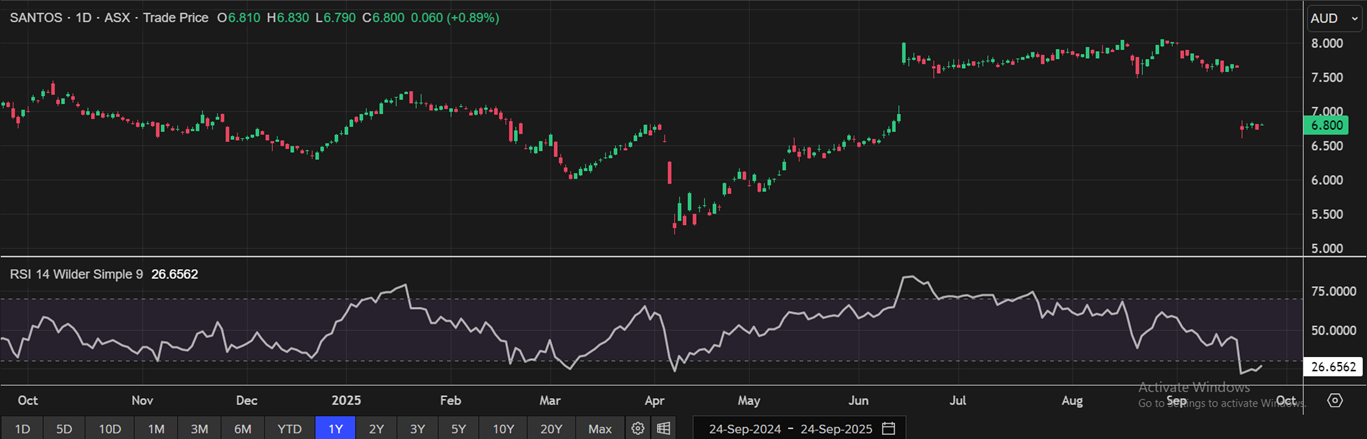
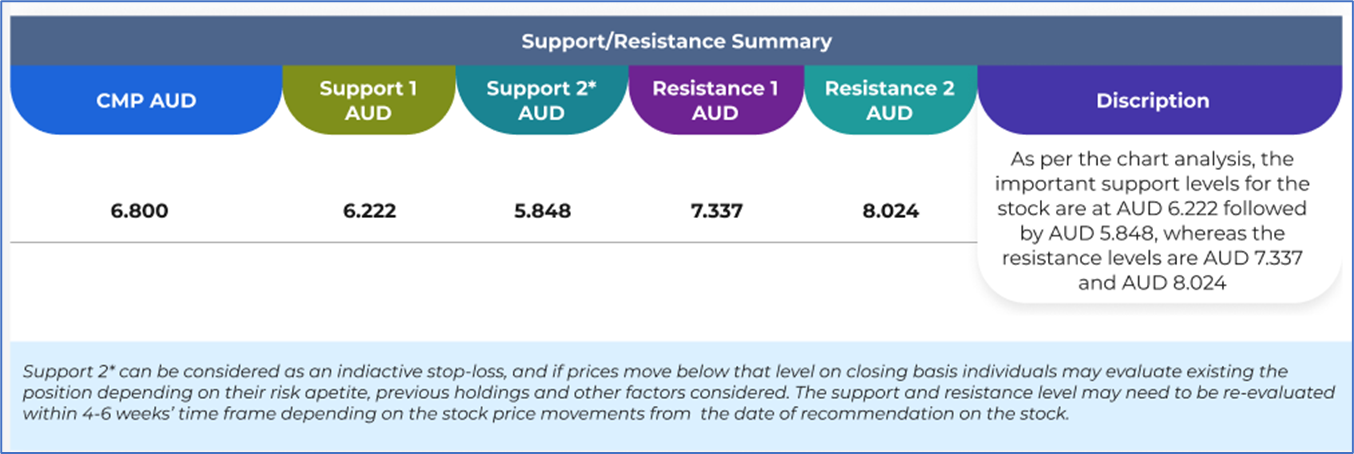
4.1 Price Performance and Technical Summary
The stock price has declined by approximately 12.93% over the past month; however, it has increased by around 5.26% over the last 6 months. The stock has a 52-week low and 52-week high of AUD 5.200 and AUD 8.060, respectively, and is currently trading around its 52-week mid-level. STO was previously covered in a report dated ‘26 May 2025’.
(Source: REFINITIV; Analysis by Kalkine Group)
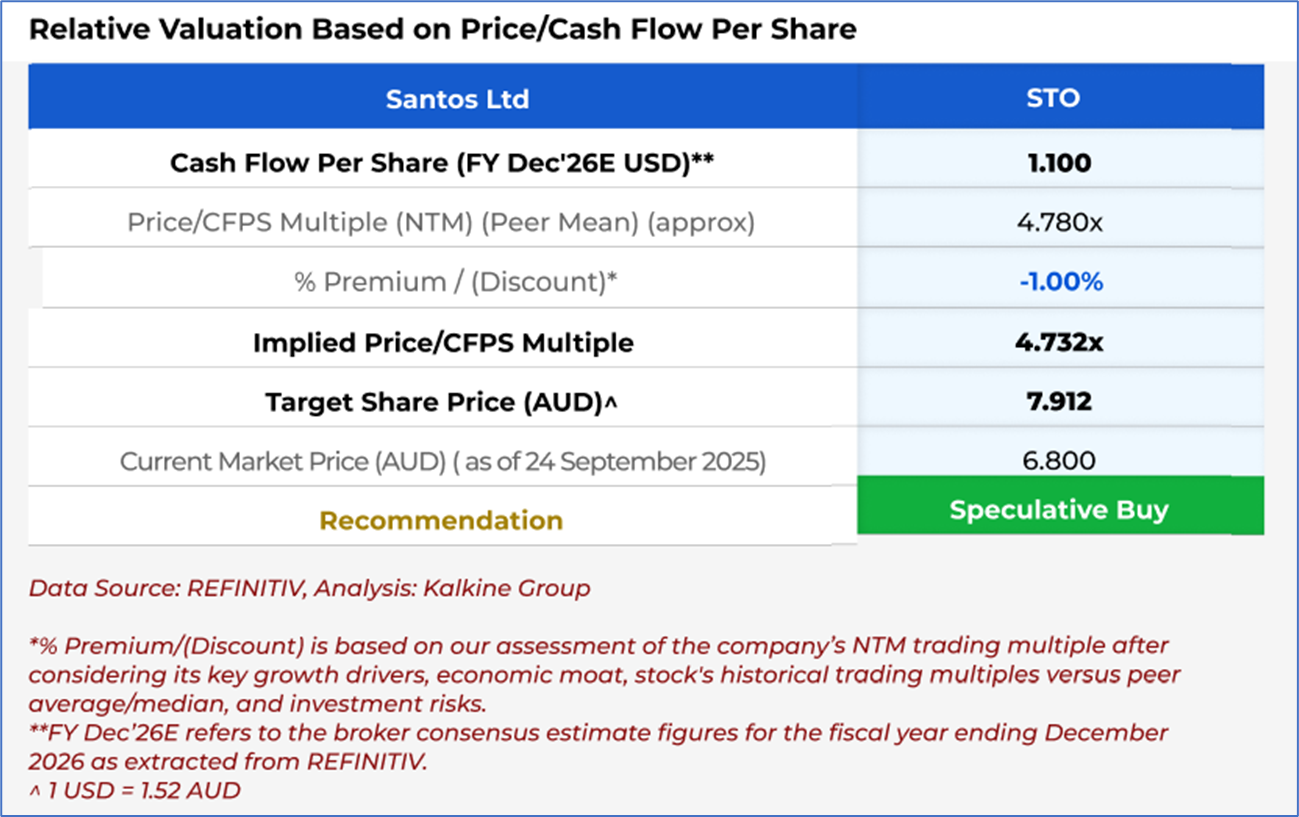
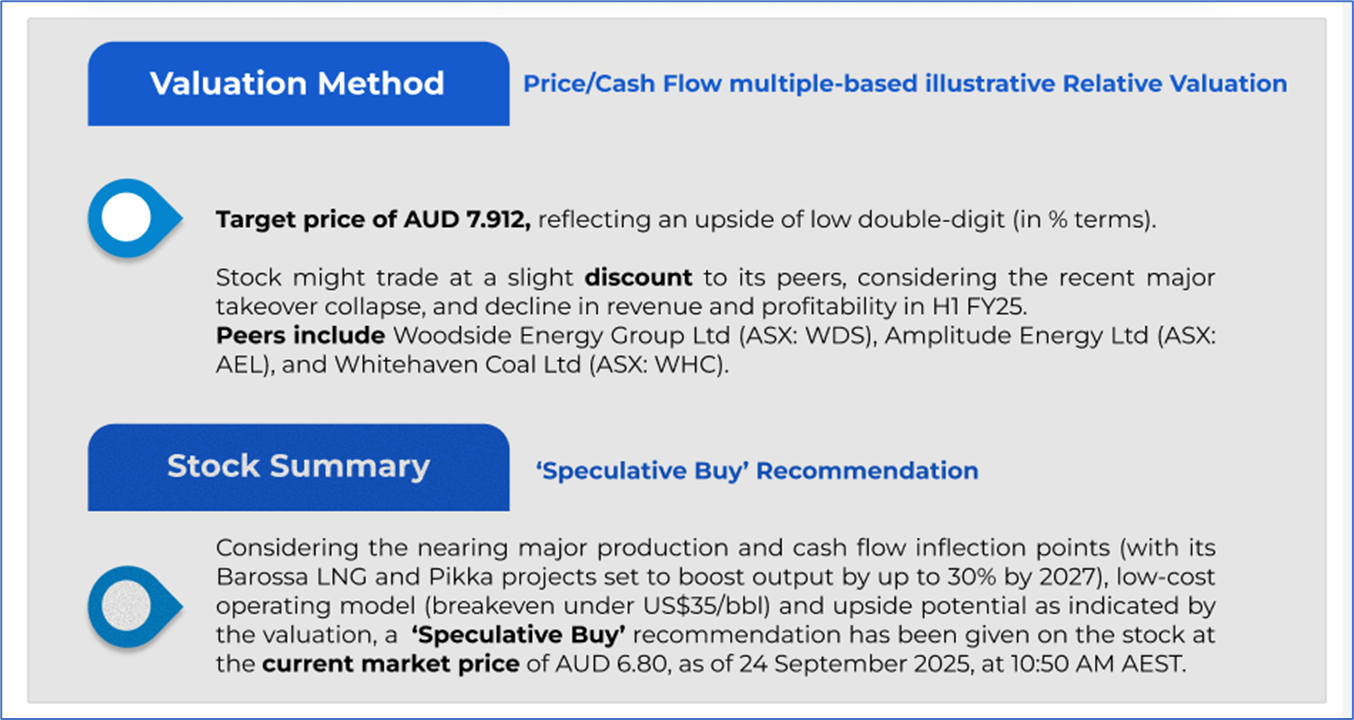
4.2 Fundamental Valuation
Valuation Methodology: Price/Cash Flow Multiple Based Relative Valuation (Illustrative)
Markets are trading in a highly volatile zone currently due to certain macro-economic issues and geopolitical tensions prevailing. Therefore, it is prudent to follow a cautious approach while investing.
Note 1: Past performance is neither an indicator nor a guarantee of future performance.
Note 2: The reference date for all price data, currency, technical indicators, support, and resistance levels is 24 September 2025. The reference data in this report has been partly sourced from REFINITIV.
Note 3: Investment decisions should be made depending on an individual's appetite for upside potential, risks, holding duration, and any previous holdings. An 'Exit' from the stock can be considered if the Target Price mentioned as per the Valuation and or the technical levels provided have been achieved and is subject to the factors discussed above.
Note 4: Kalkine reports are prepared based on the stock prices captured either from REFINITIV or Trading View. Typically, REFINITIV or Trading View may reflect stock prices with a delay which could be a lag of 25-30 minutes. There can be no assurance that future results or events will be consistent with the information provided in the report. The information is subject to change without any prior notice.
Note 5: Dividend Yield may vary as per the stock price movement.
Technical Indicators Defined: -
Support: A level at which the stock prices tend to find support if they are falling, and a downtrend may take a pause backed by demand or buying interest. Support 1 refers to the nearby support level for the stock and if the price breaches the level, then Support 2 may act as the crucial support level for the stock.
Resistance: A level at which the stock prices tend to find resistance when they are rising, and an uptrend may take a pause due to profit booking or selling interest. Resistance 1 refers to the nearby resistance level for the stock and if the price surpasses the level, then Resistance 2 may act as the crucial resistance level for the stock.
Stop-loss: It is a level to protect further losses in case of unfavourable movement in the stock prices.
Disclaimer This report has been issued by Kalkine New Zealand Limited (FSP691351) (NZBN:9429047678101) (“Kalkine”). Kalkine is a Financial Advice Provider (“FAP”) and is authorised by a Class 1 Financial Advice Provider Licence issued by Financial Markets Authority (“FMA”) to provide financial advice. Kalkine provides only general financial advice through its research reports following a person becoming a member. The reports contain buy/sell/hold and other recommendations in relation to equity securities, managed funds and other managed investment schemes and other financial advice products. The recommendations and opinions in this report and on Kalkine website do not take into account any of your investment objectives, financial situation or needs. Before you make a decision about whether to acquire a financial product, you should obtain the Product Disclosure Statement from the product issuer. You should consider the appropriateness of advice taking into account your own objectives, financial situation and needs and seek independent financial advice before making any financial decisions. If you act on the advice in the research reports, you may have to pay fees, expenses or other amounts (but not to Kalkine). Further information about the complaints and dispute resolution process, as well as information about Kalkine’s duties are available on Kalkine’s website. Please read our Financial Advice Provider (FAP) disclosure statement and Complaints Handling Guide, which are available on the website.
Past performance is not a reliable indicator of future performance.
 Please wait processing your request...