
Company Overview: Sanford Limited (NZX: SAN) has the vision to become the best seafood company in the world and it has 100+ years of seafood history. In 1881, it started as a family business in Auckland and had grown into the company which has more than 1,400 people. Sanford has a global presence, and its operations span from Stewart Island to Auckland, as well as Australia and China. The Sanford brand implies stability, history and sustainable seafood. It is in the midst of transition from essentially being a fishing company to a producer and marketer of premium high-quality seafood and high-value items. The company engages with various stakeholder groups with a shared interest in the sea. It also engages with the Minister for Primary Industries and other government agencies or officials.
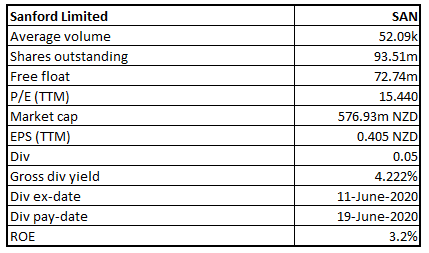
SAN Details
Investment Summary:
Seafood Demand Expected to Grow with Opening up of Restaurants & Bars: Sanford Limited (NZX: SAN) is a New Zealand’s largest and oldest seafood company with a diverse range of interests across fishing and aquaculture. The group’s key operating divisions are 1) Wildcatch - responsible for catching and processing inshore and deepwater fish species; and 2) Aquaculture - responsible for farming, harvesting and processing mussels and salmon.
Looking at the past performance over FY15 to FY19, top-line and bottom-line of the company witnessed a compounded annual growth rate (CAGR) of ~4.89% and ~31.85%, respectively. The company’s total revenue improved from $450.3 million in FY15 to $545.1 million in FY19, and its net income improved from $13.8 million in FY15 to $41.7 million in FY19.
The group, on being in essential business, continued to operate during the lockdown restrictions. SAN’s value add strategy to get closer to the customers helped it to focus on foodservice, particularly its high-end Big Glory Bay salmon. The group continued fishing, harvesting and processing with its supply returning to relatively satisfactory levels within two weeks, but demand remains uncertain and volatile.
The company’s first-half results were impacted in its fishing division by a shortfall in catch volumes for toothfish, caused in part by weather factors. Pricing for this species was also softer globally, following the impact of COVID-19. Coronavirus impacts were also felt in other areas of the business, particularly toward the end of the reporting period. The sale of Sanford’s Tauranga-based pelagics business (catching mackerels and tuna) at the end of March 2019 accounted for the sales volume difference to the prior year.
Despite the challenges, the company noted that normalised EBIT per greenweight kilogram improved throughout the aquaculture business with salmon at the Stewart Island farm showing particularly good growth with a 19% increase in biomass. There are expectations that the company would be supported by its robust balance sheet position.
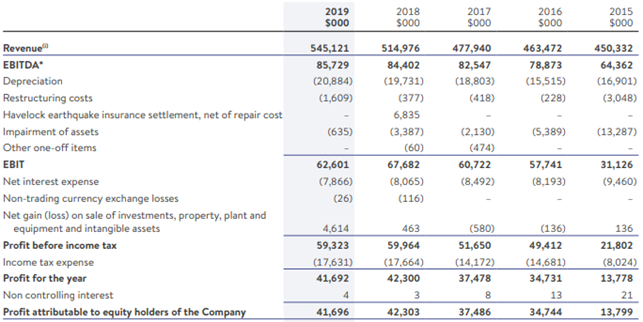
Historical Performance (Source: Company Reports)
Top 10 Shareholders: The top 10 shareholders have been highlighted in the table, which together forms around 36.94% of the total shareholding. Amalgamated Dairies Ltd and Harbour Asset Management Limited are holding maximum interests in the company at 12.00% and 6.81%, respectively.
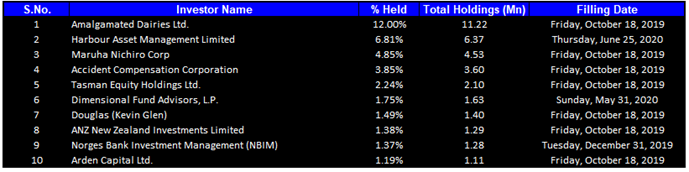
Top 10 Shareholders (Source: Refinitiv (Thomson Reuters))
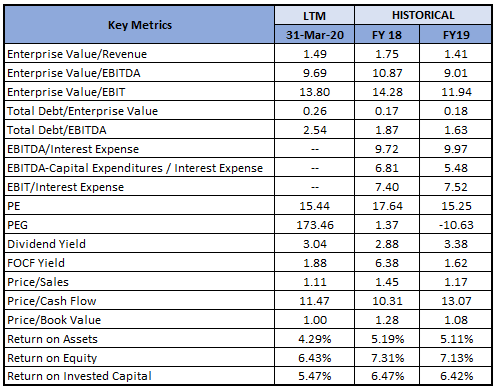
A Quick Look at Key Metrics: Its gross margin, EBITDA margin and net margin for H1FY20 stood at 19.4%, 17.1% and 7.7%, better than the H2FY19 result of 19.0%, 13.8% and 6.7%, implying improvement in the operating efficiency of the company.
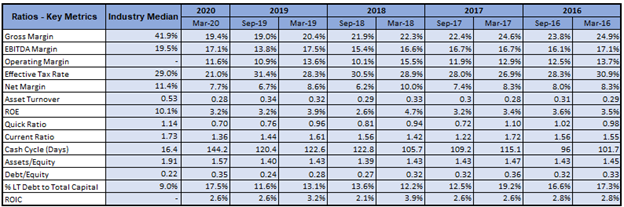
Key Metrics (Source: Refinitiv (Thomson Reuters))
Subdued Performance for H1FY20: The company recently published its interim result for FY20 (ended March 31, 2020), where it highlighted that its statutory net profit after tax (NPAT) for the period at $19.0 million was 17% lower than last year’s result of $22.9 million for the same period. Adjusted (underlying) Earnings Before Interest and Tax (EBIT) for the period stood at $23.2 million, representing a 29% decrease on adjusted EBIT from the same period last year ($32.6 million) or a 16% decrease on a comparable basis when excluding the pelagic business which Sanford sold in March 2019. Total revenue for the period was reported at $245.5 million, a 7% decrease on the same period last year. The result can be attributed to a shortfall in catch volumes for toothfish, caused in part by weather factors, plus pricing for this species was also softer globally, following the impact of COVID-19. In addition, the sale of Sanford’s pelagics business at the end of March 2019 also impacted the sales volume.
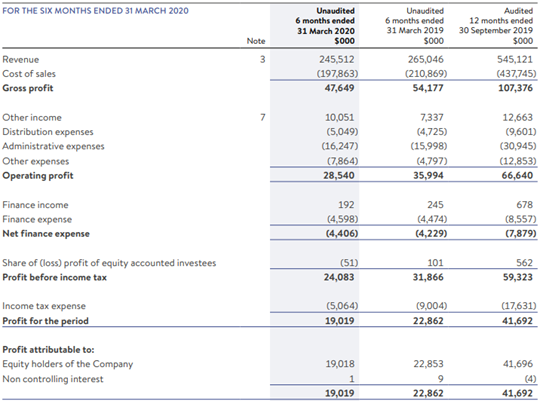
H1FY20 Income Statement (Source: Company Reports)
FY20 Outlook: The company comes under New Zealand’s primary industry sector and was classified as a provider of an essential service since New Zealand moved to an Alert Level 4.
The company’s robust balance sheet supports the deployment of funds to accelerate the process of its innovation strategy, specifically with the marine extracts as well as its asset rejuvenation strategy. The continued strong demand and channel diversification are keeping returns high. The company is planning to improve its margins by reducing and containing fixed costs and recover its investments in sales and marketing.
Key Risks: The company's business is exposed to the risk of climate change. The warmer waters and adverse weather conditions can impact the bottom line of the company. To mitigate the risk, the company is investing in innovation across the business and bringing customer focus to life at the same time.
Key Valuation Metrics (Source: Refinitiv (Thomson Reuters))
Valuation Methodology: Price to Earnings (P/E) Multiple Based Relative Valuation (Illustrative)
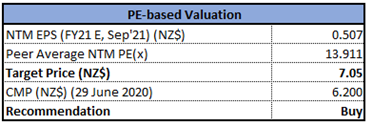
Price to Earnings (P/E) Multiple Based Relative Valuation (Source: Refinitiv (Thomson Reuters))
Note: All forecasted figures and peers have been taken from Thomson Reuters, NTM-Next Twelve Months
Technical Overview:
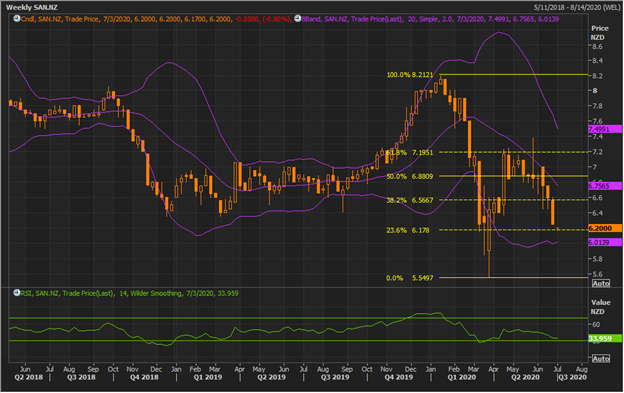
Weekly Chart –
Source: Refinitiv (Thomson Reuters)
Note: Purple colour lines are Bollinger Bands with upper band suggesting overbought status while lower band oversold status, and yellow lines are Fibonacci retracement lines which measure price rebound and backtrack.
The stock was in a losing streak till the prior week. On this date of June 29, 2020, of the on-going week, the stock has given gap-down opening but close on its peak-price thereby suggesting to be in the process of forming chart pattern of Morning Star which will get confirmed from forming of a bullish candle in the next week. A Morning Star is bullish reversal pattern in the bearish market. Technical indicator with around 34 reading and flattish curve at the end, suggests flattish momentum for the stock.
Going forward, the stock may have resistance around $6.76 as provided by 20 period SMA while support could be around $6.01 as provided by lower Bollinger band.
Note: Technical analysis as at 2:55 pm, June 29, 2020, Auckland, New Zealand.
Stock Recommendation: The company’s operations were recognized as a provider of an essential service, enabling it to continue operations. The Board has acknowledged the uncertainty and the impact on the business due to measures undertaken to contain Covid-19 spread, but demand for seafood is expected to remain strong in the coming times.
In recent years, the company has made a strategic shift into higher-value products such as Greenshell mussel powders and high-end branded salmon, demonstrating its presence in diverse businesses. In the first half performance, despite the challenges, the company noted that normalised EBIT per greenweight kilogram improved across its aquaculture business with salmon at the Stewart Island farm showing particularly good growth with a 19% increase in biomass. With the country entering alert level 1, it is expected that the life and economy will return to normalcy soon and business will be as usual.
Considering the aforesaid facts and recent updates, we have valued the stock using a relative valuation method, i.e., Price to Earnings (P/E) multiple (on an illustrative basis), and we have arrived at a target price of lower double-digit growth (in % terms).
Hence, we give a “Buy” recommendation on the stock at the current market price of NZ$6.200 per share, down by 0.80% (New Zealand time: 2:30 pm) on June 29, 2020.
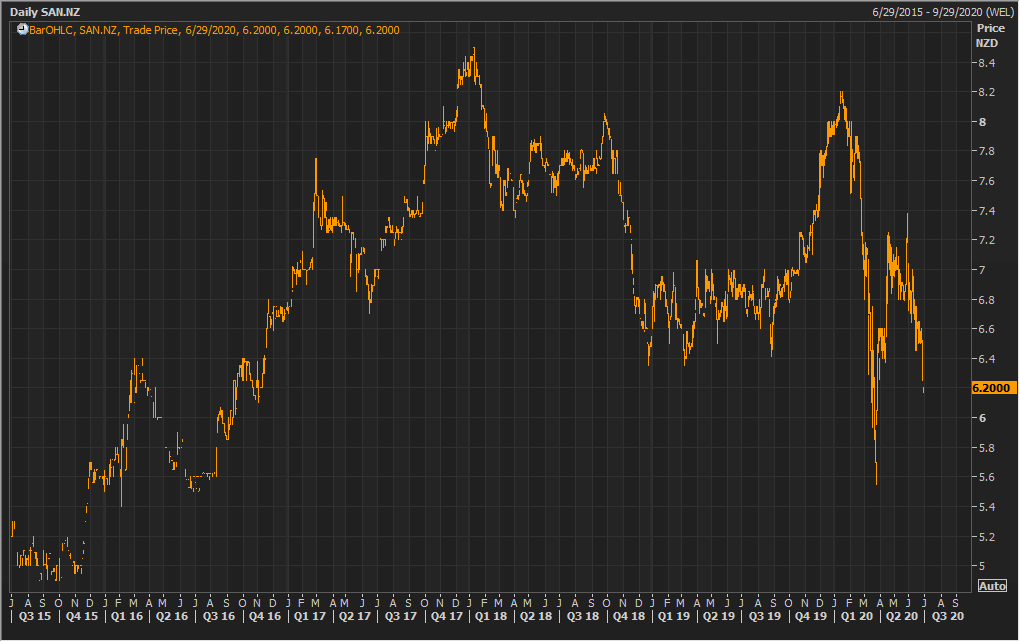
SAN Daily Technical Chart (Source: Refinitiv (Thomson Reuters))
Disclaimer
Kalkine New Zealand Limited is authorised to provide class advice only. The information on this site does not take into account any of your investment objectives, financial situation or needs. Before you make a decision about whether to acquire a financial product, you should obtain the Product Disclosure Statement from the product issuer. You should consider the appropriateness of advice taking into account your own objectives, financial situation and needs and seek independent financial advice before making any financial decisions.
Past performance is not a reliable indicator of future performance.
 Please wait processing your request...