
Company Overview: Sanford Limited (NZX: SAN) has a vision to become the best seafood company in the world and it has 100+ years of seafood history. In 1881, it started as a family business in Auckland and has grown into the company which has more than 1,400 people. Sanford has a global presence and its operations span from Stewart Island to Auckland, as well as Australia and China. The Sanford brand implies stability, history and sustainable seafood. The company engages with various stakeholder groups with shared interest in the sea. It also engages with the Minister for Primary Industries and other government agencies or officials.
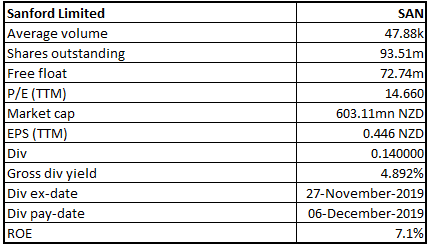
SAN Details
Investment Summary:
Higher Returns from Lower Sales Volumes: Sanford Ltd (NZX: SAN) is New Zealand’s largest and oldest seafood company that is listed on the New Zealand stock market since 1924. The company has a market capitalisation of around $603.11 million on 6th April 2020. For the year ended 30th September 2019, sales revenue stood at $558 million on a like-for-like basis, up 8% from $515 million in the prior year, despite sales volume decreasing by 5% to 115,000 tonnes. The company reported net profit after tax of $41.7 million, compared to $42.3 million in FY18. Underlying adjusted EBIT stood at $64.8 million compared to $64.7 million in FY18. Gross margin (on a like for like basis) improved by $6.3 million with favourable sales pricing, product mix and sales channel optimisation more than offsetting cost pressures such as higher labour and fuel costs. The company’s salmon segment registered a very good result, due to stronger volumes and value realisation. This was partly driven through its Big Glory Bay brand which is now on offer on menus in high-end restaurants in New Zealand and the US. The company has been granted a consent variation for its Stewart Island salmon farm which will allow it to farm up to 30% more fish over the next three years.
Amidst COVID-19 worries, the company is focusing towards retaining its ability to feed NZ and the world while, at the same time, keep the people safe and secure. The company mentioned that the seafood is in demand and the business fundamentals are robust. SAN’s priorities for FY 2020 include 1) Scenario planning in order to dodge the impact, 2) Embed new ways of working as well as mitigate the risk of complacency, 3) Development of alternative product formats along with sales channels, and 4) Conducting the strategic review with regards to the future landscape.
With regards to financial position, the company is possessing robust balance sheet which could help the company moving forward. SAN also has sufficient headroom in borrowing facilities which could help it to withstand shocks. It is important to note that the company’s diversification of the sales channels, markets, products as well as geographical location throughout NZ gives it a natural hedge against the significant downside.
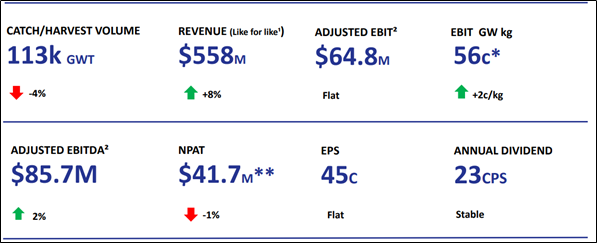
FY19 Result Summary (Source: Company Reports)
Top 10 Shareholders: The top 10 shareholders have been highlighted in the table, which together forms around 37.93% of the total shareholding. Amalgamated Dairies Ltd and Harbour Asset Management Limited are holding maximum interests in the company at 12.00% and 7.83% respectively, as provided in the table below.
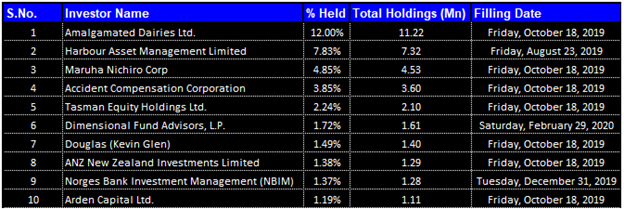
Top 10 Shareholders (Source: Thomson Reuters)
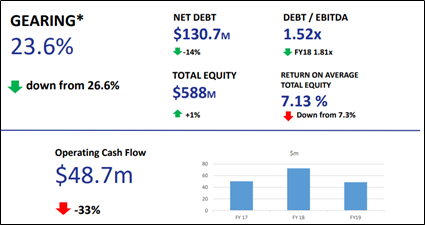
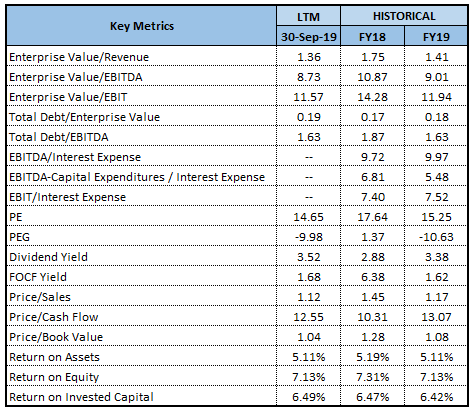
Brief Overview of Key Metrics: In FY19, the company’s Debt/Equity ratio stood at 0.24x, which is below the industry median of 0.28x. It also an improved number from 0.27x in FY18. Generally, lower debt on the balance sheet can help the company in focusing towards their growth objectives. It can be said that the reduction in debt also resulted in improvement in debt to EBITDA ratio of the company. In FY18, the company’s Debt/EBITDA stood at 1.81x, which reduced to 1.52x in FY19.
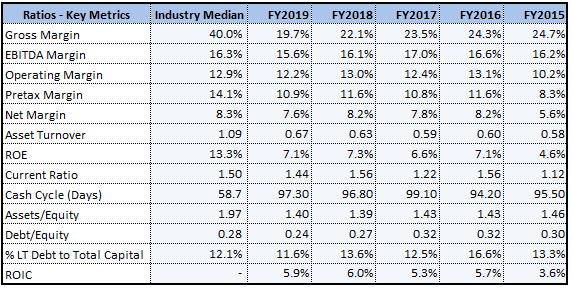
Key Metrics (Source: Thomson Reuters)
Strong Financial Position: The company’s balance sheet has strengthened with year-end debt down by $16 million to $139 million. In FY19, the company reported operating cash flow of $48.7 million, down from $72.4 million last year due to the timing of tax payments. The company reduced its borrowings from $155 million in FY18 to $139 million in FY19. The company secured net proceeds of $24.3 million from the sale of the pelagic business and $9 million for the sale of investment in the China-based processing plant, which caused the reduction in borrowings. This positively impacted the gearing ratio, improving it from 27% to 24%.
Financial Position (Source: Company Reports)
Investment into Innovative Marine Extracts Centre: The company announced its intention to create a $20 million Marine Extracts Centre in Blenheim, which will focus on the production and discovery of high-value nutrition products from New Zealand seafood. The company is already producing a high- quality Greenshell mussel powder from a small facility which is in Blenheim, and the success of this product has persuaded the company to go several steps further.
Key Risks in the Industry: The number one risk the business is facing is climate change. The warmer waters and adverse weather conditions can impact on the bottom line of the company. To mitigate the risk, the company is investing in innovation across the business and bringing customer focus to life at the same time.
Industry Outlook Amid COVID-19 Pandemic: As per the Fisheries Minister, Stuart Nash, the aquaculture earnings continue to grow and are expected to increase by more than 10 per cent in the current financial year. The Government of New Zealand is closely examining the condition the sector is facing and working with industry leaders to make sure New Zealand’s high-quality products continue to get to market despite the global trade issues created by COVID-19.
Aquaculture earnings continue to grow and are expected to increase 10.2 per cent to $500 million in the year ending June 2020, with the largest markets being the USA, China, Europe and Australia. Salmon and mussel exports are growing in both volume and price, with revenue in each species led by frozen half-shell mussels and gilled and gutted salmon.
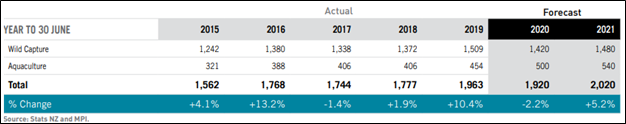
Seafood export revenue 2015-21 (Source: SOPI)
FY20 Outlook: The company comes under New Zealand’s primary industry sector and has been classified as a provider of an essential service and is continuing to operate, as New Zealand moves to an Alert Level 4.
The company’s robust balance sheet supports deployments of funds next year to accelerate the progress with its innovation strategy, specifically with the marine extracts as well as its asset rejuvenation strategy. The continued strong demand and channel diversification are keeping returns high. The company is planning to improve its margins by reducing and containing fixed costs and recover its investments in sales and marketing.
Valuation Methodology:
Price to Cash Flow Based Valuation
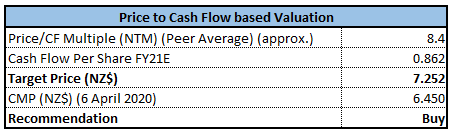
Price to Cash Flow Based Valuation (Source: Thomson Reuters)
Note: All forecasted figures and peers have been taken from Thomson Reuters, NTM: Next Twelve Months.
Technical Overview:
Weekly Chart –
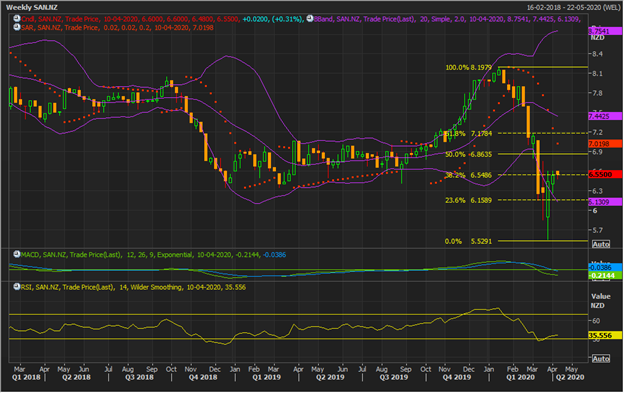
Source: Thomson Reuters
Note: Purple colour lines are Bollinger Bands, yellow lines are retracement lines and orange colour dotted line is Parabolic SAR.
From past two weeks, the stock has been showing resilience in its price following big sell-off it experienced from the level of its recent high of $8.20, made in January 2020. The stock made the low of $5.53 in the last week of March and bounced back from there moving beyond 38.2% retracement level of $6.55 and closing around $6.51, forming big bullish candle on chart. In the just concluded week, the stock maintained its resilience and gave closing above the previous week closing around 38.2% retracement level. In today’s session, the stock opened high at $6.60, made the low of $6.48 and finally, gave close at $6.55, at same level of just concluded week close.
Advanced technical indicator i.e., RSI is confirming to pick up in bullish momentum while lagging indicator i.e., MACD is suggesting weaker momentum.
All-in-all, the stock is likely to maintain uptrend in near future and is likely to move up to $7.2 which happens to be 61.8% retracement level of recent-past high and low where it will meet with resistance. On the downside, 23.6% retracement level of $6.15 is likely to provide support to the stock.
Stock Recommendation: The company’s bottom line has witnessed a CAGR of 31.85% between FY 2015- FY 2019 and, during the same time frame, its top line has witnessed a CAGR of 5.54%. Since its top line has witnessed a decent growth, it can be said that SAN is possessing capabilities to garner revenues which could help it in further strengthening its financial footing.
As mentioned above, the company has substantially reduced its net debt by 14%, which might attract the attention of the market participants. Currently, the stock is trading towards the 52-week lower levels and, therefore, it can be said that the current trading juncture is offering decent opportunities for accumulation.
On the valuation front, we have valued the stock using Price to Cash Flow based relative valuation method and have arrived at a target price which reflects the growth of lower double-digit (in % terms). The company has been mitigating the risk with the help of geographic spread, diversity and innovation.
Considering the upside from valuation, outlook and decent CAGR in net income, we give a “Buy” rating on the stock at the market price of $6.450 per share on 6th April 2020 (prior to market close).
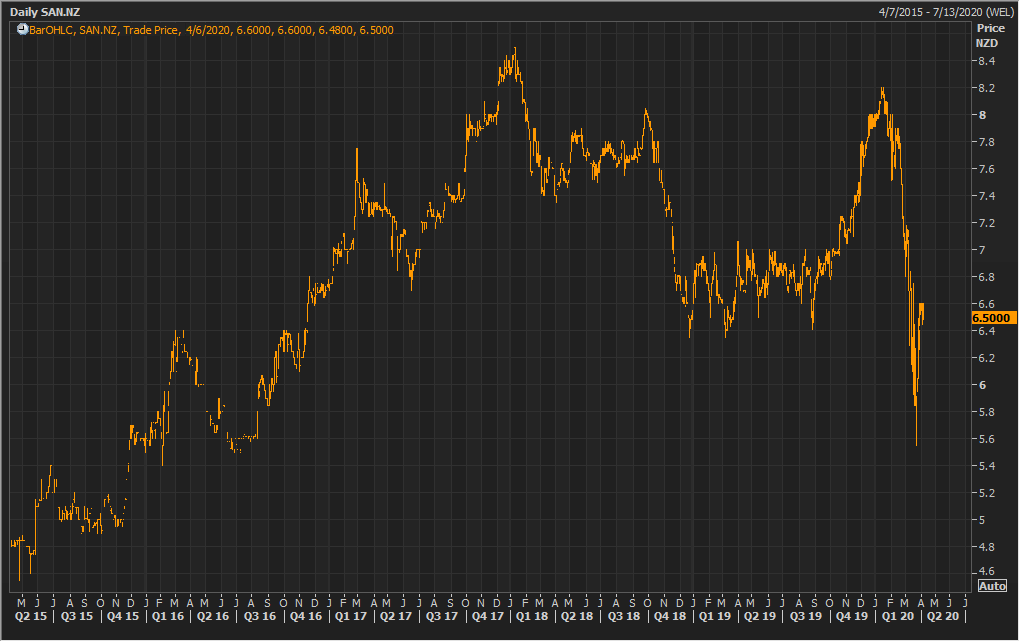
SAN Daily Technical Chart (Source: Thomson Reuters)
Disclaimer
Kalkine New Zealand Limited is authorised to provide class advice only. The information on this site does not take into account any of your investment objectives, financial situation or needs. Before you make a decision about whether to acquire a financial product, you should obtain the Product Disclosure Statement from the product issuer. You should consider the appropriateness of advice taking into account your own objectives, financial situation and needs and seek independent financial advice before making any financial decisions.
Past performance is not a reliable indicator of future performance.
 Please wait processing your request...