Section 1: Company Overview and Fundamentals
1.1 Company Overview:
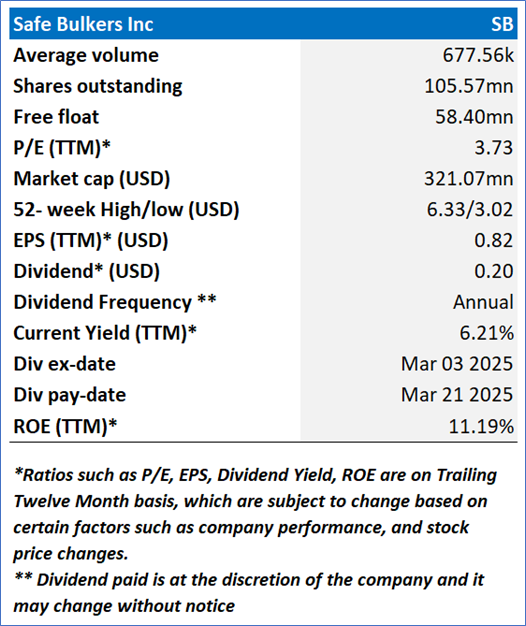
Safe Bulkers, Inc. (NYSE: SB) is a holding company. The Company's principal business is the acquisition, ownership and operation of drybulk vessels. The Company's vessels operate across the world, carrying drybulk cargo for the consumers of marine drybulk transportation services. The Company is an international provider of marine drybulk transportation services, transporting bulk cargoes, particularly coal, grain and iron ore, along shipping routes across the world.
Kalkine’s Dividend Income Report covers the Company Overview, Key positives & negatives, Investment summary, Key investment metrics, Top 10 shareholding, Business updates and insights into company recent financial results, Key Risks & Outlook, Price performance and technical summary, Target Price, and Recommendation on the stock.
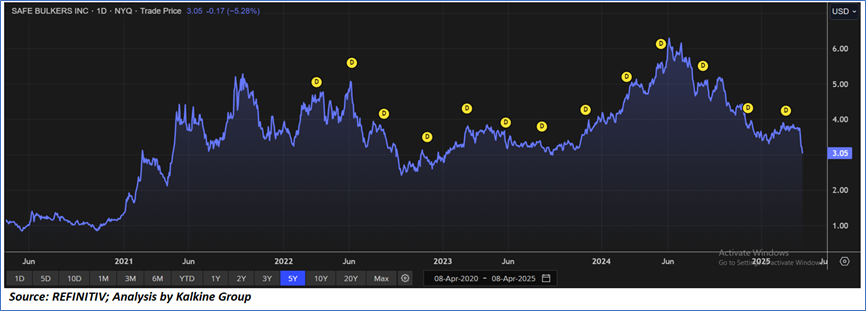
Price Performance:
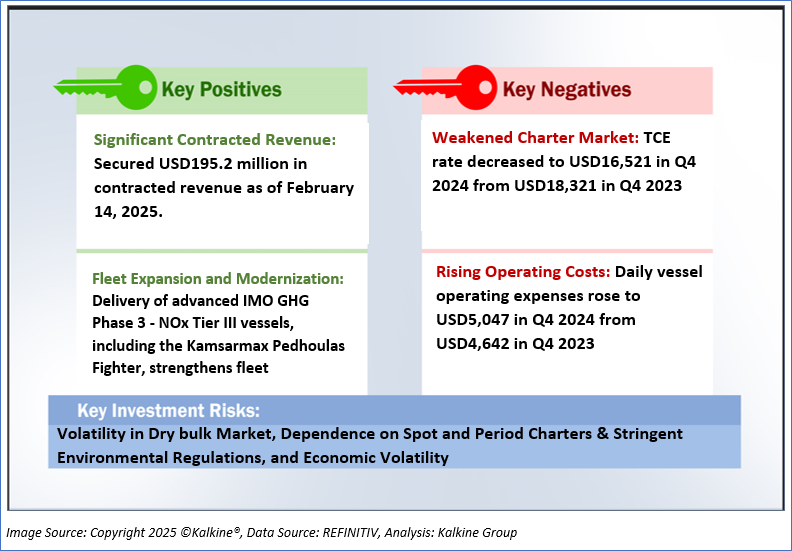
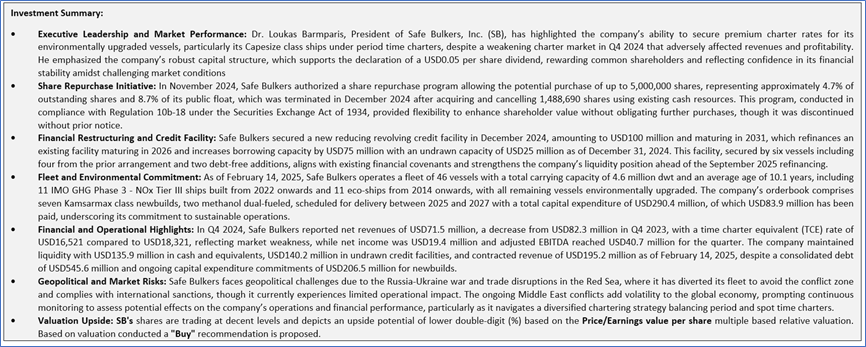
1.2 The Key Positives, Negatives, and Investment summary
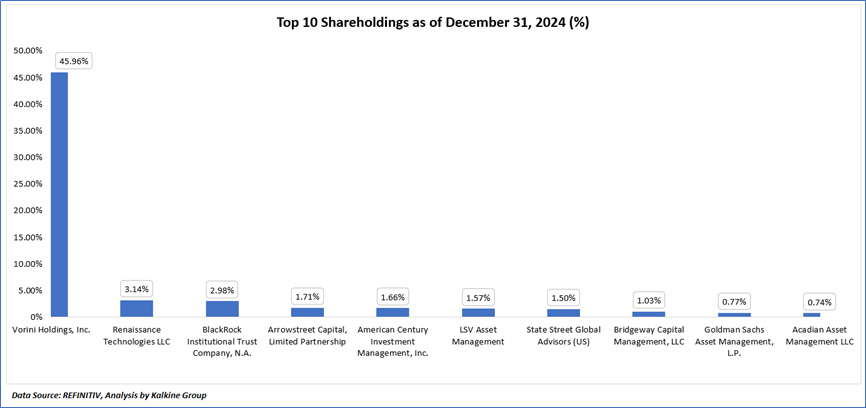
1.3 Top 10 shareholders:
The top 10 shareholders together form ~61.06% of the total shareholding, signifying concentrated shareholding. Vorini Holdings, Inc. and Renaissance Technologies LLC, are the biggest shareholders, holding the maximum stake in the company at ~45.96% and ~3.14%, respectively.
1.4 Dividend payments with impressive dividend yield:
Safe Bulkers, Inc. (SB) has implemented a structured dividend policy, as demonstrated by the Board of Directors’ declaration on February 18, 2025, of a USD0.05 per share cash dividend on its common stock, payable on March 21, 2025, to shareholders of record as of March 3, 2025, based on 105,299,771 outstanding shares as of February 14, 2025, following a similar USD0.05 per share dividend paid on December 17, 2024, to shareholders of record on December 2, 2024. Additionally, the company has consistently supported its Series C and Series D Cumulative Redeemable Perpetual Preferred Shares (NYSE: SB.PR.C and SB.PR.D) with quarterly dividends of USD0.50 per share, with payments executed on January 30, 2025, for the period from October 30, 2024, to January 29, 2025, to shareholders of record as of January 17, 2025, and on October 30, 2024, for the period from July 30, 2024, to October 29, 2024, to shareholders of record as of October 18, 2024, reflecting a current yield of 6.56%. The dividend policy remains discretionary, with future declarations contingent upon the Board’s assessment of factors including the company’s earnings, fleet employment status, financial health, liquidity needs, strategic growth and fleet renewal plans, compliance with Marshall Islands and Liberian legal frameworks, restrictive covenants in debt agreements, and prevailing global economic conditions, with no assurance of continued distributions.
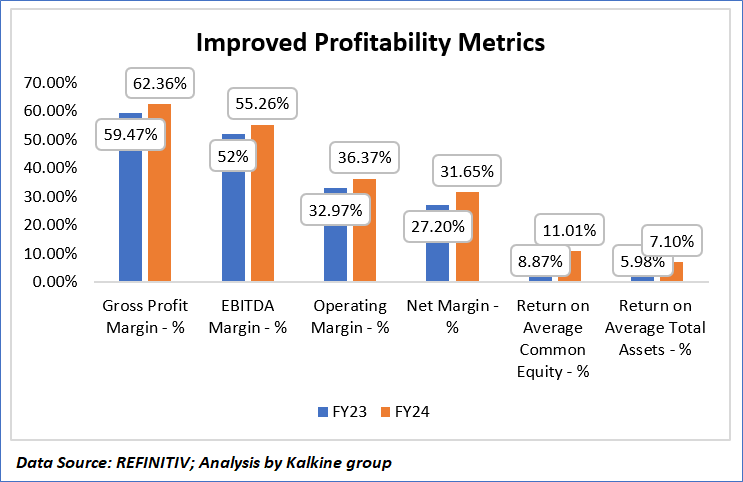
1.5 Key Metrics
Safe Bulkers, Inc. (SB) exhibited a commendable enhancement in its financial profitability metrics from fiscal year 2023 to fiscal year 2024, with the gross profit margin improving from 59.47% to 62.36%, reflecting greater efficiency in revenue generation relative to cost of services, likely attributable to optimized operations and premium charter rates for its upgraded fleet. The EBITDA margin rose from 52% to 55.26%, and the operating margin increased from 32.97% to 36.37%, indicating improved operational leverage and cost management, bolstered by strategic fleet utilization and a shift toward higher-margin period time charters. Furthermore, the net margin advanced from 27.20% to 31.65%, underscoring enhanced profitability after accounting for all expenses, driven by a favorable market position and disciplined financial oversight. The return on average common equity improved from 8.87% to 11.01%, and the return on average total assets rose from 5.98% to 7.10%, signaling a more effective deployment of equity and asset bases to generate earnings, reinforcing the company’s strengthened financial health and operational resilience in 2024.
Section 2: Business Updates and Financial Highlights
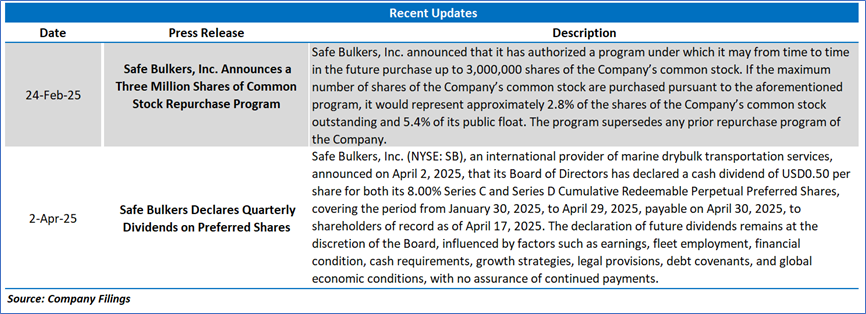
2.1 Recent Updates:
The below picture gives an overview of the recent updates:
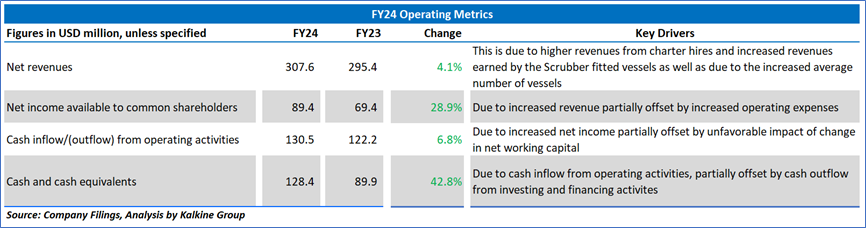
2.2 Insights of FY24:
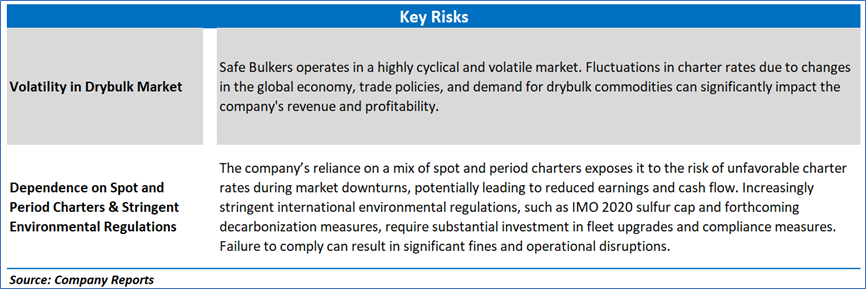
Section 3: Key Risks and Outlook:
Section 4: Stock Recommendation Summary:
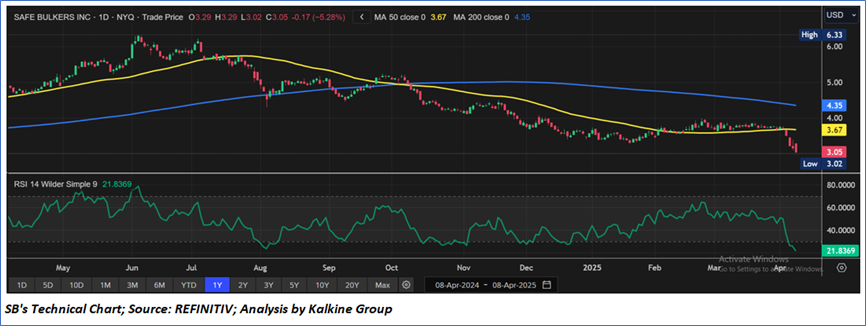
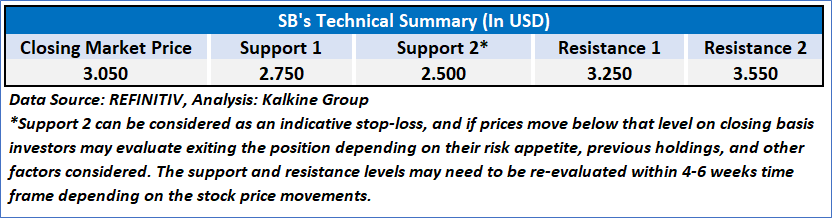
4.1 Technical Summary:
Price Performance:
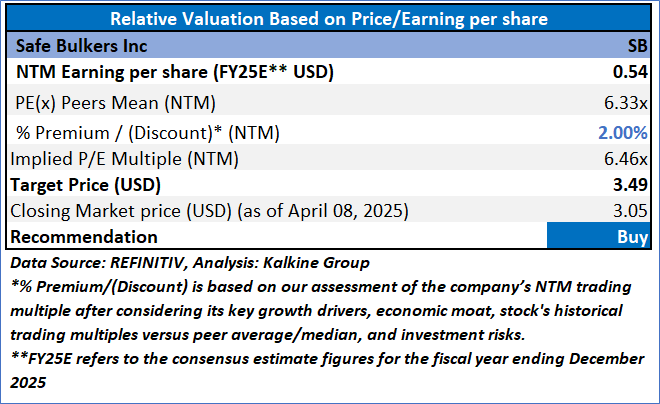
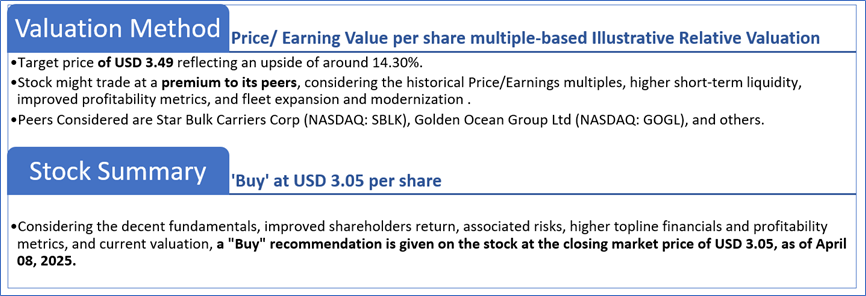
4.2 Fundamental Valuation
Valuation Methodology: Price/Earnings Per Share Multiple Based Relative Valuation
Markets are trading in a highly volatile zone currently due to certain macroeconomic issues and geopolitical tensions prevailing. Therefore, it is prudent to follow a cautious approach while investing.
Note 1: Past performance is not a reliable indicator of future performance.
Note 2: The reference date for all price data, currency, technical indicators, support, and resistance levels is April 08, 2025. The reference data in this report has been partly sourced from REFINITIV.
Note 3: Investment decisions should be made depending on an individual's appetite for upside potential, risks, holding duration, and any previous holdings. An 'Exit' from the stock can be considered if the Target Price mentioned as per the Valuation and or the technical levels provided has been achieved and is subject to the factors discussed above.
Note 4: The report publishing date is as per the Pacific Time Zone.
Technical Indicators Defined: -
Support: A level at which the stock prices tend to find support if they are falling, and a downtrend may take a pause backed by demand or buying interest. Support 1 refers to the nearby support level for the stock and if the price breaches the level, then Support 2 may act as the crucial support level for the stock.
Resistance: A level at which the stock prices tend to find resistance when they are rising, and an uptrend may take a pause due to profit booking or selling interest. Resistance 1 refers to the nearby resistance level for the stock and if the price surpasses the level, then Resistance 2 may act as the crucial resistance level for the stock.
Stop-loss: It is a level to protect against further losses in case of unfavorable movement in the stock prices.
Disclaimer This report has been issued by Kalkine New Zealand Limited (FSP691351) (NZBN:9429047678101) (“Kalkine”). Kalkine is a Financial Advice Provider (“FAP”) and is authorised by a Class 1 Financial Advice Provider Licence issued by Financial Markets Authority (“FMA”) to provide financial advice. Kalkine provides only general financial advice through its research reports following a person becoming a member. The reports contain buy/sell/hold and other recommendations in relation to equity securities, managed funds and other managed investment schemes and other financial advice products. The recommendations and opinions in this report and on Kalkine website do not take into account any of your investment objectives, financial situation or needs. Before you make a decision about whether to acquire a financial product, you should obtain the Product Disclosure Statement from the product issuer. You should consider the appropriateness of advice taking into account your own objectives, financial situation and needs and seek independent financial advice before making any financial decisions. If you act on the advice in the research reports, you may have to pay fees, expenses or other amounts (but not to Kalkine). Further information about the complaints and dispute resolution process, as well as information about Kalkine’s duties are available on Kalkine’s website. Please read our Financial Advice Provider (FAP) disclosure statement and Complaints Handling Guide, which are available on the website.
Past performance is not a reliable indicator of future performance.
 Please wait processing your request...