Section 1: Company Overview and Fundamentals
1.1 Company Overview:
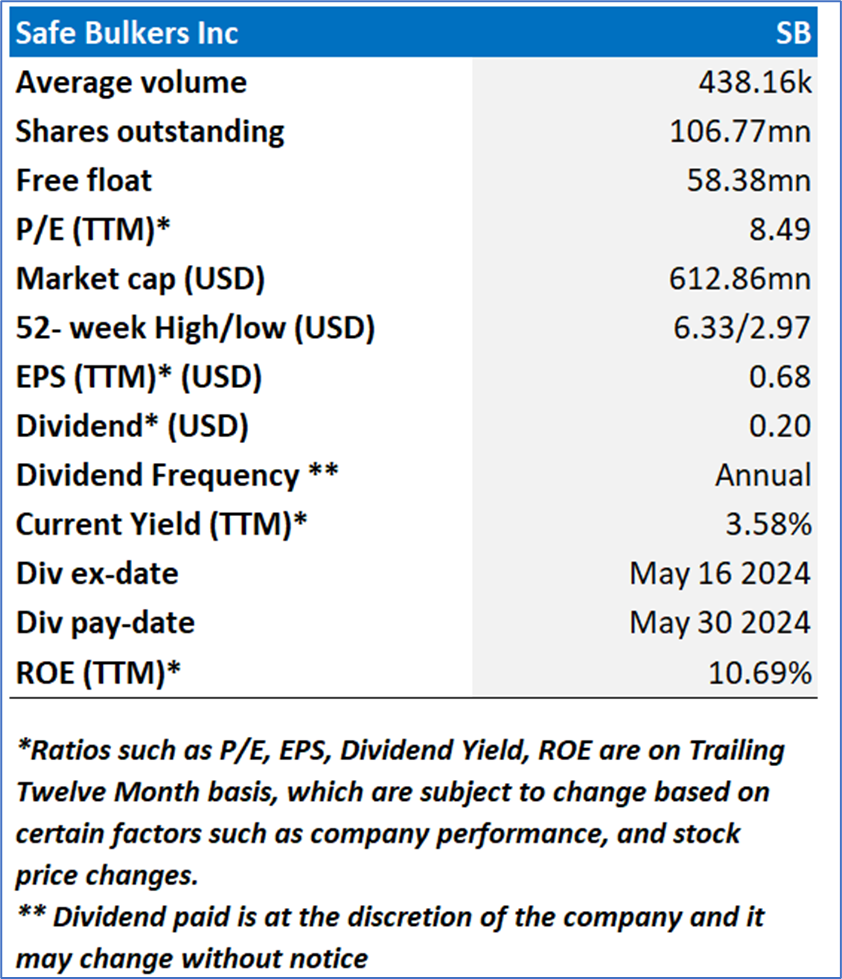
Safe Bulkers, Inc. (NYSE: SB) is a holding company. The Company's principal business is the acquisition, ownership and operation of drybulk vessels. The Company's vessels operate across the world, carrying drybulk cargo for the consumers of marine drybulk transportation services. The Company is an international provider of marine drybulk transportation services, transporting bulk cargoes, particularly coal, grain and iron ore, along shipping routes across the world.
Kalkine’s Dividend Income Report covers the Company Overview, Key positives & negatives, Investment summary, Key investment metrics, Top 10 shareholding, Business updates and insights into company recent financial results, Key Risks & Outlook, Price performance and technical summary, Target Price, and Recommendation on the stock.
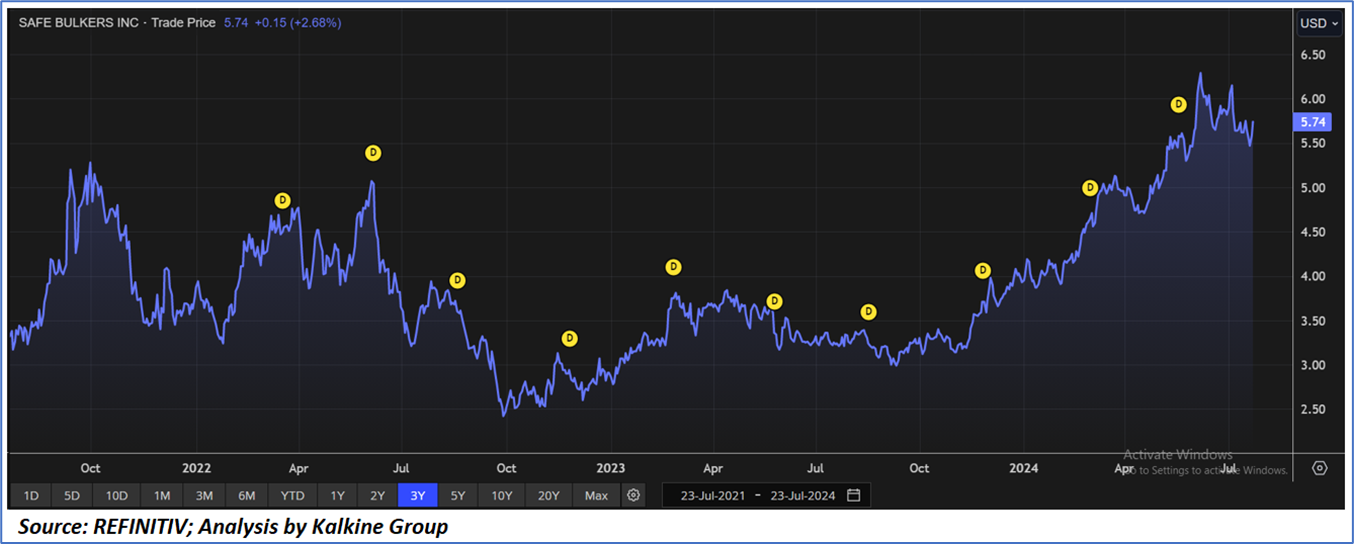
Price Performance:
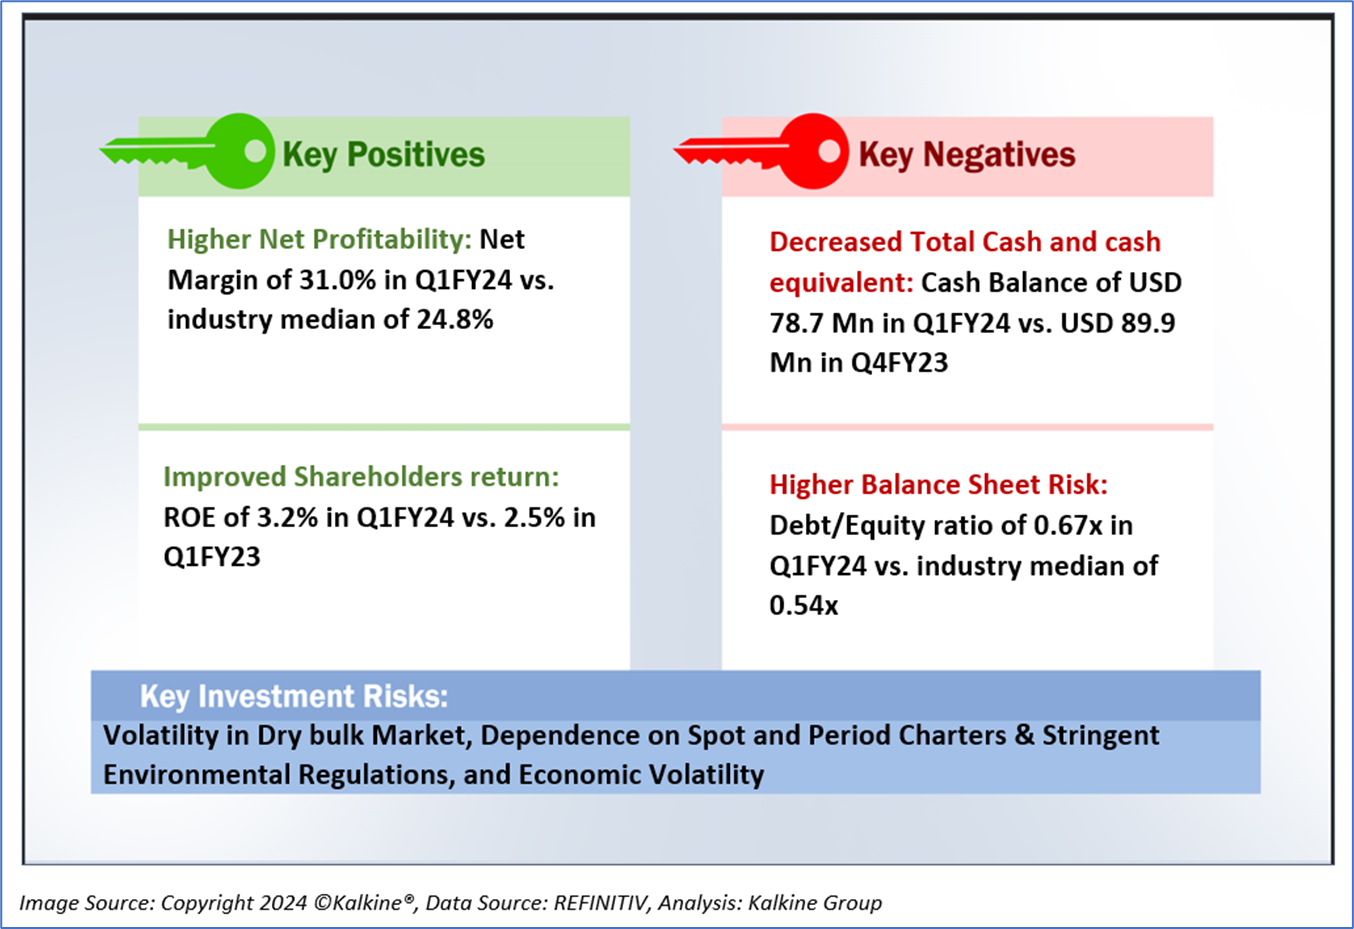
1.2 The Key Positives, Negatives, and Investment summary
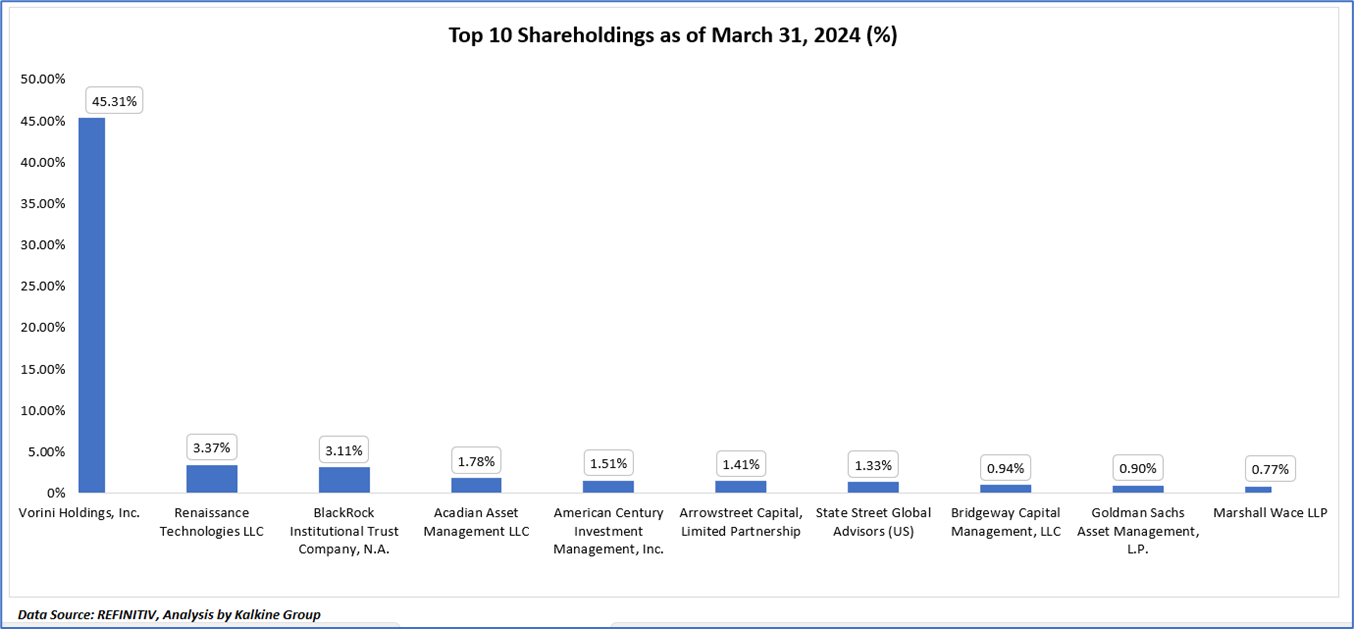
1.3 Top 10 shareholders:
The top 10 shareholders together form ~60.42% of the total shareholding, signifying concentrated shareholding. Vorini Holdings, Inc. and Renaissance Technologies LLC, are the biggest shareholders, holding the maximum stake in the company at ~45.31% and ~3.37%, respectively.
1.4 Dividend payments with impressive dividend yield:
Safe Bulkers Inc. has a history of paying dividends on both its common stock and Series C & D preferred shares. The company recently declared a USD 0.05 per share dividend on common stock, payable on May 30, 2024, to shareholders of record on May 17, 2024. They also pay quarterly dividends on their Series C and D preferred shares. The dividend amount and payment dates are determined by the Board of Directors but are typically paid quarterly in arrears. This consistent dividend payment underscores Safe Bulkers Inc.'s commitment to delivering steady returns to its preferred shareholders. The regularity and stability of these dividends reflect the Company’s solid financial management and ongoing commitment to shareholder value.
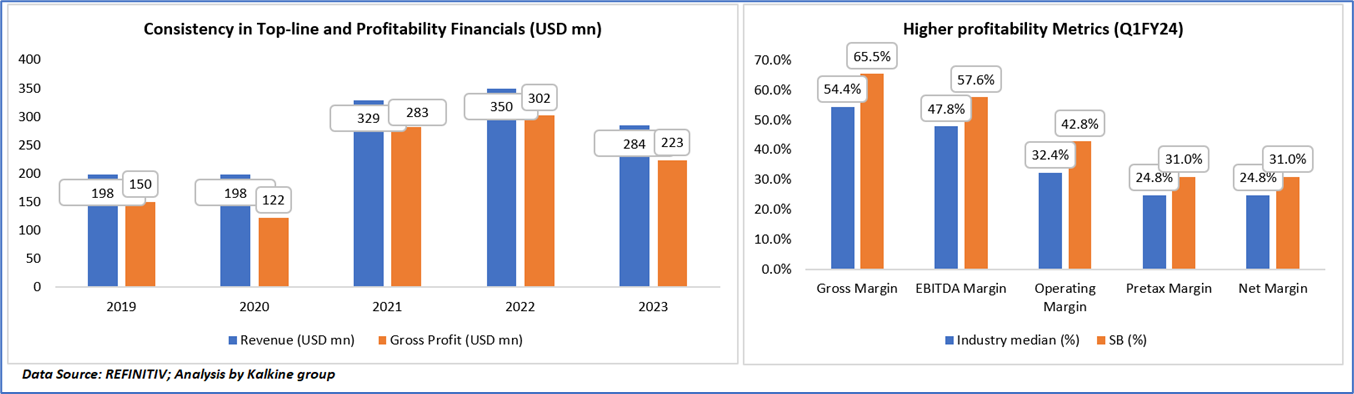
1.5 Key Metrics
From 2019 to 2023, the company demonstrated notable financial strength, with revenue increasing from USD 198 million to USD 350 million before adjusting to USD 284 million. Gross profit similarly rose from USD 150 million to USD 302 million, though it declined to USD 223 million in 2023. Compared to the industry median for Q1FY24, the company excelled with a gross margin of 65.5%, an EBITDA margin of 57.6%, an operating margin of 42.8%, and both pretax and net margins of 31.0%. These metrics underscore the company's exceptional operational efficiency and profitability, highlighting its robust financial health and strategic effectiveness amidst revenue fluctuations.
Section 2: Business Updates and Financial Highlights
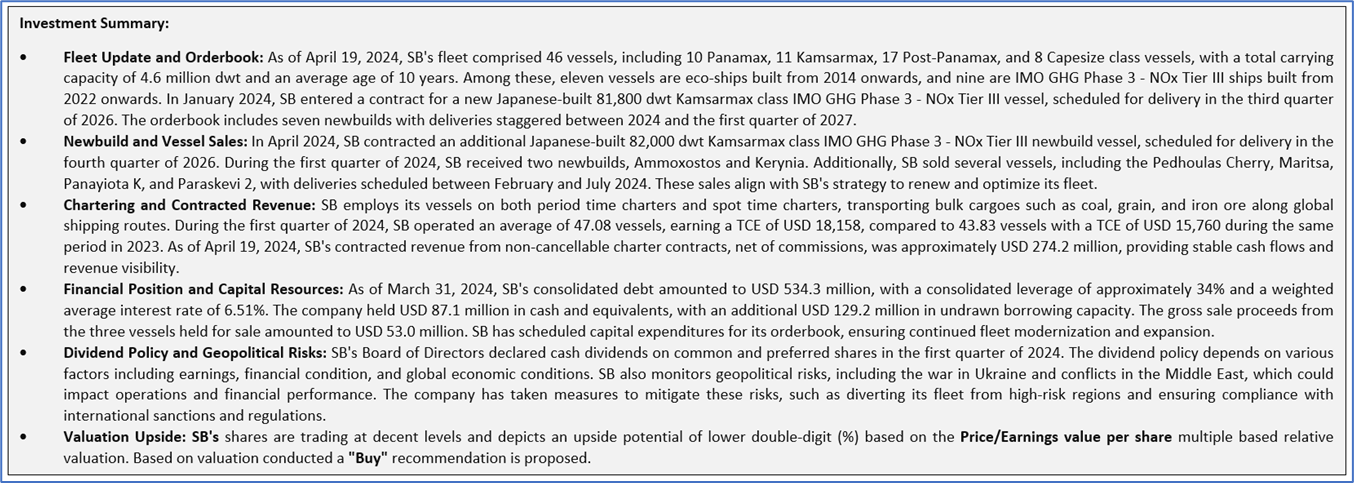
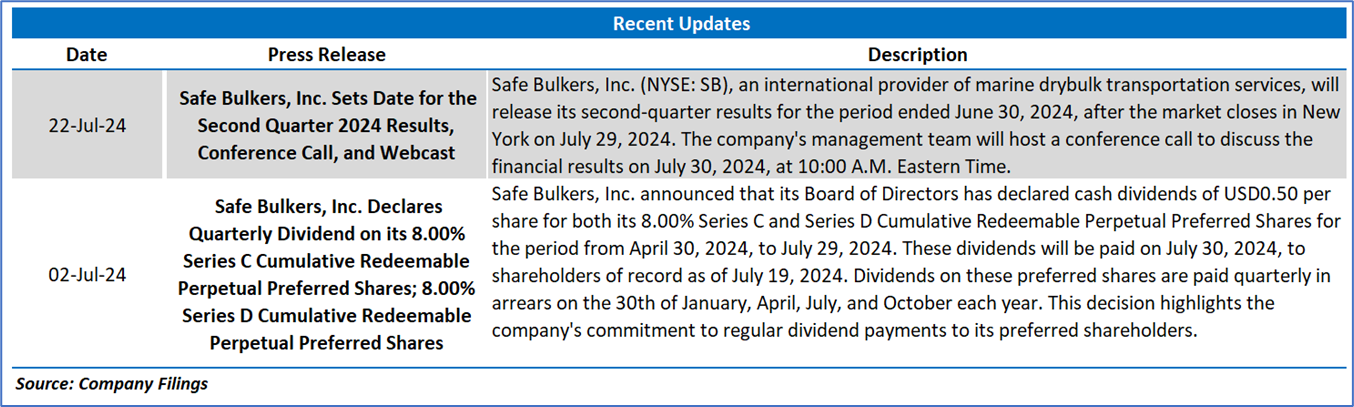
2.1 Recent Updates:
The below picture gives an overview of the recent updates:
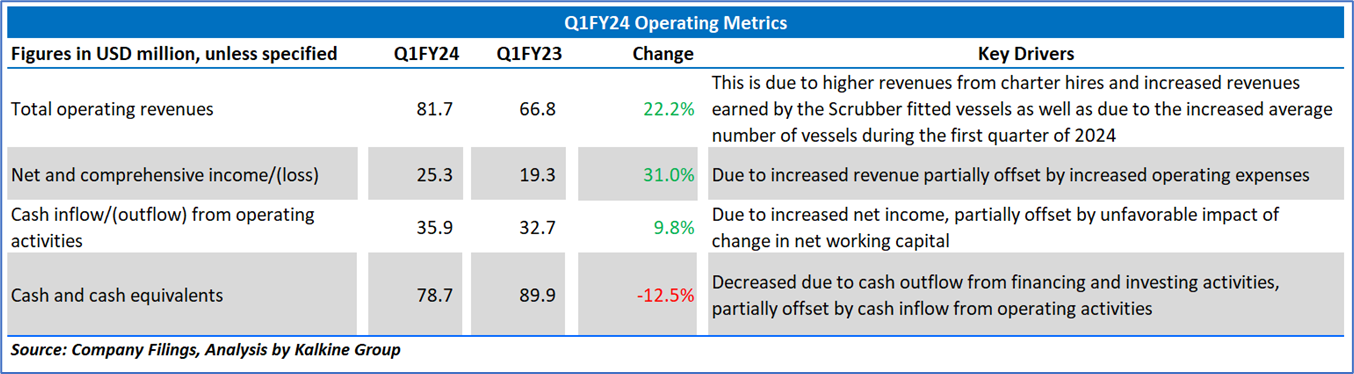
2.2 Insights of Q1FY24:
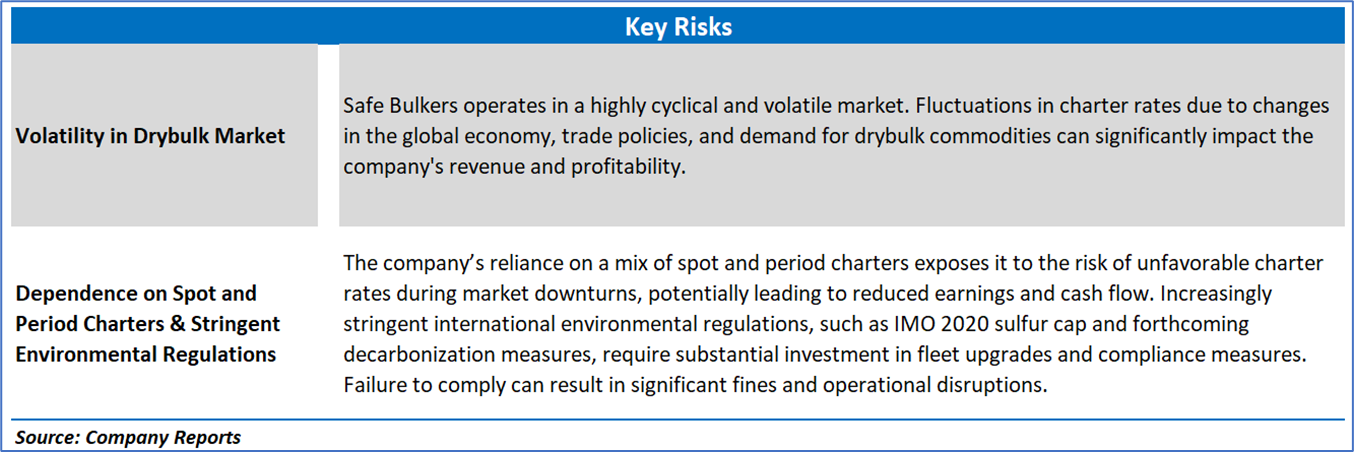
Section 3: Key Risks and Outlook:
Section 4: Stock Recommendation Summary:
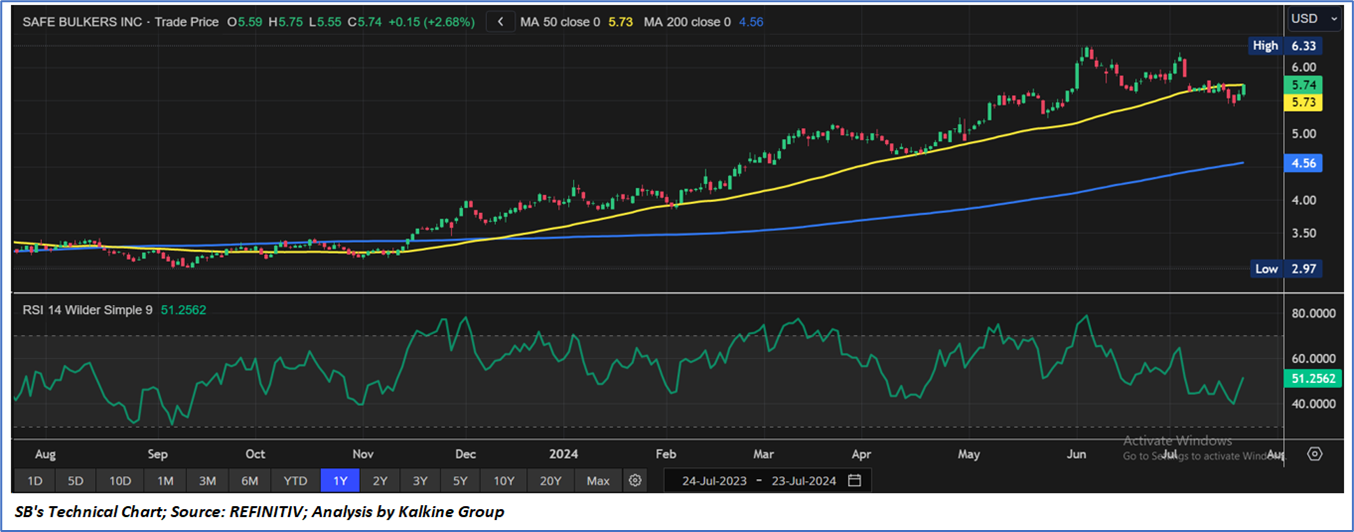
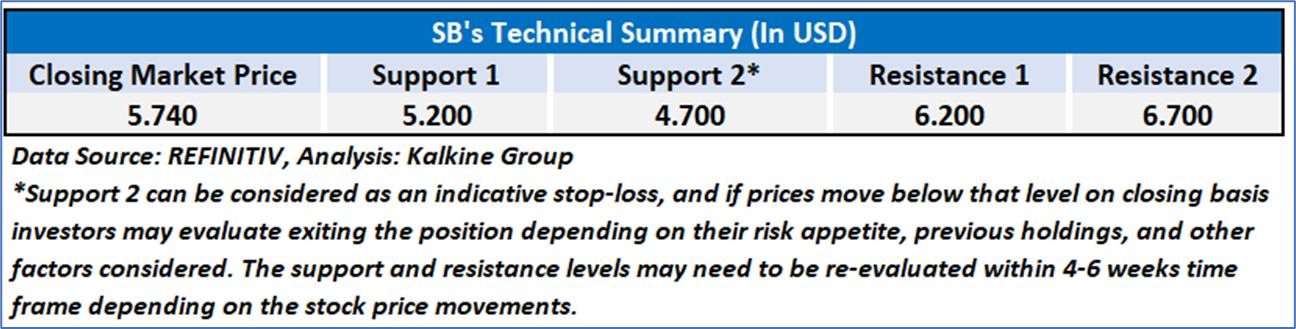
4.1 Technical Summary:
Price Performance:
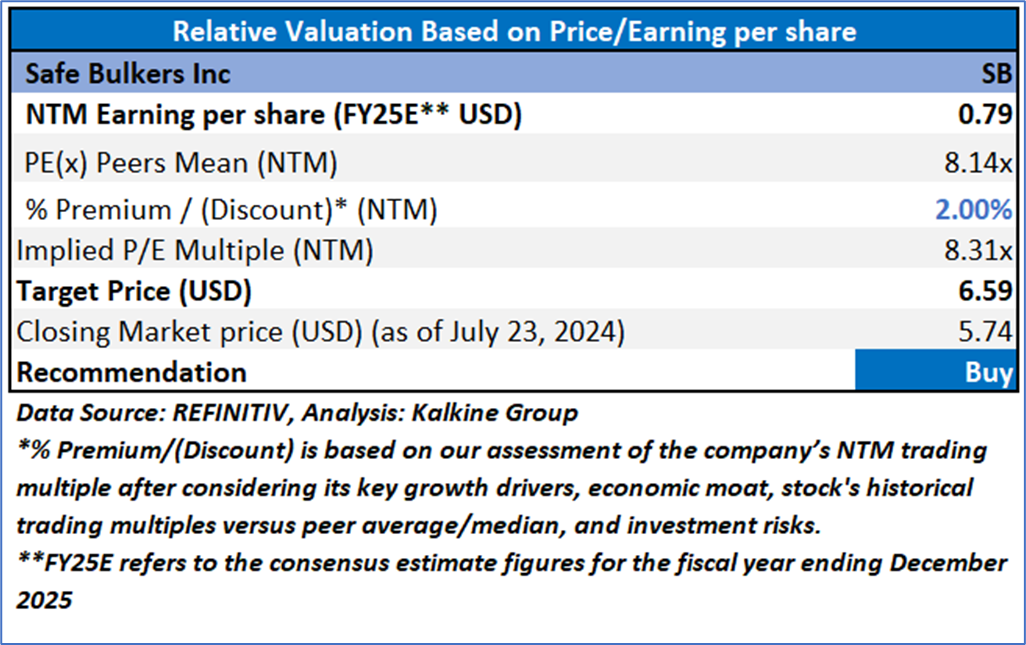
4.2 Fundamental Valuation
Valuation Methodology: Price/Earnings Per Share Multiple Based Relative Valuation

Markets are trading in a highly volatile zone currently due to certain macroeconomic issues and geopolitical tensions prevailing. Therefore, it is prudent to follow a cautious approach while investing.
Note 1: Past performance is not a reliable indicator of future performance.
Note 2: The reference date for all price data, currency, technical indicators, support, and resistance levels is July 23, 2024. The reference data in this report has been partly sourced from REFINITIV.
Note 3: Investment decisions should be made depending on an individual's appetite for upside potential, risks, holding duration, and any previous holdings. An 'Exit' from the stock can be considered if the Target Price mentioned as per the Valuation and or the technical levels provided has been achieved and is subject to the factors discussed above.
Note 4: The report publishing date is as per the Pacific Time Zone.
Technical Indicators Defined: -
Support: A level at which the stock prices tend to find support if they are falling, and a downtrend may take a pause backed by demand or buying interest. Support 1 refers to the nearby support level for the stock and if the price breaches the level, then Support 2 may act as the crucial support level for the stock.
Resistance: A level at which the stock prices tend to find resistance when they are rising, and an uptrend may take a pause due to profit booking or selling interest. Resistance 1 refers to the nearby resistance level for the stock and if the price surpasses the level, then Resistance 2 may act as the crucial resistance level for the stock.
Stop-loss: It is a level to protect against further losses in case of unfavorable movement in the stock prices.
Disclaimer This report has been issued by Kalkine New Zealand Limited (FSP691351) (NZBN:9429047678101) (“Kalkine”). Kalkine is a Financial Advice Provider (“FAP”) and is authorised by a Class 1 Financial Advice Provider Licence issued by Financial Markets Authority (“FMA”) to provide financial advice. Kalkine provides only general financial advice through its research reports following a person becoming a member. The reports contain buy/sell/hold and other recommendations in relation to equity securities, managed funds and other managed investment schemes and other financial advice products. The recommendations and opinions in this report and on Kalkine website do not take into account any of your investment objectives, financial situation or needs. Before you make a decision about whether to acquire a financial product, you should obtain the Product Disclosure Statement from the product issuer. You should consider the appropriateness of advice taking into account your own objectives, financial situation and needs and seek independent financial advice before making any financial decisions. If you act on the advice in the research reports, you may have to pay fees, expenses or other amounts (but not to Kalkine). Further information about the complaints and dispute resolution process, as well as information about Kalkine’s duties are available on Kalkine’s website. Please read our Financial Advice Provider (FAP) disclosure statement and Complaints Handling Guide, which are available on the website.
Past performance is not a reliable indicator of future performance.
 Please wait processing your request...