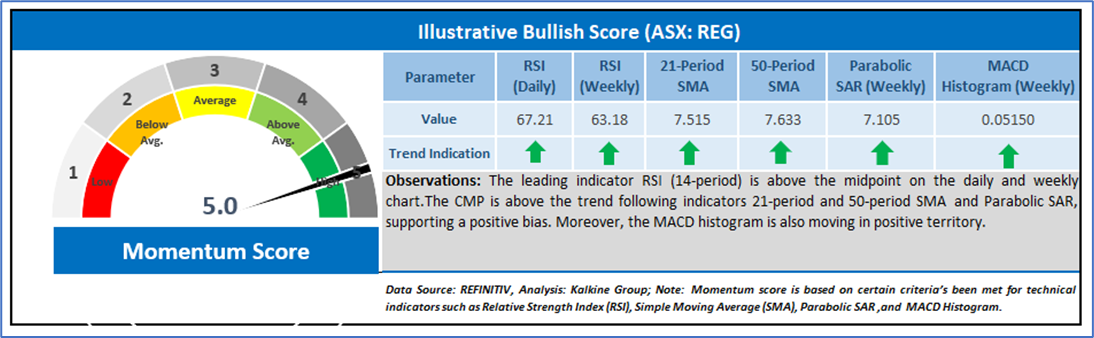
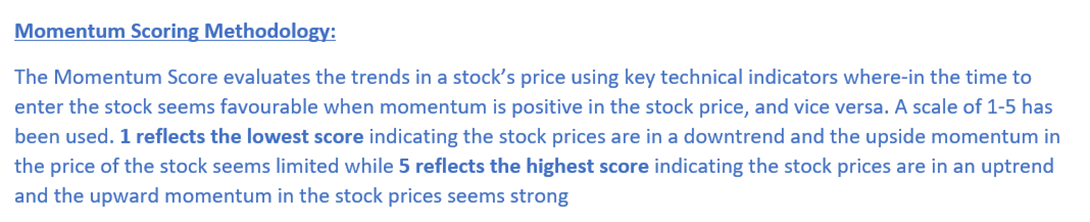
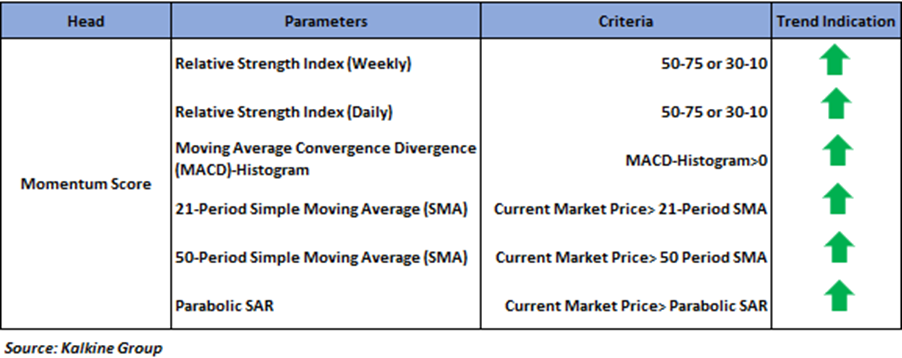
Company Overview: Regis Healthcare Limited (ASX: REG) is an Australia-based aged care operator. The Company provides services to more than 9,000 older Australians through residential aged care homes, home care service hubs, day therapy and day respite centers and retirement villages. Report covers the Price Action, Technical Indicators Analysis along with the Target Levels, Stop Loss, and Recommendation on this stock. Noted below is the illustrative momentum score based on technical indicators for the stock:

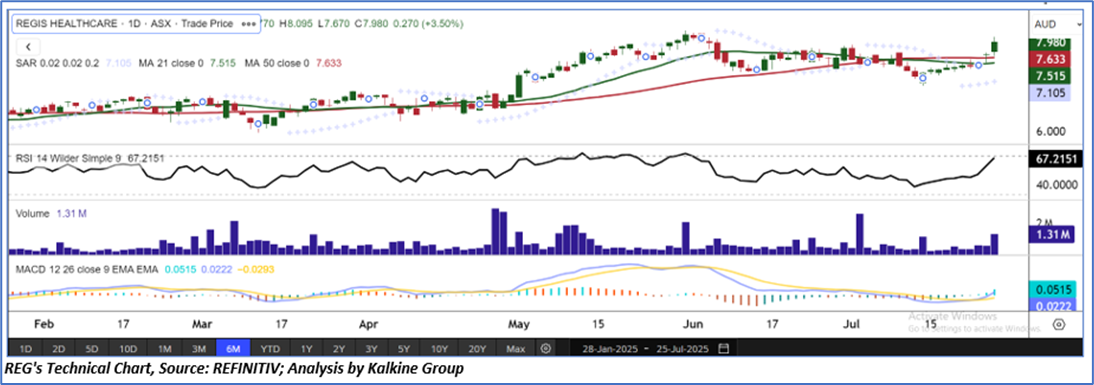
Technical Observation (on the Daily Chart)
REG's stock price has maintained support at key levels and has begun to rise, indicating the possibility of a short-term rally. The Relative Strength Index (RSI) has steadily increased over the past 14 periods, signaling strengthening momentum that is likely to continue. Additionally, the stock is trading above its short-term and medium-term moving averages, reinforcing a strong support base for further gains and boosting the likelihood of sustained upward movement.
Conclusion
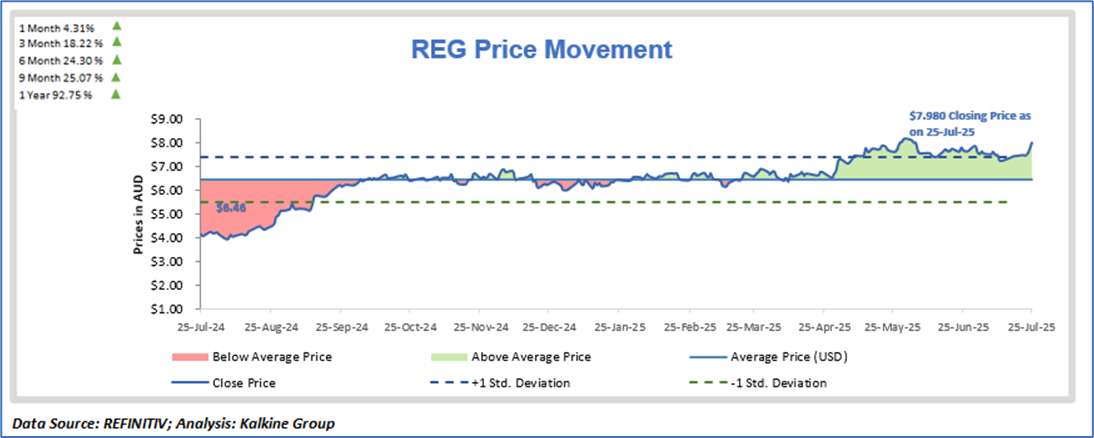
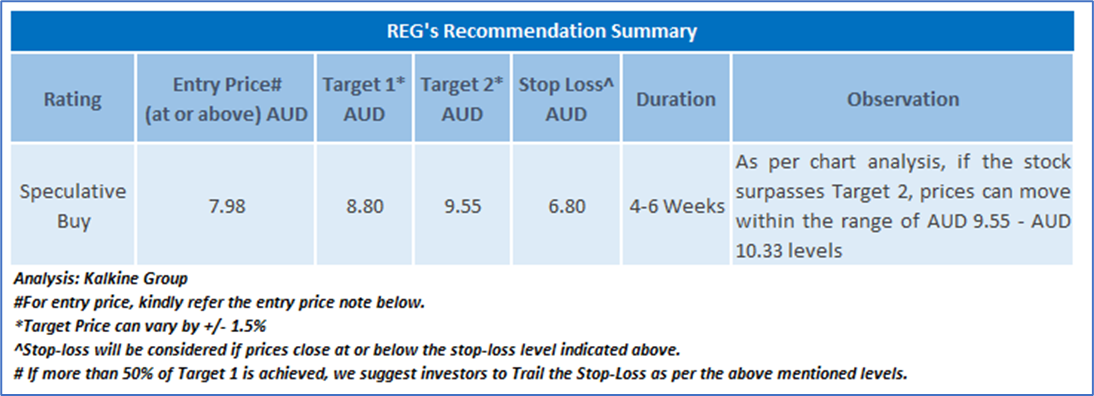
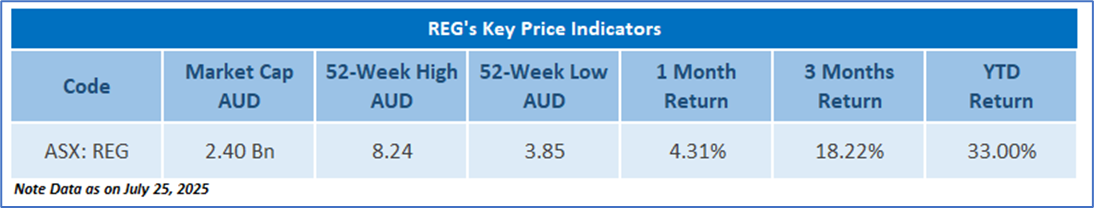
As per the above-mentioned price action and technical indicators analysis, a ‘Speculative Buy’ rating has been given on Regis Healthcare Limited (ASX: REG) at closing price of AUD 7.98 as on July 25, 2025.
Markets are trading in a highly volatile zone currently due to certain macro-economic issues and prevailing geopolitical tensions. Therefore, it is prudent to follow a cautious approach while making investment decisions.

Note 1: Past performance is not a reliable indicator of future performance.
Note 2: Investment decision should be made depending on an individual’s appetite for upside potential, risks, and any previous holdings. This recommendation is purely based on technical analysis, and fundamental analysis has not been considered in this report. Individuals can consider exiting from the stock if the Target Price or Stop loss mentioned as per the technical analysis has been achieved and subject to the factors discussed above.
Note 3: Related Risks: This report may be looked at from a high-risk perspective and recommendations are provided for a short duration. Recommendations provided in this report are solely based on technical parameters, and the fundamental performance of the stocks has not been considered in the decision-making process. Other factors which could impact the stock prices include market risks, regulatory risks, interest rates risks, currency risks, social and political instability risks etc.
Note 4: The holding duration for recommendations is 4-6 weeks; however, an extension of a further 2 weeks may be considered with an update report in case the opportunity looks technically well placed. The maximum holding duration is expected to be 8 weeks post which the position will be closed automatically in case no resistance, support and or stop loss levels are hit at the close price of the due date.
Note 5: How to Read the Charts?
The Green colour line reflects the 21-period moving average while the red line indicates the 50-period moving average. SMA helps to identify existing price trend. If the prices are trading above the 21-period and 50-period moving average, then it shows prices are currently trading in a bullish trend.
The Black colour line in the chart’s lower segment reflects the Relative Strength Index (14-Period) which indicates price momentum and signals momentum in trend. A reading of 70 or above suggests overbought status while a reading of 30 or below suggests an oversold status.
The Blue colour bars in the chart’s lower segment show the volume of the stock. The volume is the number of shares that changed hands during a given day. Stocks with high volumes are more liquid than stocks with lesser volume as liquidity in stocks helps with easier and faster execution of the order.
The Orange colour lines are the trend lines drawn by connecting two or more price points and used for trend identification purposes. The trend line also acts as a line of support and resistance.
Technical Indicators Defined: -
Stop-loss: In general, it is a level to protect further losses in case of unfavourable movement in the stock prices.
Parabolic SAR: Parabolic SAR is a trend-following indicator that acts as a trailing stop. If the price stops rising and reverses below SAR, it indicates the start of a downtrend with SAR above the price following like a trailing stop. Similarly, if the prices stop falling and move above SAR, it indicates the start of an uptrend with SAR below the price following like a trailing stop.
MACD-Histogram: Moving Average Convergence Divergence (MACD)-Histogram is the difference between the MACD and its signal line. A positive value of the MACD-Histogram indicates a positive crossover between MACD and its signal line, whereas a negative value indicates a negative crossover.
The reference date for all price data, currency, technical indicators, support, and resistance levels is July 25, 2025. The reference data in this report has been partly sourced from REFINITIV.
Abbreviations
CMP: Current Market Price
SMA: Simple Moving Average
AUD: Australian Dollar
RSI: Relative Strength Index
Note: Trading decisions require a thorough analysis by individuals. Technical reports in general chart out metrics that may be assessed by individuals before any stock evaluation. The above are illustrative analytical factors used for evaluating stocks; other parameters can be looked at along with additional risks per se. Past performance is neither an indicator nor a guarantee of future performance.
Disclaimer This report has been issued by Kalkine New Zealand Limited (FSP691351) (NZBN:9429047678101) (“Kalkine”). Kalkine is a Financial Advice Provider (“FAP”) and is authorised by a Class 1 Financial Advice Provider Licence issued by Financial Markets Authority (“FMA”) to provide financial advice. Kalkine provides only general financial advice through its research reports following a person becoming a member. The reports contain buy/sell/hold and other recommendations in relation to equity securities, managed funds and other managed investment schemes and other financial advice products. The recommendations and opinions in this report and on Kalkine website do not take into account any of your investment objectives, financial situation or needs. Before you make a decision about whether to acquire a financial product, you should obtain the Product Disclosure Statement from the product issuer. You should consider the appropriateness of advice taking into account your own objectives, financial situation and needs and seek independent financial advice before making any financial decisions. If you act on the advice in the research reports, you may have to pay fees, expenses or other amounts (but not to Kalkine). Further information about the complaints and dispute resolution process, as well as information about Kalkine’s duties are available on Kalkine’s website. Please read our Financial Advice Provider (FAP) disclosure statement and Complaints Handling Guide, which are available on the website.
Past performance is not a reliable indicator of future performance.
 Please wait processing your request...