
Company Overview: Precinct Properties New Zealand Limited (NZX: PCT) is engaged in investing prime central business district (CBD) properties in New Zealand, which comprises over 300,000 square meters over approximately 10 buildings. The Company is managed by AMP Haumi Management Limited.
PCT owns inner-city business space in Auckland and Wellington. Some of the important properties at Auckland and Wellington include AMP Centre, ANZ Centre, Bowen Campus, Central on Midland Park, Deloitte House, HSBC House, Mason Brothers Building, Mayfair House etc. Under its business model, the properties are given on lease to the businesses and government organizations, including Air New Zealand, ANZ, Microsoft, PwC, The Treasury, State Insurance, and Zurich.
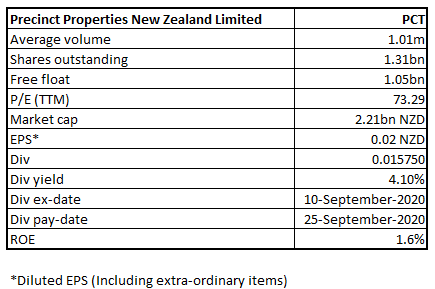
PCT Details
Aiming to Create Sustainable Value from Real Estate: Precinct Properties New Zealand Limited (NZX: PCT) is the largest owner and developer of premium inner-city business space in Auckland and Wellington. The company has a market capitalization of ~$2.21 billion as on October 5, 2020. The key growth drivers for the real estate market are charted below:
Figure 1: Key Growth Drivers for Real Estate Market
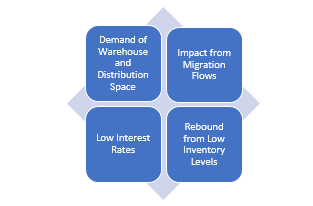
Source: Kalkine Group
The housing market has reflected incredible resilience since the end of Level 4 lockdown, as housing prices surged 4.6% over the last three months (as per REINZ House Price Index - August 2020). In Auckland, the Housing Price Index (HPI) was up by 5.0%, while in the rest of the country excluding Auckland, the HPI was up 4.3% over the last three months.
The increased demand for warehouse and distribution space throughout Auckland will keep REIT space afloat. As per the Reserve Bank of New Zealand, migration flows affect the demand side of the housing equation. Increased migration to New Zealand generally results in a surge in the housing demand. The low-interest rate is another significant demand driver of real estate. Under the current scenario, the interest rates appear to remain low till 2023 which will be a key positive factor for the demand for properties to return to new normal.
Results Performance (Year Ended 30th June 2020)
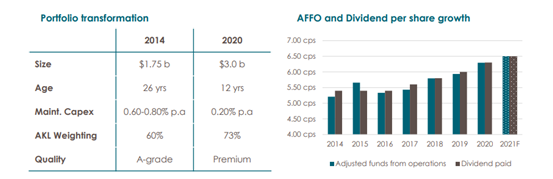
Looking at the past performance, PCT’s top line of the company grew at a compounded annual growth rate (CAGR) of 0.98% from $146.0 million in FY16 to $151.8 million in FY20. The company has consistently paid dividends for the past six years. Besides, PCT’s portfolio transformation to premium grade developments since the past six years augurs well for the investors.
Figure 2: Portfolio Transformation and Dividend Performance
Source: Company Reports
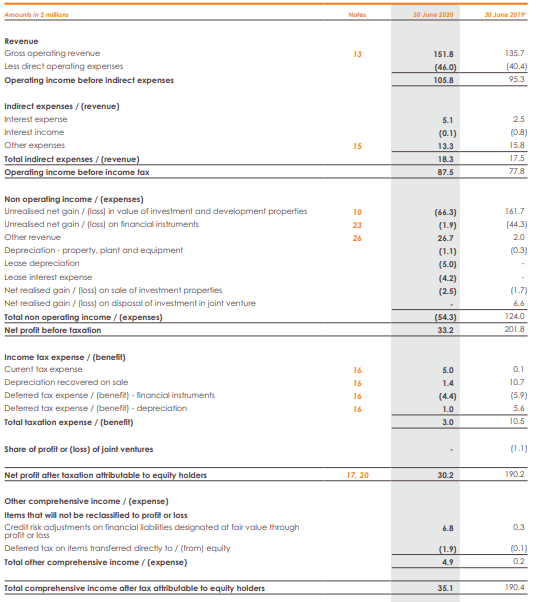
The company reported a total comprehensive income after tax of $35.1 million for FY20 in line with guidance. The adjusted funds from operations (AFFO) for the period stood at 6.29 cents per share (cps), an increase of 5.9% YoY. While the company’s investment and development portfolio are supported by its high-quality client base, strong metrics, and strategic locations, its asset values have been adversely affected by COVID-19. The company’s full-year revaluations recorded a loss of $66.3 million for the period.
PCT’s reportable segments include Investment properties and Flexible space. Under Investment properties, the company has an investment in predominately prime CBD properties. Operating income before indirect expenses under the segment stood at $97.2 million. Under Flexible space, the company manages the operation of co-working and shared space. Operating income before indirect expenses under the segment stood at $8.6 million. The Board of Directors declared a full-year dividend of 6.30 cps, an increase of 5.0% YoY.
Figure 3: Income Statement (Year ended 30th June 2020)
Source: Company Reports
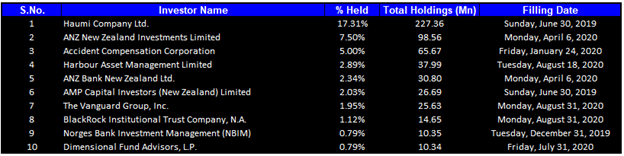
Top 10 Shareholders: The top 10 shareholders have been highlighted in the table, which together forms around 41.71% of the total shareholding. Haumi Company Limited and ANZ New Zealand Investments Limited are holding a maximum stake in the company at 17.31% and 7.50%, respectively, as provided in the table shown below:
Figure 4: Top 10 Shareholders
Source: Refinitiv (Thomson Reuters)
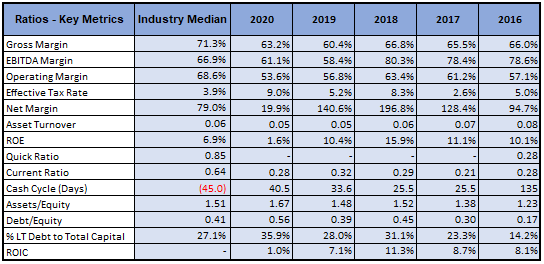
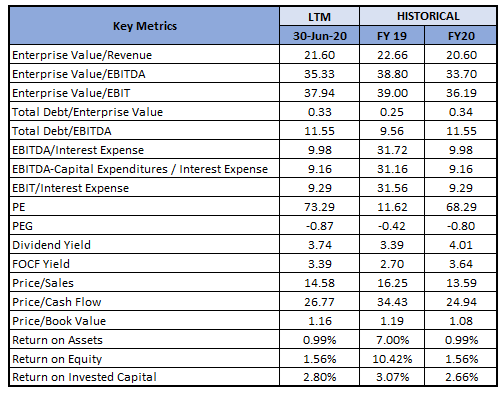
A Quick Look at Key Metrics: The company’s gross margin and EBITDA margin for FY20 stood at 63.2% and 61.1%, better than the FY19 result of 60.4% and 58.4%, respectively, implying that the company’s operational efficiency is improving.
Figure 5: Key Metrics
Source: Refinitiv (Thomson Reuters)
Company Outlook: Despite the negative impacts of the COVID-19 pandemic, FY20 performance has been resilient. This reflects upon the high quality of the company’s assets and its ability to attract quality clients and retain them. The company’s portfolio is supported by stable and secure income. The company’s clients include corporate investment-grade occupiers, leading legal and professional services firms, and government entities. The Government contributes about 30% of the company’s office revenue thereby providing a high level of income certainty.
As per the release, the company expects FY21 AFFO (before performance fees) at 6.50 cps, with a total dividend of 6.50 cps. The economic conditions are improving as demand drivers are slowly becoming more evident post return to alert level 1. The government has further eased restrictions which is going to improve business sentiments, and demand for properties. PCT’s high occupancy, well-located buildings, and long weighted average lease term positions it to meet business-related challenges.
Figure 6: Key Valuation Metrics
Source: Refinitiv (Thomson Reuters)
Valuation Methodology: P/E Multiple Based Relative Valuation (Illustrative)
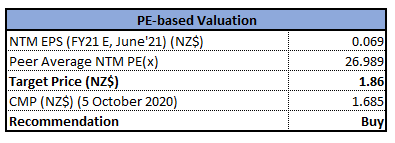
P/E Multiple Based Valuation (Source: Refinitiv (Thomson Reuters))
Note: All forecasted figures and peers have been taken from Thomson Reuters, NTM-Next Twelve Months
Technical Overview:
Weekly Chart –
.png)
Source: Refinitiv (Thomson Reuters)
Note: Purple colour lines are Bollinger Bands with the upper band suggesting overbought status while the lower band oversold status, and yellow lines are Fibonacci retracement lines which measure price rebound and backtrack.
The stock has for multi-weeks been trading in the broader range, provided by 61.8% retracement level of $1.75 on the upside whereas 38.2% retracement level of $1.63 on the downside thereby forming ‘Rectangle Pattern’. It is a kind of continuation pattern formed in an up-trending market and hence has the potential to give a bullish break-out. The Technical indicator RSI with around 50 reading suggests strong bullish momentum for the stock.
Going forward, the stock may have resistance around $1.85 whereas support could be around the 38.2% retracement level of $1.63.
Stock Recommendation: The pandemic (Covid-19) has created operational challenges at both domestic and international levels. The company, on the back of high occupancy and long-term average weighted lease term, is well-positioned to cater to its existing and new high-quality clients’ demand. With the gaining of momentum in economic activities, PCT is expected to further improve upon its operating and financial performance.
We have applied P/E multiple based relative valuation (on an illustrative basis) and have arrived at the target price which reflects the potential upside of lower double-digit (in % terms).
Considering the aforesaid facts, positive FY20 results, and our outlook on the property sector, we give a “Buy” recommendation on the stock at the current market price of NZ$1.685 per share, down by 0.30% on October 5, 2020.
.png)
PCT Daily Technical Chart (Source: Refinitiv (Thomson Reuters))
Disclaimer
Kalkine New Zealand Limited is authorised to provide class advice only. The information on this site does not take into account any of your investment objectives, financial situation or needs. Before you make a decision about whether to acquire a financial product, you should obtain the Product Disclosure Statement from the product issuer. You should consider the appropriateness of advice taking into account your own objectives, financial situation and needs and seek independent financial advice before making any financial decisions.
Past performance is not a reliable indicator of future performance.
 Please wait processing your request...