
Company Overview: New Zealand-based company, Port of Tauranga Limited (NZX: POT) operates a port and is the international freight gateway for the country’s imports and exports. The Company carries out its business through the provision of wharf facilities, land, and buildings, for the storage and transit of import and export cargo, berthage, cranes, tugs, and pilot services for customers.
Its three segments are Port Operations, Property Services and Marshalling Services. The Port Operations segment's operations consist of providing and managing port services, and cargo handling facilities through the Port of Tauranga and MetroPort. The Property Services segment consists of managing and maintaining the port's property assets. The Marshalling Services segment consists of the contracted terminal operations, stevedoring, marshalling and scaling activities of Quality Marshalling (Mount Maunganui) Limited, a subsidiary of the Company.
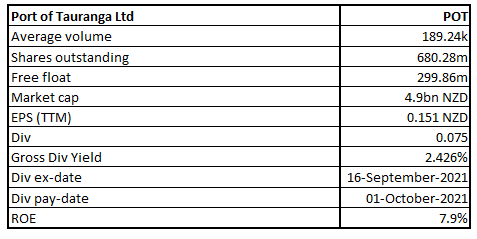
POT Details

Port of Tauranga Limited (NZX: POT) is New Zealand’s largest port and international freight gateway. The location of the port is central to key export commodity sources.
Looking at the historical performance, POT’s topline and bottom line for FY17-21 grew with a compounded annual growth rate (CAGR) of 7.23% and 5.26%, respectively. Its total revenue for FY21 stood at $338.3 million, as compared to $255.9 million in FY17, and its net income for FY21 stood at $102.4 million, as compared to $83.4 million in FY20.
Exhibit 1: Operating Performance
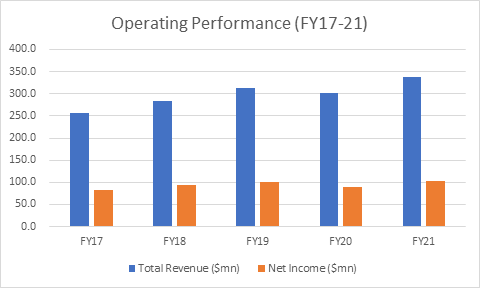
Source: Company Reports, Analysis by Kalkine Group
Results Performance (FY21 Ended 30 June 2021)
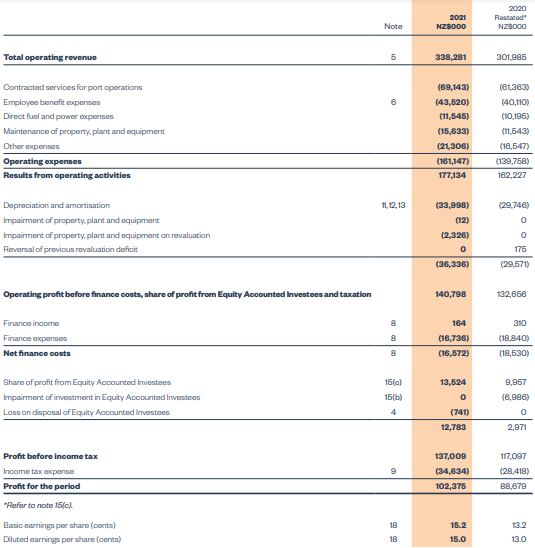
Exhibit 2: Income Statement
Key Data (Source: Company Reports)
Top 10 Shareholders: The top 10 shareholders have been highlighted in the pie chart , which together forms around 56.29% of the total shareholding. Quayside Securities Ltd. and Kotahi Logistics LP are holding a maximum stake in the company at 54.17% and 1.25%, respectively, as provided in the table below:
Exhibit 3: Top 10 Shareholders
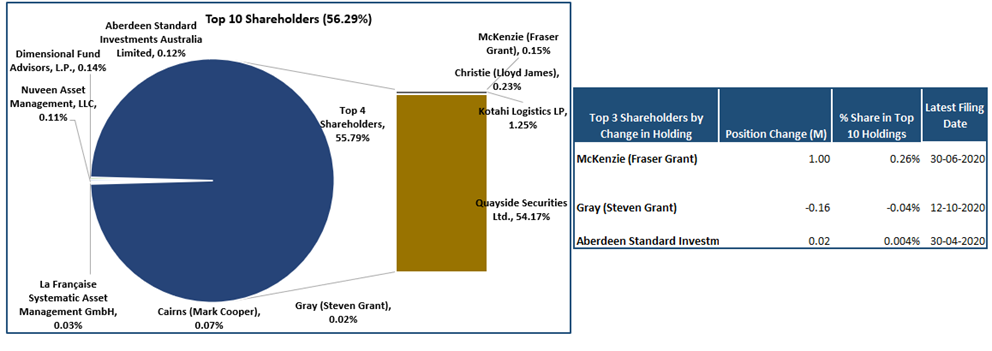
(Source: Analysis by Kalkine Group)
A Quick Look at Key Metrics: The company’s gross margin, EBITDA margin and net margin for FY21 stood at 76.1%, 52.4% and 30.3%, better than the industry median of 59.8%, 41.8% and 21.1%, respectively, implying a stronger operating efficiency for the company. In terms of liquidity, the current ratio improved from 0.17x in FY17 to 0.23x in FY21. The company has also seen a significant improvement in its cash cycle days which has decreased sharply from 73.5 days in FY20 to 24.7 days in FY21.
Exhibit 4: Key Metrics
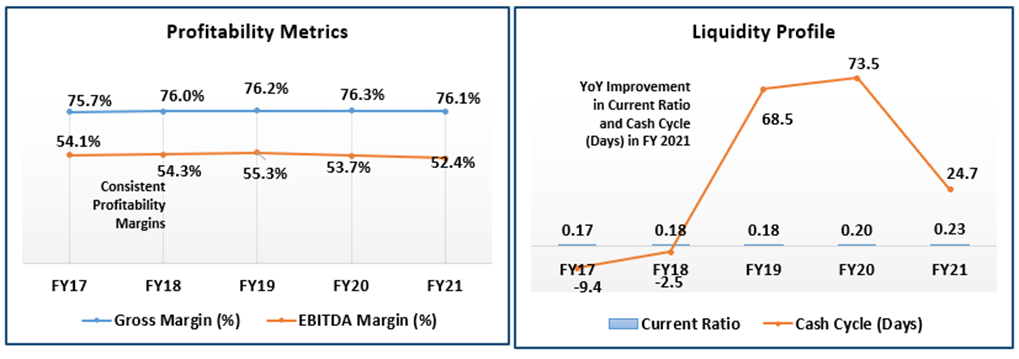
(Source: Analysis by Kalkine Group)
Outlook:
The company managed to deliver a strong set of results for FY21 despite the pandemic causing major disruption in international supply chains. Constrained port capacity further added to woes. However, the company’s diversity of cargoes and long freight agreements with key customers provided resilience in cargo volumes and revenues. The company in the meantime, has applied for resource consent to extend its container berths to ensure a resilient supply chain. It is also pursuing its plans to automate container storage to increase its capacity.
Besides, the opening of the inland port at the Ruakura Superhub will further extend its capabilities. However, the disruption to the international supply chain remains, and the challenges in Auckland are unlikely to be resolved soon. Covid-19 precautions are expected to continue to impact efficiency and costs as the company continues to prioritise health and safety. In recent months, the company witnessed a worsening sector-wide labour shortage that has the potential to impact operations.
Key Risks:
The company is susceptible to any natural disaster event along with risks associated with commercial and business due to global economic or geopolitical situations. Besides, it is also exposed to risks of cyberattack, legal and regulatory risks.
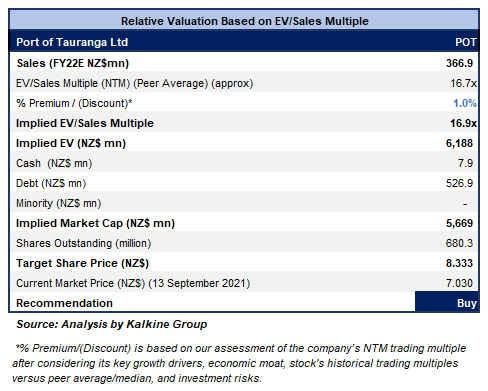
Valuation Methodology: EV/Sales Multiple Based Relative Valuation (Illustrative)
Technical Overview:
Chart:
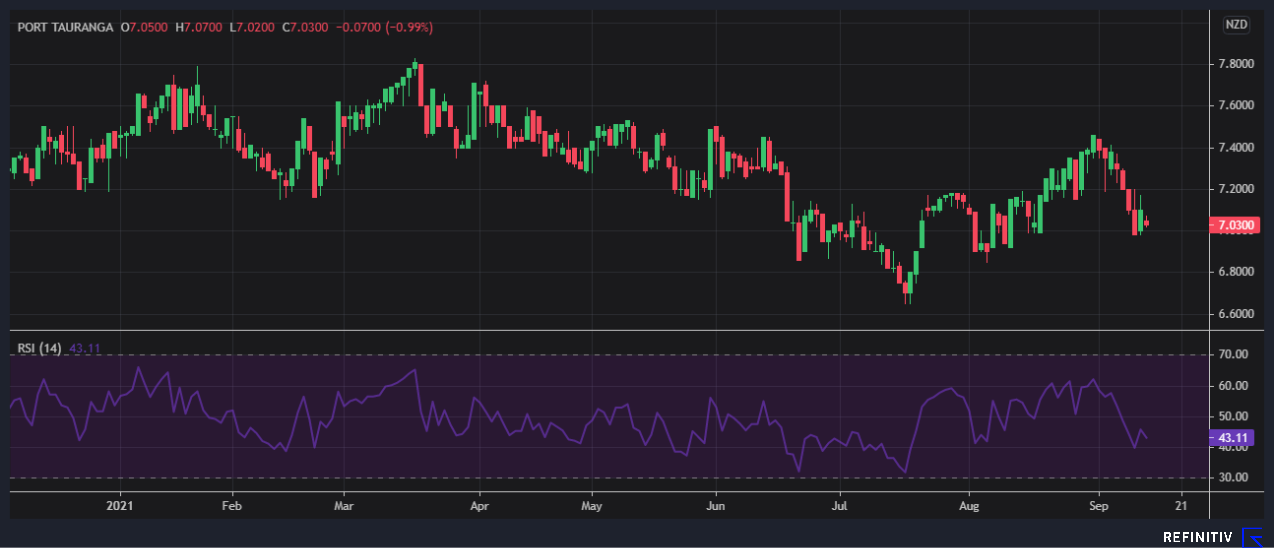
Source: REFINITIV
Note: Purple Color Line Reflects RSI (14-Period)
.png)
Stock Recommendation:
The company has reported improvements in its return ratios for FY21 whereby its ROE has increased to 7.9% in comparison to 7.4% in FY20 and the industry median of 7.0%. It has also shown improvement in liquidity ratio to 0.23x in FY21 as against 0.20x in FY20. The company’s debt-to-equity ratio for FY21 has decreased to 0.38x in comparison to 0.43x in FY20 and the industry median of 0.43x. Thus, the company has been showing signs of improved profitability, liquidity and solvency ratio.
The stock has been valued using an EV/Sales multiple-based illustrative relative valuation and has arrived at a target price that reflects a rise of low double-digit (in % terms). A slight premium has been applied to EV/Sales Multiple (NTM) (Peer Average) considering long-term operating agreements as well as decent outlook.
Hence, we give a “Buy” recommendation on the stock at the current market price of NZ$7.030 per share (New Zealand Time: 11:42 AM (GMT +12)) on September 13, 2021.
Note 1: The reference data in this report has been partly sourced from REFINITIV.
Note 2: Investment decisions should be made depending on the investors’ appetite on upside potential, risks, holding duration, and any previous holdings. Investors can consider exiting from the stock if the Target Price mentioned as per the analysis has been achieved and subject to the factors discussed above alongside support levels provided.
Technical Indicators Defined:-
Support: A level where-in the stock prices tend to find support if they are falling, and downtrend may take a pause backed by demand or buying interest.
Resistance: A level where-in the stock prices tend to find resistance when they are rising, and uptrend may take a pause due to profit booking or selling interest.
Stop-loss: It is a level to protect further losses in case of unfavourable movement in the stock prices.
Disclaimer
Kalkine New Zealand Limited is authorised to provide general advice only. The information on this website does not take into account any of your investment objectives, financial situation or needs. Before you make a decision about whether to acquire a financial product, you should obtain the Product Disclosure Statement from the product issuer. You should consider the appropriateness of advice taking into account your own objectives, financial situation and needs and seek independent financial advice before making any financial decisions.
Past performance is not a reliable indicator of future performance.
 Please wait processing your request...