
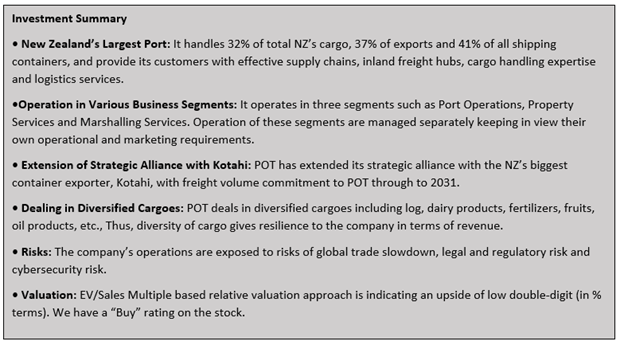
Company Overview: New Zealand-based company, Port of Tauranga Limited (NZX: POT) operates a port and natural freight gateway to and from international markets. The Company carries out its business through the provision of wharf facilities, land and buildings, for the storage and transit of import and export cargo, berthage, cranes, tugs and pilot services for customers.
Its three segments are Port Operations, Property Services and Marshalling Services. The Port Operations segment's operations consist of providing and managing port services, and cargo handling facilities through the Port of Tauranga and MetroPort. The Property Services segment consists of managing and maintaining the port's property assets. The Marshalling Services segment consists of the contracted terminal operations, stevedoring, marshalling and scaling activities of Quality Marshalling (Mount Maunganui) Limited, a subsidiary of the Company.
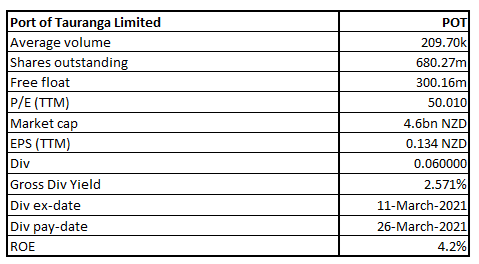
POT Details
Port of Tauranga Limited (NZX: POT) is New Zealand’s largest port and international freight gateway. The location of the port is central to key export commodity sources. The company has a market capitalisation of around $4.6 billion as on 19th July 2021.
Looking at the past performance, POT’s top-line over FY16-20 grew at a compounded annual growth rate (CAGR) of 5.31%. Its total revenue for FY20 stood at $302.0 million, as compared to $245.5 million in FY16.
Exhibit 1: POT's Resilient Operating Performance (FY16-20)
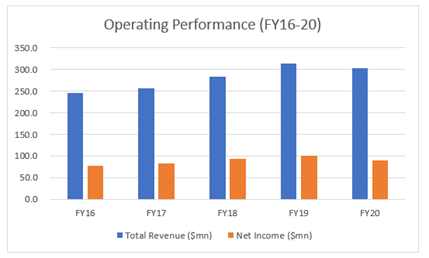
(Source: Company Reports, Analysis by Kalkine Group)
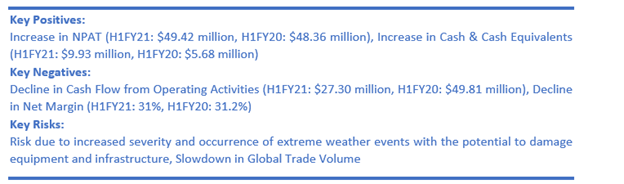
Results Performance (Half-Year Ended December 31, 2020 – H1FY21)
The Board of Directors declared an interim dividend of 6.0 cents, the same as last year.
Exhibit 2: Income Statement
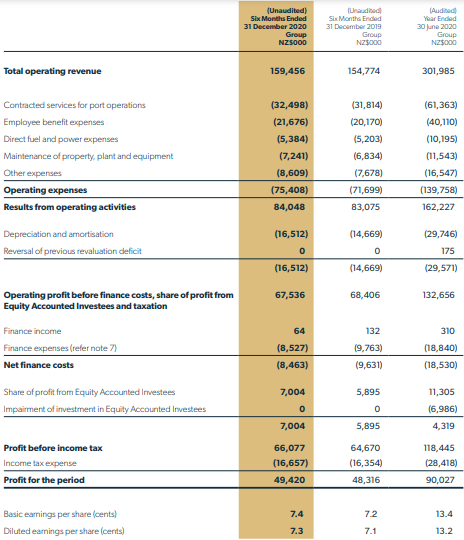
Key Data (Source: Company Reports)
Results Performance (Year Ended June 30, 2020 – FY20)
Top 10 Shareholders: The top 10 shareholders have been highlighted in the pie-chart, which together forms around 56.29% of the total shareholding. Quayside Securities Ltd. and Kotahi Logistics LP are holding a maximum stake in the company at 54.17% and 1.25%, respectively, as provided in the chart shown below:
Exhibit 3: Top 10 Shareholders
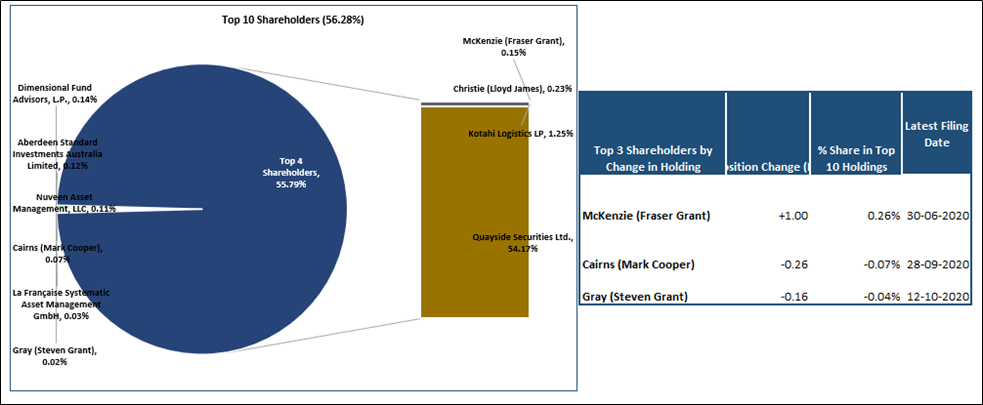
Data Source: Refinitiv, Analysis by Kalkine Group
A Quick Look at Key Metrics:
The company witnessed consistency to a moderate increase in gross margin while consistency to a moderate decline in EBITDA margin in comparison to the same period last year. The period also witnessed an improvement in cash conversion cycle with a reduction in cash cycle days. In H1 FY 2021, its cash cycle stood at 68.6 days as compared to H1 FY 2020 figure of 77.4 days.
Exhibit 4: Key Metrics
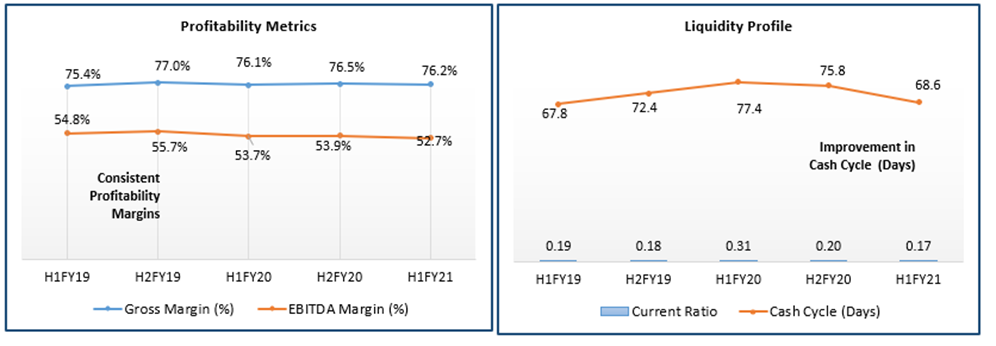
Data Source: Refinitiv, Analysis by Kalkine Group
Recent Update:
As per the market update of 12 July 2021, the company’s annual result for the year ended 30 June 2021 (FY21) will be released on 27 August 2021.
Outlook:
Despite volatile cargo volumes and congestion issues experienced, POT managed to deliver an encouraging interim result. Moreover, the company completed the acquisition of Kotahi Logistics’ 50% holding in Timaru Container Terminal which is being operated by its subsidiary, Quality Marshalling. To address the issue of congestion, the company has applied for consent on its proposed berth extension. Further, the inland port is due to open in 2022. Further, China has seen its economy recovering fast which is expected to drive the overall trading volumes including log exports volumes. Besides, the company’s balance sheet provides strength to tackle any challenges that might arise with the lingering of pandemic issue. In the meanwhile, the management of the company expects full year FY21 earnings to be in the range of $94 million - $100 million compared with $90 million in FY20.
Key Risks:
The company is susceptible to a slowdown in global trade volumes as a result of a more inward-looking policy, and natural calamities which could adversely affect the earnings and profitability of the company.
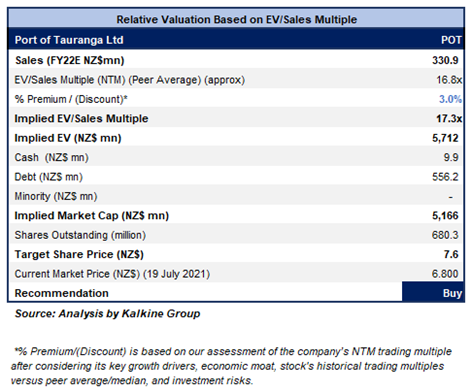
Valuation Methodology: EV/Sales Based Relative Valuation (Illustrative)
Technical Overview:
Weekly Chart –
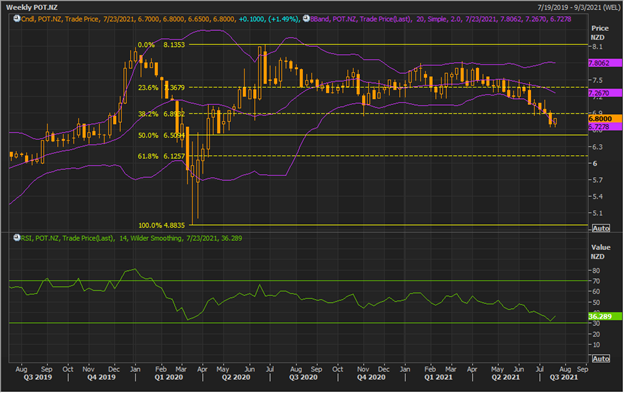
Source: REFINITIV
Note: Purple colour lines are Bollinger Bands® with the upper band suggesting overbought status while the lower band oversold status, and yellow lines are Fibonacci retracement lines which measure price rebound and backtrack. https://www.bollingerbands.com/
The stock on the first trading session of the ongoing week has given a higher close at $6.80 with a ‘Bullish Harami’ pattern formed on the weekly chart thereby suggesting a bullish reversal for the stock. The technical indicator RSI with a reading around 36 and a curve at the end pointing up, indicates the gaining of positive momentum.
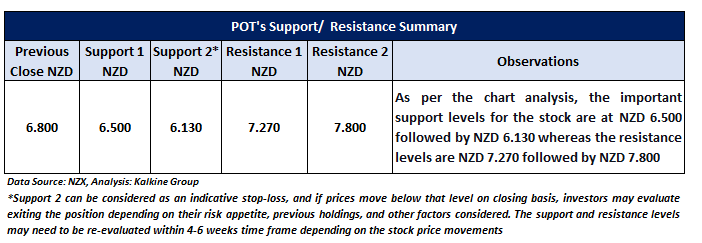
Going forward, the stock may have resistance around 20 periods SMA of $7.27 whereas support could be around the 50% retracement level of $6.50.
Stock Recommendation:
The company’s stock declined by ~13.3% in 1 year. It has made a 52-week low and high of $6.6500 and $7.9, respectively.
We have valued the stock using the EV/Sales multiple based illustrative relative valuation method and arrived at a target price which reflects the rise of low double-digit (in percentage terms). We have applied a slight premium to EV/Sales Multiple (NTM) (Peer Average) considering rise in NPAT and its operations in various business segments. Also, the company witnessed a rise in cash and cash equivalents which could help the company in tackling challenges. In the coming period, the company is expected to see improvement in its earnings with the increase in trade activities especially with China.
Hence, we give a “Buy” recommendation on the stock at the current market price of NZ$6.800 per share, up by 1.49% on July 19, 2021.
Note 1: The reference data in this report has been partly sourced from REFINITIV.
Note 2: Investment decisions should be made depending on the investors’ appetite on upside potential, risks, holding duration, and any previous holdings. Investors can consider exiting from the stock if the Target Price mentioned as per the analysis has been achieved and subject to the factors discussed above alongside support levels provided.
Technical Indicators Defined:-
Support: A level where-in the stock prices tend to find support if they are falling, and downtrend may take a pause backed by demand or buying interest.
Resistance: A level where-in the stock prices tend to find resistance when they are rising, and uptrend may take a pause due to profit booking or selling interest.
Stop-loss: It is a level to protect further losses in case of unfavourable movement in the stock prices
Disclaimer
Kalkine New Zealand Limited is authorised to provide class advice only. The information on this site does not take into account any of your investment objectives, financial situation or needs. Before you make a decision about whether to acquire a financial product, you should obtain the Product Disclosure Statement from the product issuer. You should consider the appropriateness of advice taking into account your own objectives, financial situation and needs and seek independent financial advice before making any financial decisions.
Past performance is not a reliable indicator of future performance.
 Please wait processing your request...