
Company Overview: New Zealand-based company, Port of Tauranga Limited (NZX: POT) operates a port, serving predominantly the forestry and farming industries. It is the international freight gateway for the country’s imports and exports. It operates in three segments including Port Operations, Property Services and Marshalling Services. The Port Operations segment's operations consist of providing and managing port services, and cargo handling facilities through the Port of Tauranga and MetroPort. The Property Services segment consists of managing and maintaining the port's property assets. The Marshalling Services segment consists of the contracted terminal operations, stevedoring, marshalling and scaling activities of Quality Marshalling (Mount Maunganui) Limited, a subsidiary of the Company.
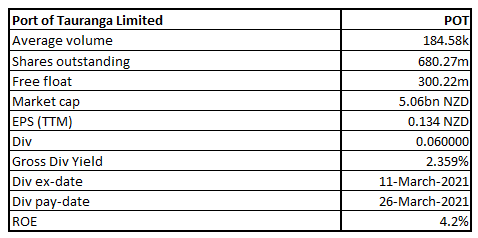
POT Details
Port of Tauranga Limited (NZX: POT) is New Zealand’s largest port and international freight gateway. The location of the port is central to key export commodity sources. The company has a market capitalisation of around ~$5.06 billion as on 14th June 2021.
Looking at the past performance, POT’s topline for FY16-20 grew with a compounded annual growth rate (CAGR) of 5.31%. Its total revenue for FY20 stood at $302.0 million, as compared to $245.5 million in FY16.
Results Performance (Half-Year Ended December 31, 2020)
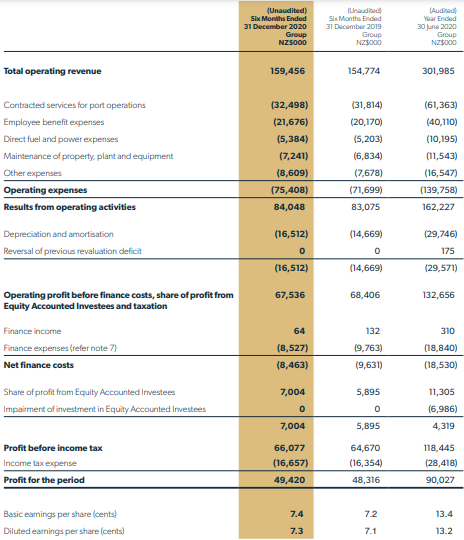
Despite volatile cargo volumes and congestion issues at Ports of Auckland, the revenue of the company from continuing operations for the interim period stood at $159.456 million, an increase of 3.0% on the previous corresponding period (pcp). This increase in revenue can be attributed to greater income from the container terminal and strong performances from subsidiaries and associates, which saw a 22.3% increase in earnings. The overall costs during the interim period increased by 5.2%, which had its impact on lowering the pace of growth of NPAT which grew by 2.3% to $49.4 million.
Looking at overall cargo tonnes, volumes decreased by 1.3% for the six-month period, yet volumes in December 2020 were 15.1% higher than the same month in 2019.
The Board of Directors declared an interim dividend of 6.0 cents, the same as last year.
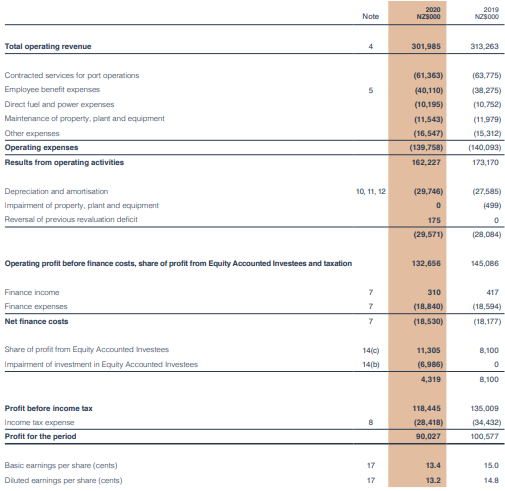
Exhibit 1: Income Statement
Key Data (Source: Company Reports)
Results Performance (Year Ended June 30, 2020)
Group’s revenue for the year ended 30 June 2020 stood at $302 million, as compared to $313.3 million in the previous year. Net profit after tax for the period stood at $90 million as against $100.6 million in the prior year, a decline of 10.5% (y-o-y). Group EBITDA (earnings before interest, tax, depreciation and amortisation) stood at $166.5 million, a decrease of 8.1% on the previous year. Solid performances, led by PrimePort Timaru, saw earnings from Subsidiary and Associate Companies’ earnings of $14.1 million, an increase of 18.5% on the previous year. Total trade for the year stood at 24.8 million tonnes as against 26.9 million tonnes in the previous year. However, container volumes for the year increased by 1.5% YoY to 1,251,741 TEUs. The results reflect the turbulent year caused by the outbreak of COVID-19 which had a wide-ranging impact on the business, including shipping cancellations, reduced cargo volumes, operational challenges and increased costs.
Exhibit 2: Income Statement
Key Data (Source: Company Reports)
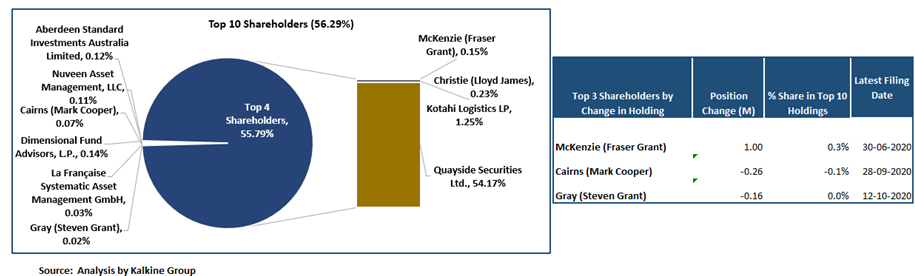
Top 10 Shareholders: The top 10 shareholders have been highlighted in the pie-chart provided below, which together forms around 56.29% of the total shareholding. Quayside Securities Ltd. and Kotahi Logistics LP are holding a maximum stake in the company at 54.17% and 1.25%, respectively.
Exhibit 3: Top 10 Shareholders
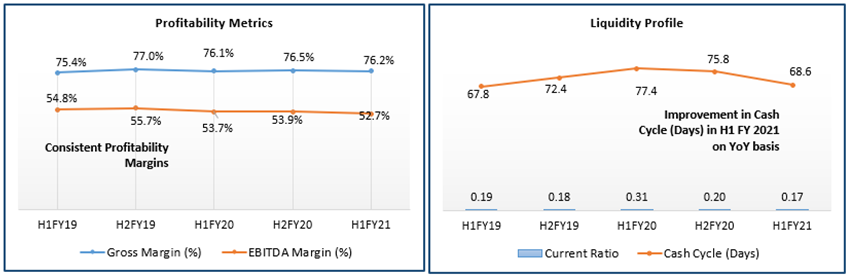
A Quick Look at Key Metrics: The company’s gross margin and EBITDA margin for H1FY21 stood at 76.2% and 52.7%, better than the industry median of 68.2% and 45.2%, respectively, implying the decent operating efficiency. The period also witnessed an improvement in cash cycle days but a slight deterioration in the current ratio.
Exhibit 4: Key Metrics
Source: Analysis by Kalkine Group
Outlook:
The company’s log exports in the six months to December 2020 decreased by 2.1%. However, there is strong demand from China as it recovers from Covid-19 and the outlook is positive for the second half of the financial year. The company managed to deliver an encouraging interim result, despite volatile cargo volumes and congestion issues experienced. The company completed the acquisition of Kotahi Logistics’ 50% holding in Timaru Container Terminal which is being operated by its subsidiary, Quality Marshalling. It also has long-term freight volume agreements in place with other key exporters such as Oji Fibre Solutions and Zespri International which give POT certainty to plan for the future and expand capacity as per requirements from customers. To address the issue of congestion, the company has applied for consent on its proposed berth extension. Further, the inland port is due to open in 2022.
The company’s balance sheet provides strength to tackle any challenges, therefore, its full-year earnings have been anticipated to be between $94 million and $100 million.
Key Risks:
The company’s performance is susceptible to natural disasters, climate change and economic slowdown which have the potential to adversely affect its top-line and bottom-line.
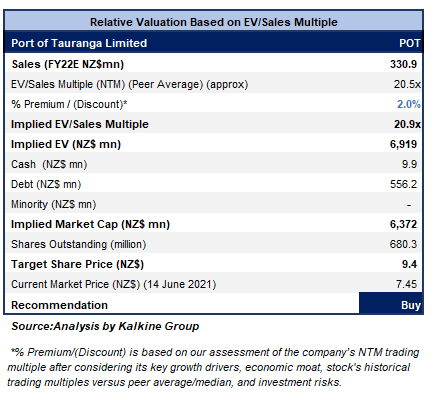
Valuation Methodology: EV/Sales Multiple Based Relative Valuation (Illustrative)
Technical Overview:
Weekly Chart –
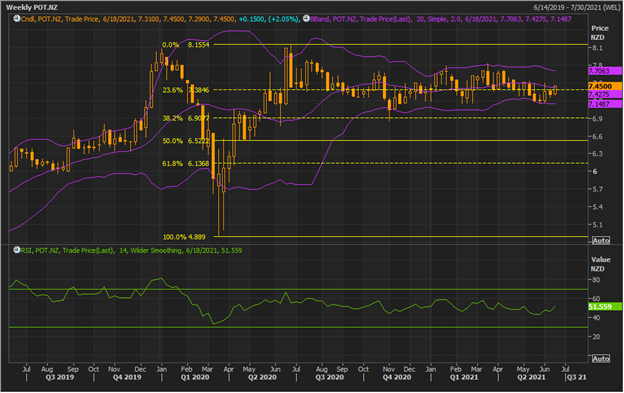
Source: REFINITIV
Note: Purple colour lines are Bollinger Bands® with the upper band suggesting overbought status while the lower band oversold status, and yellow lines are Fibonacci retracement lines which measure price rebound and backtrack. https://www.bollingerbands.com/
The stock has been in an uptrend. But for the 4-5 weeks, it had been giving close below the 23.6% retracement level of $7.38. However, on the first trading session of the ongoing week, it showed good resilience and closed at the peak price of $7.45 thereby demonstrating strength in an uptrend. The technical indicator RSI with a reading around 52 and a curve at the end pointing up, suggests strong bullish momentum for the stock.
Going forward, the stock may have resistance around the previous high of $8.15 whereas support could be around the lower Bollinger band of $7.15.
Stock Recommendation:
The company maintained its ordinary dividend for FY20 at 90% of the underlying net profit after tax. For FY20, the dividend stood at 12.4 cents per share whereas an interim dividend for H1FY21 stood at 6.0 cents, the same as the pcp. The stock increased by 0.41% in 1 month. It has made a 52-week low and high of $6.85 and $8.14, respectively.
Considering the aforesaid facts, we have valued the stock using EV/Sales multiple-based valuation (on an illustrative basis) and there are expectations that the stock price might witness an upside of low double-digit (in % terms). We have applied a slight premium to EV/Sales Multiple (NTM) (Peer Average) considering partnership with key customers as well as improvement in liquidity position which could help the company moving forward.
Hence, we give a “Buy” recommendation on the stock at the current market price of NZ$7.450 per share, up by 2.05% on 14th June 2021.
Note 1: The reference data in this report has been partly sourced from REFINITIV.
Note 2: Investment decisions should be made depending on the investors’ appetite on upside potential, risks, holding duration, and any previous holdings. Investors can consider exiting from the stock if the Target Price mentioned as per the analysis has been achieved and subject to the factors discussed above alongside support levels provided.
Technical Indicators Defined: -
Support: A level where-in the stock prices tend to find support if they are falling, and downtrend may take a pause backed by demand or buying interest.
Resistance: A level where-in the stock prices tend to find resistance when they are rising, and uptrend may take a pause due to profit booking or selling interest.
Disclaimer
Kalkine New Zealand Limited is authorised to provide class advice only. The information on this site does not take into account any of your investment objectives, financial situation or needs. Before you make a decision about whether to acquire a financial product, you should obtain the Product Disclosure Statement from the product issuer. You should consider the appropriateness of advice taking into account your own objectives, financial situation and needs and seek independent financial advice before making any financial decisions.
Past performance is not a reliable indicator of future performance.
 Please wait processing your request...