
This report is an updated version of the report published on 4 September 2025 at 11:34 AM AEST.
Section 1: Company Overview and Fundamental Insights
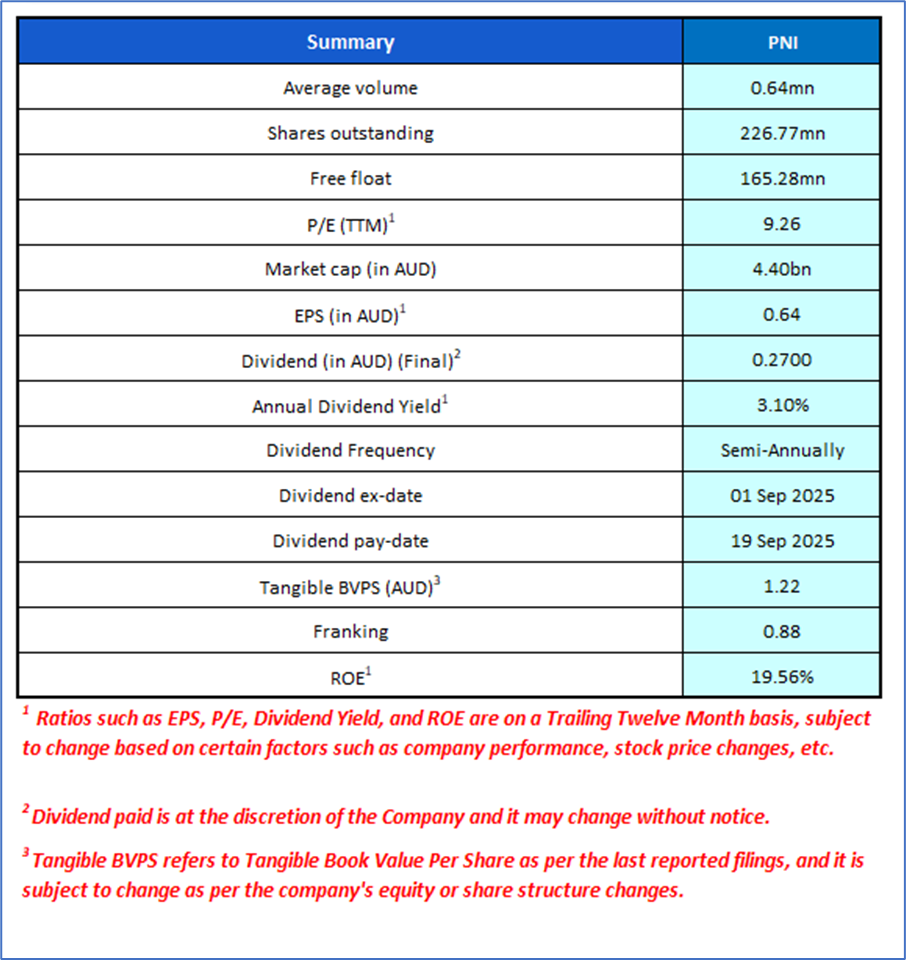
1.1 Company Overview: Pinnacle Investment Management Group Limited (ASX: PNI) is an Australia-based multi-affiliate investment management company. The firm focuses on growing a diverse family of investment management affiliates. Besides holding equity interests in these affiliates, Pinnacle provides seed funding, global institutional and retail distribution, and business support services including industrial grade middle office and infrastructure. The company's affiliates offer a variety of investment products across multiple asset classes, such as managed funds, actively managed exchange-traded funds (ETFs), listed investment companies/trusts, and collective investment trusts. Kalkine’s Resources Report covers the Investment Highlights, Management Insights, Key Financial Metrics, Risks, Technical Analysis along with the Valuation, Target Price, and Recommendation on the stock.
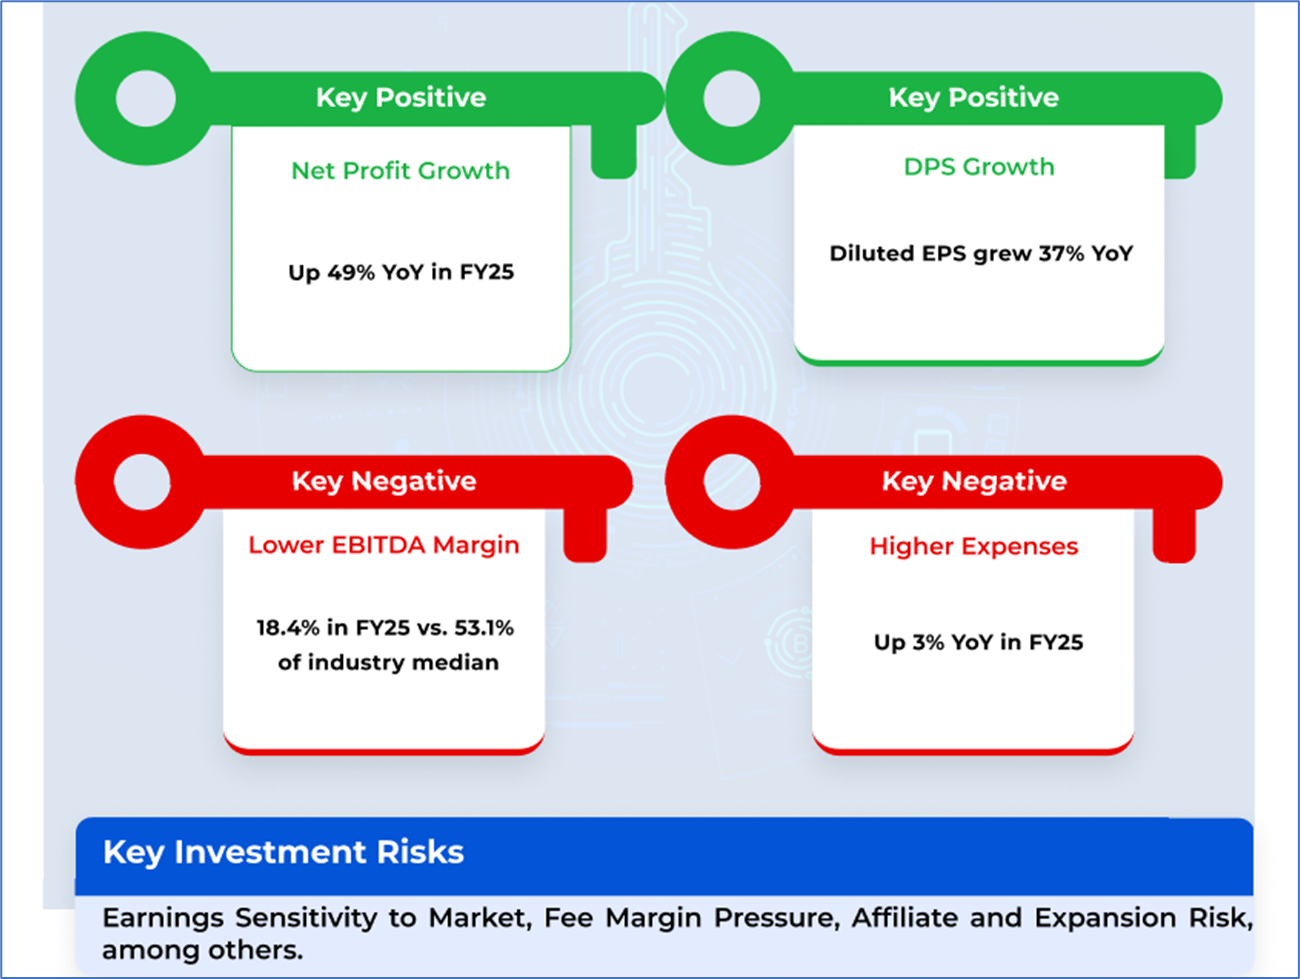
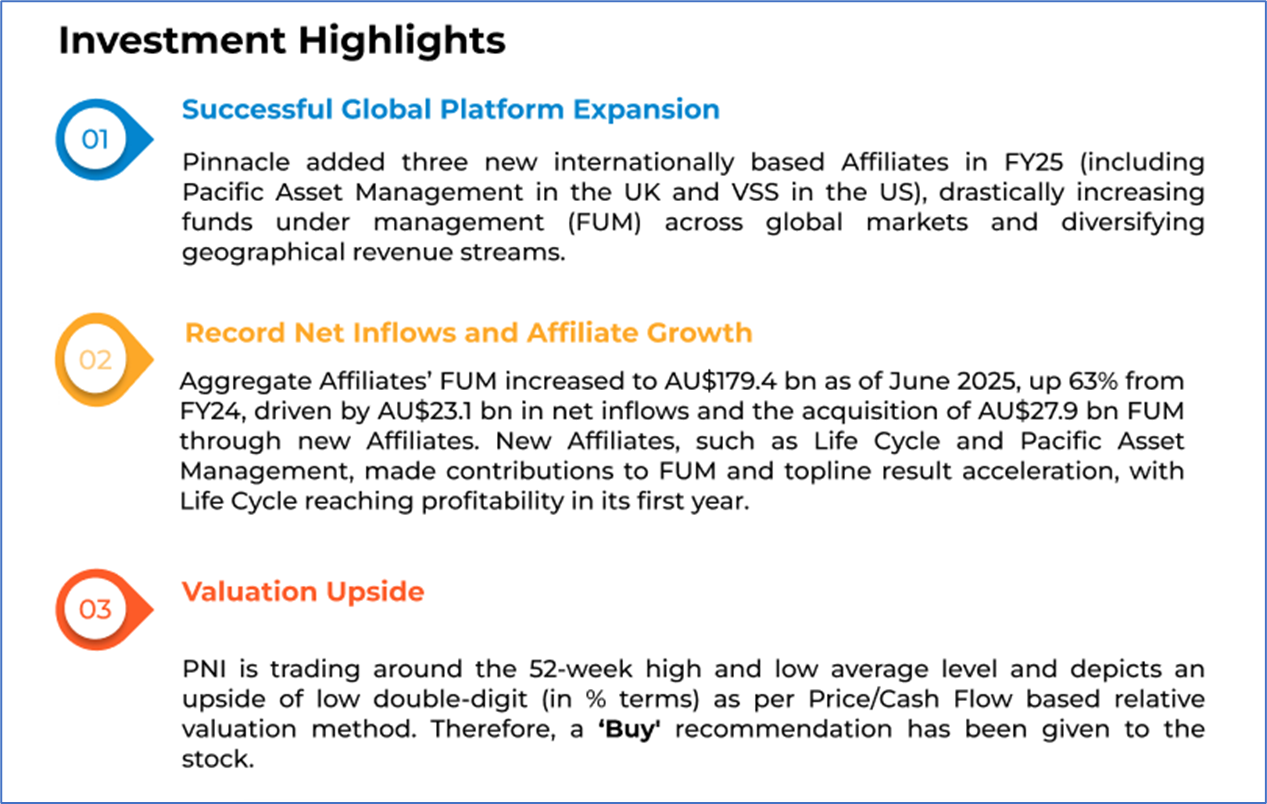
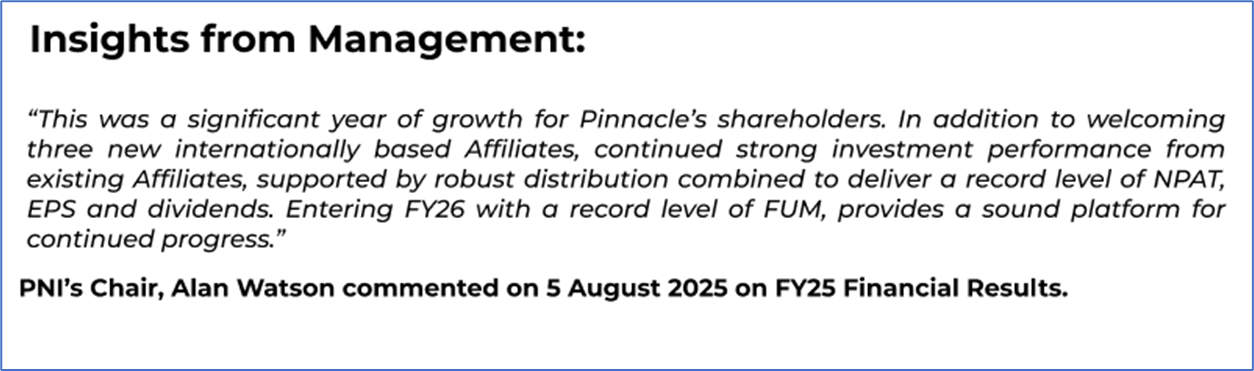
1.2 The Key Positives, Negatives, Investment Highlights, and Management Insights
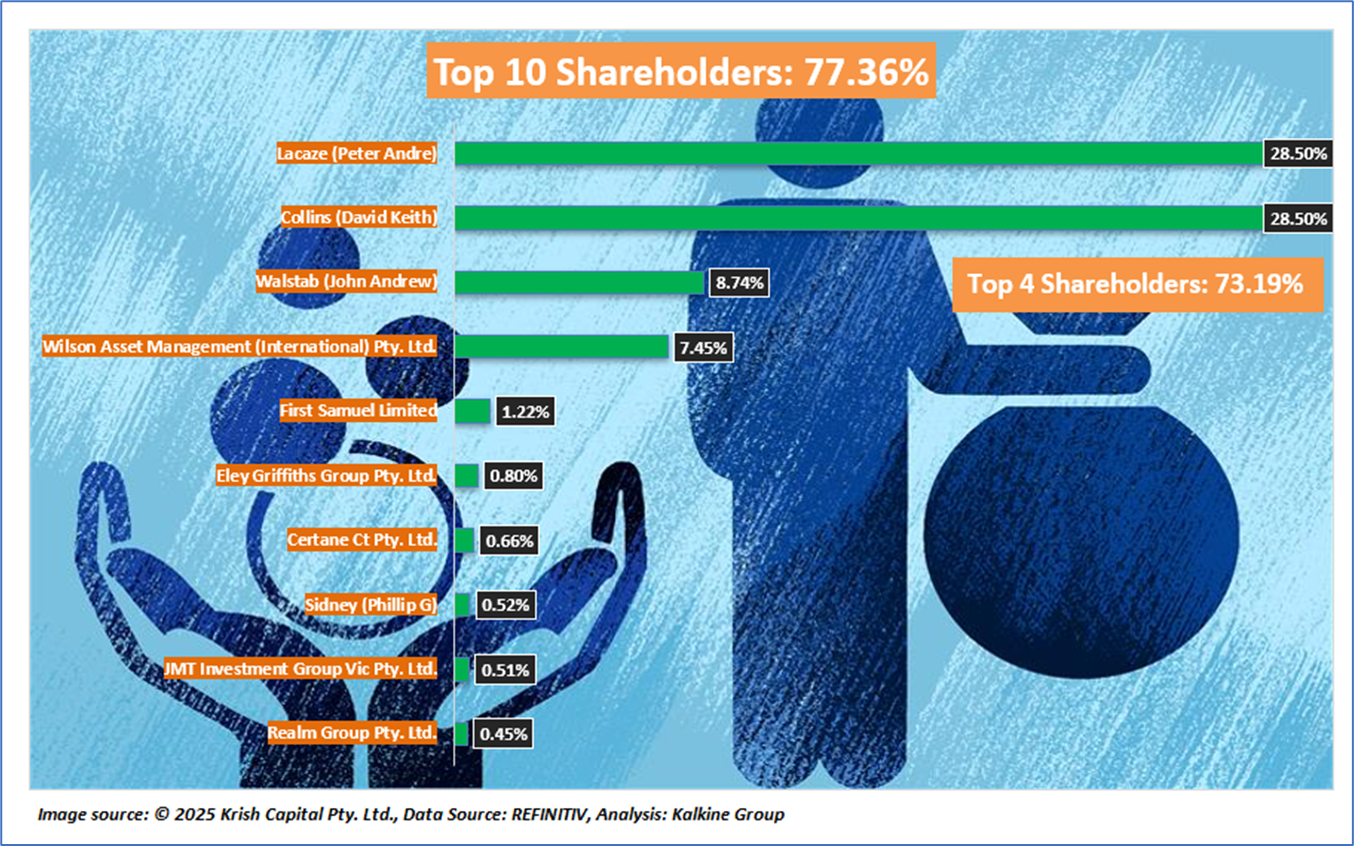
1.3 Top 10 Shareholders:
The top 10 shareholders together form 77.36% of the total shareholding. Lacaze (Peter Andre) and Collins (David Keith) hold maximum stakes in the company at 28.50% and 28.50%, respectively.
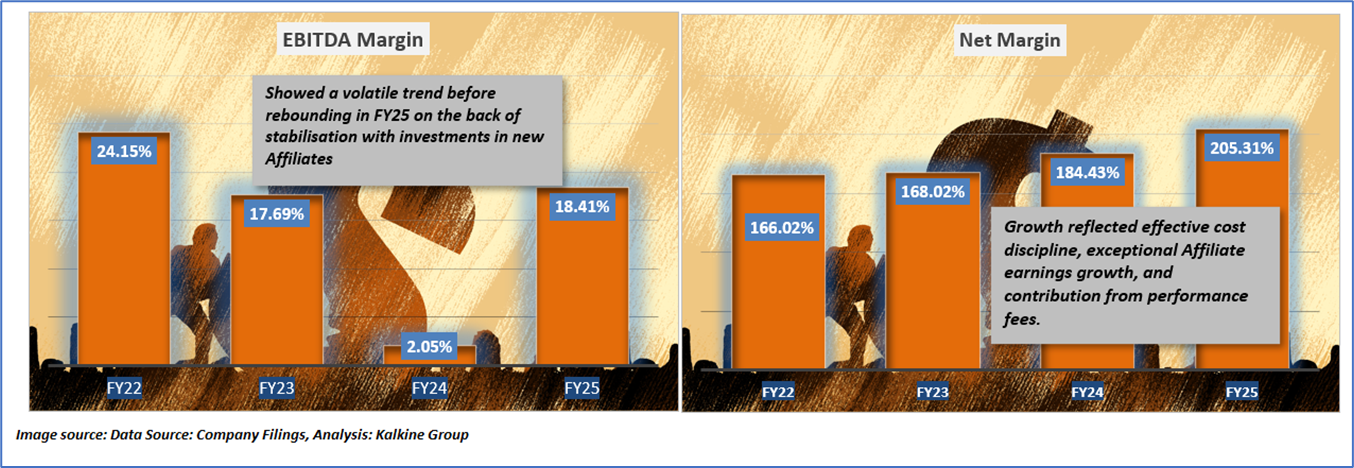
1.4 Key Metrics: The image below highlights that EBITDA margin showed a volatile trend stemmed from ongoing investments and the integration of new Affiliates, with FY25 benefiting from stabilisation and initial returns on these investments. Adjacently, net margin continued growth indicating strategic focus on diversification and scalable growth.
Section 2: Business Updates, Financial and Operational Highlights
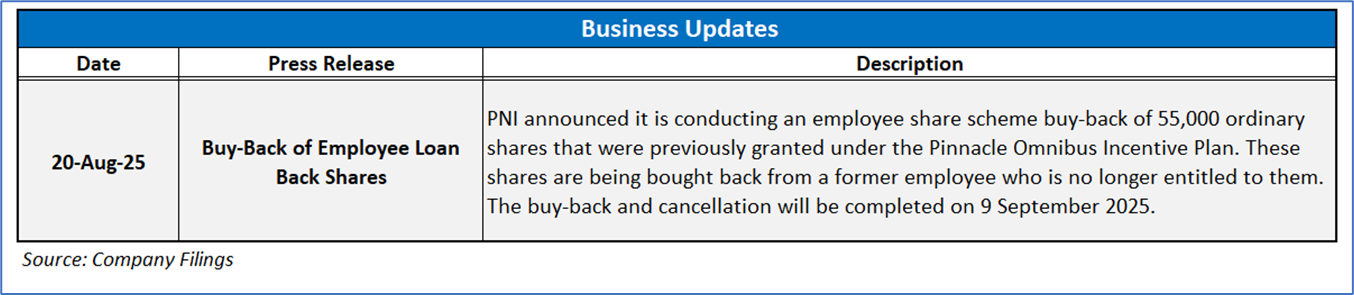
2.1 Recent Business Updates:
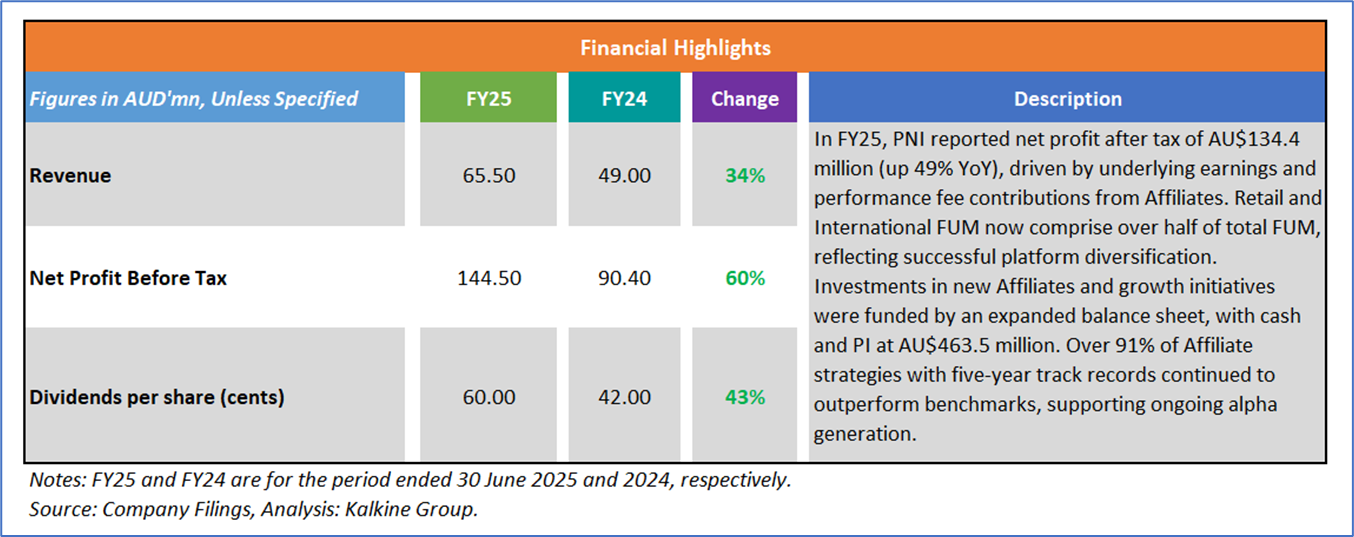
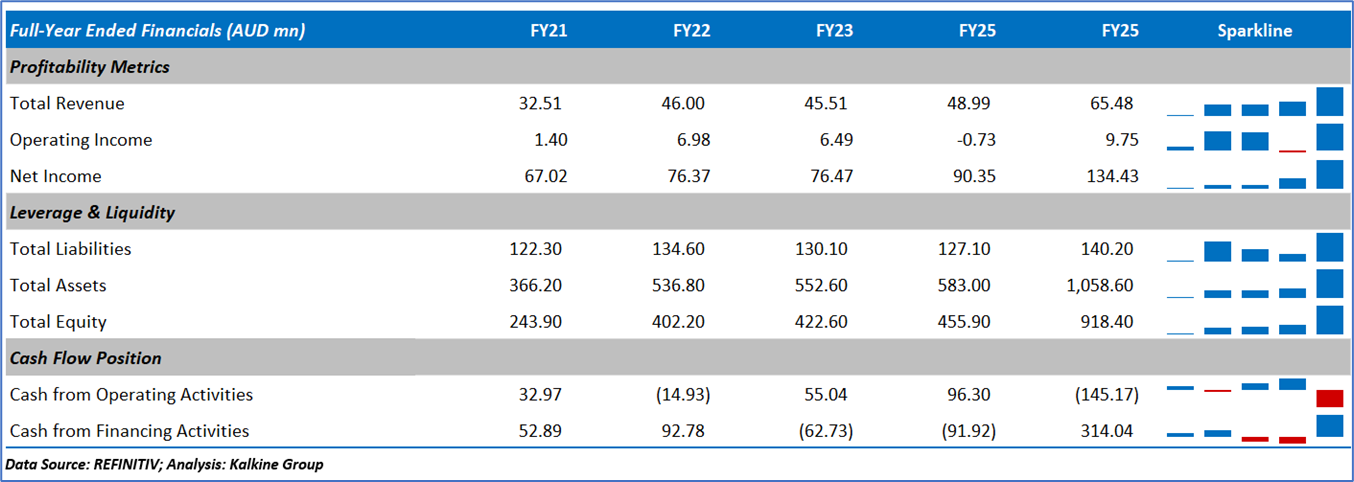
2.2 Financial Highlights: Below mentioned are some key financial highlights:
2.3 Historical Financial Trend
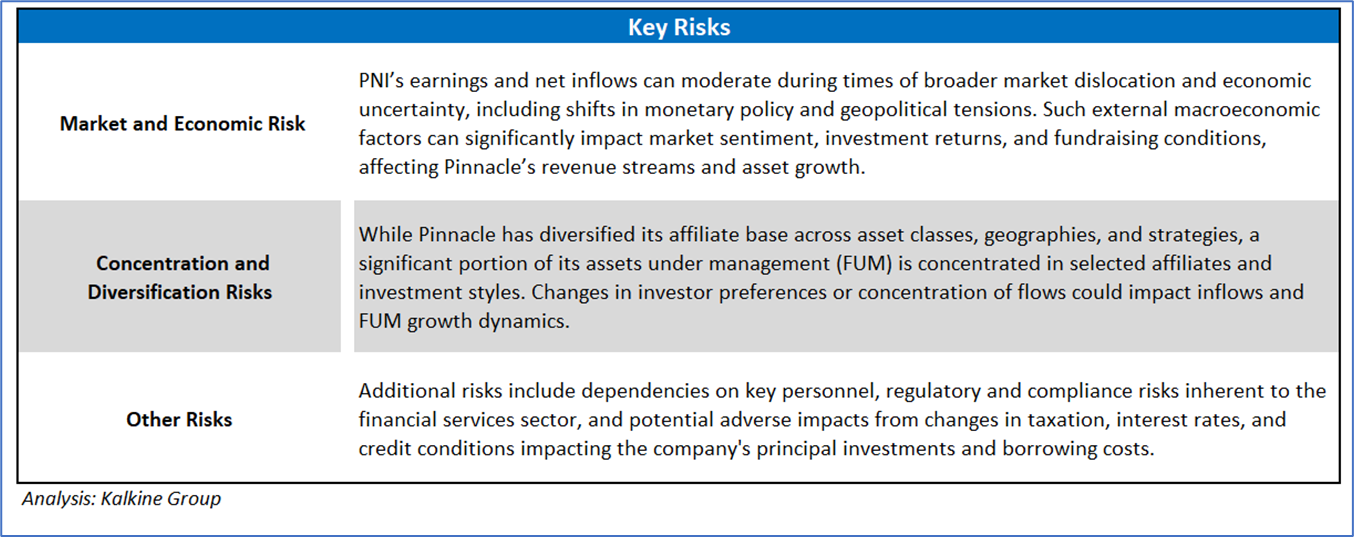
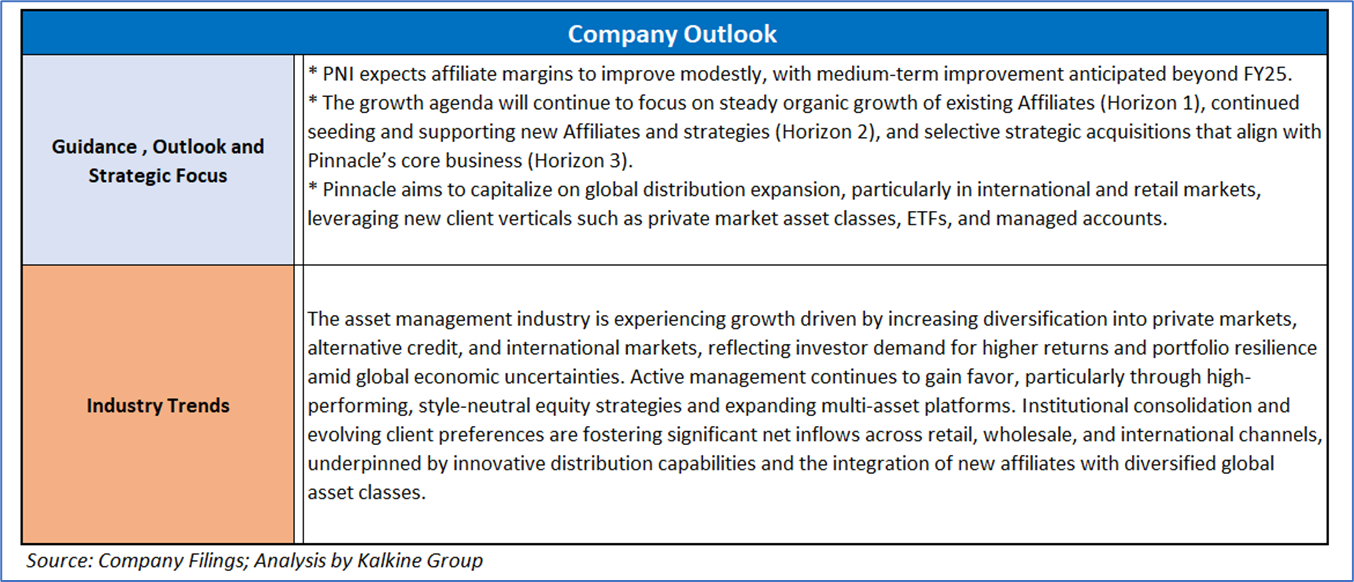
Section 3: Key Risks and Outlook:
Section 4: Stock Recommendation Summary
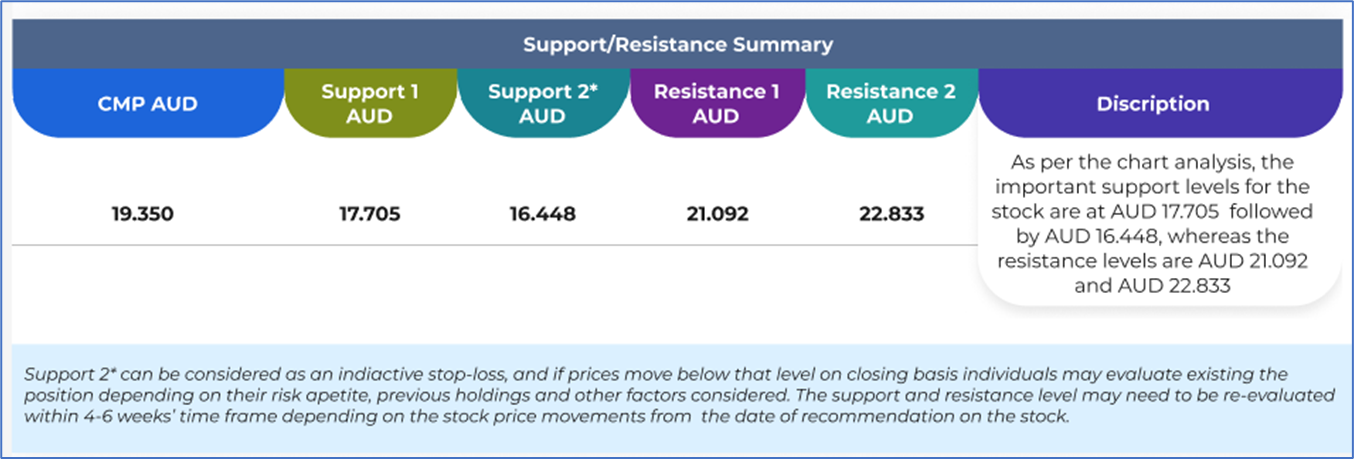
4.1 Price Performance and Technical Summary
The stock price has declined by approximately 11.97% over the past month; however, it has gained by around 17.27% over the last 1 year. The stock has a 52-week low and 52-week high of AUD 13.590 and AUD 27.110, respectively, and is currently trading around its 52-week high and low average level. PNI was previously covered in a report dated ‘8 July 2025’.
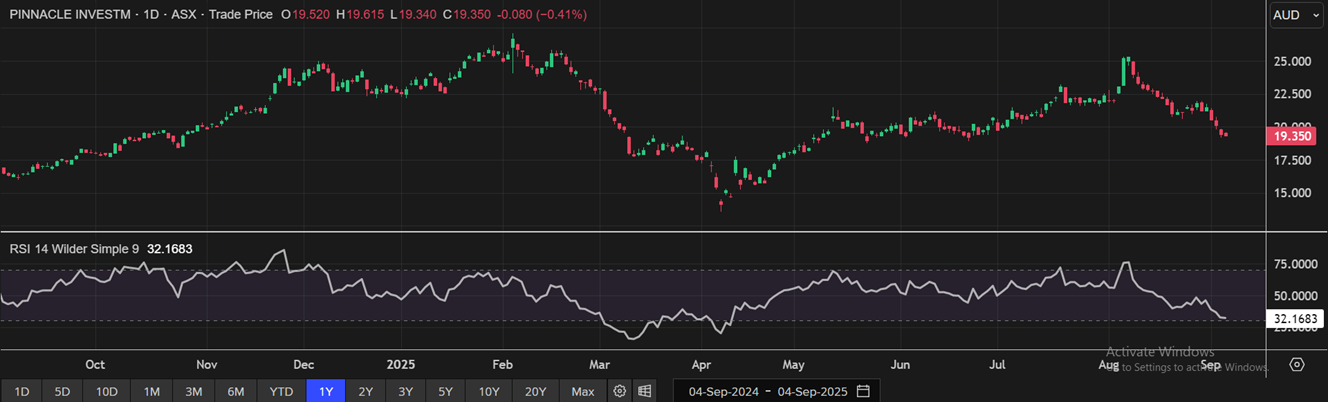
(Source: REFINITIV; Analysis by Kalkine Group)
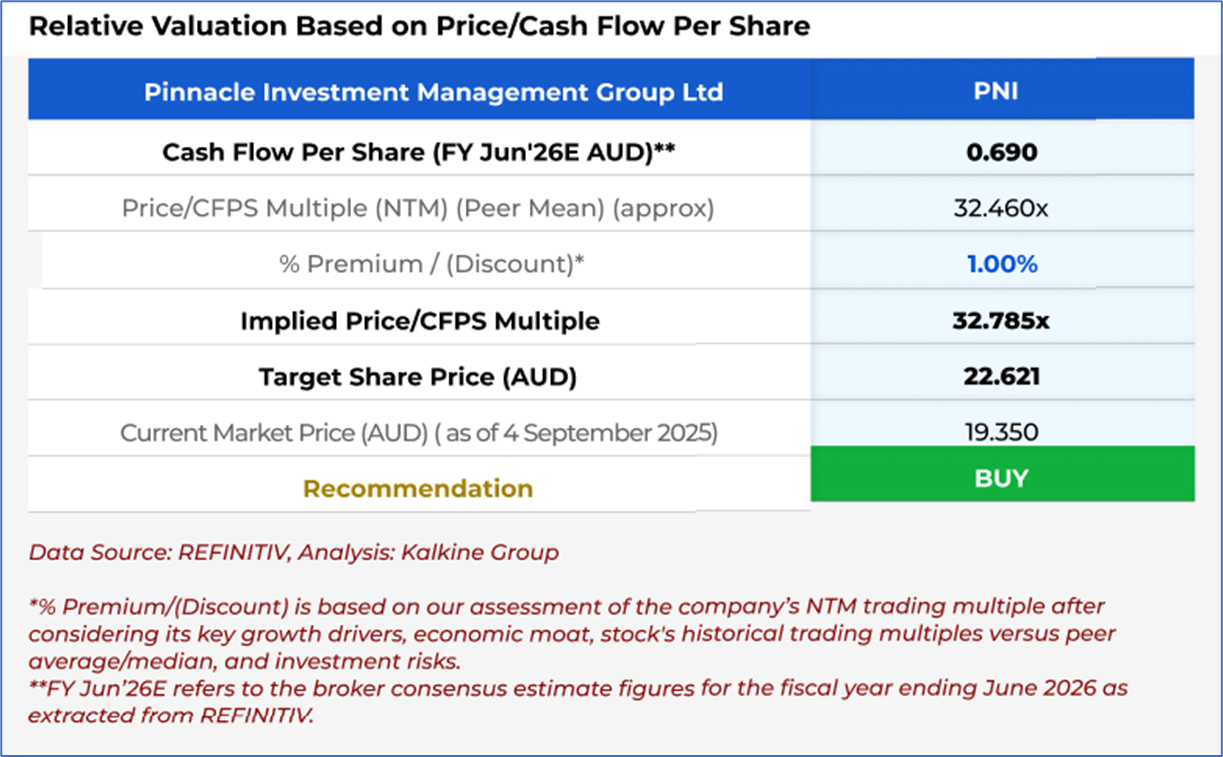
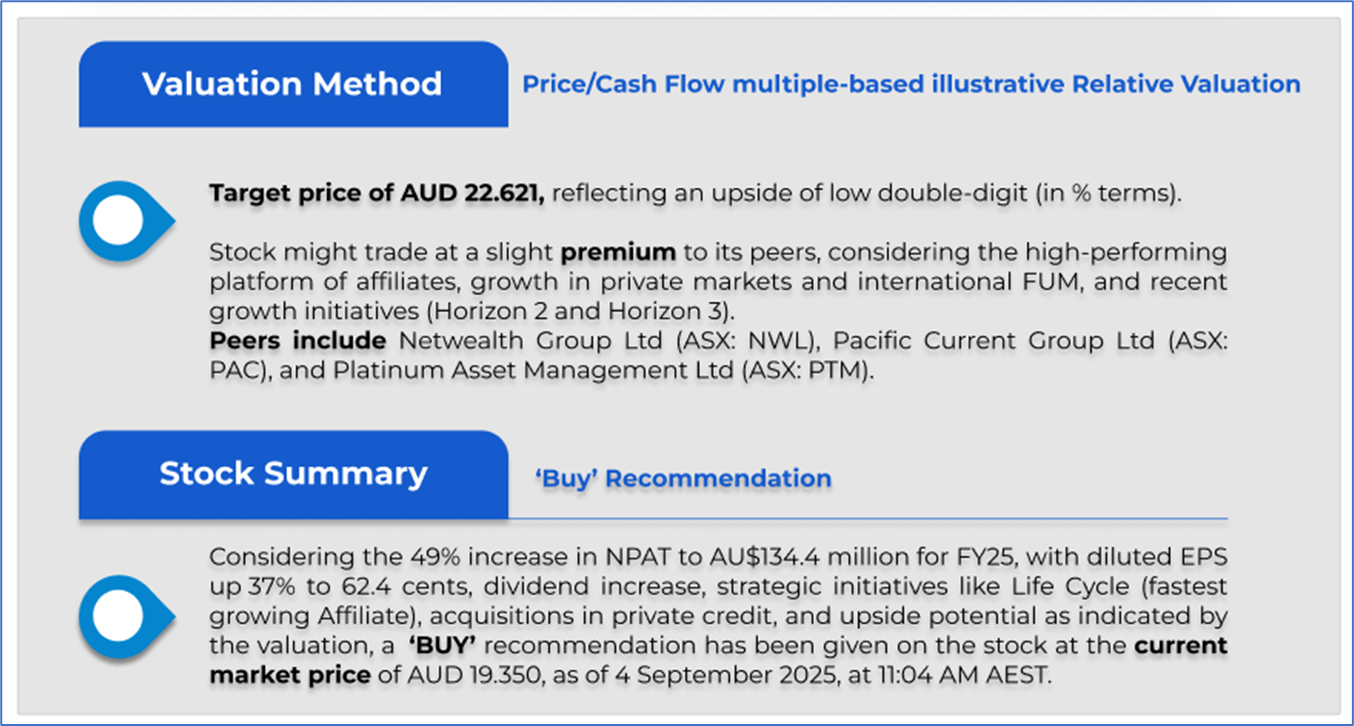
4.2 Fundamental Valuation
Valuation Methodology: Price/Cash Flow Multiple Based Relative Valuation (Illustrative)
Markets are trading in a highly volatile zone currently due to certain macro-economic issues and geopolitical tensions prevailing. Therefore, it is prudent to follow a cautious approach while investing.
Note 1: Past performance is neither an indicator nor a guarantee of future performance.
Note 2: The reference date for all price data, currency, technical indicators, support, and resistance levels is 4 September 2025. The reference data in this report has been partly sourced from REFINITIV.
Note 3: Investment decisions should be made depending on an individual's appetite for upside potential, risks, holding duration, and any previous holdings. An 'Exit' from the stock can be considered if the Target Price mentioned as per the Valuation and or the technical levels provided have been achieved and is subject to the factors discussed above.
Note 4: Kalkine reports are prepared based on the stock prices captured either from REFINITIV or Trading View. Typically, REFINITIV or Trading View may reflect stock prices with a delay which could be a lag of 25-30 minutes. There can be no assurance that future results or events will be consistent with the information provided in the report. The information is subject to change without any prior notice.
Note 5: Dividend Yield may vary as per the stock price movement.
Technical Indicators Defined: -
Support: A level at which the stock prices tend to find support if they are falling, and a downtrend may take a pause backed by demand or buying interest. Support 1 refers to the nearby support level for the stock and if the price breaches the level, then Support 2 may act as the crucial support level for the stock.
Resistance: A level at which the stock prices tend to find resistance when they are rising, and an uptrend may take a pause due to profit booking or selling interest. Resistance 1 refers to the nearby resistance level for the stock and if the price surpasses the level, then Resistance 2 may act as the crucial resistance level for the stock.
Stop-loss: It is a level to protect further losses in case of unfavourable movement in the stock prices.
Disclaimer This report has been issued by Kalkine New Zealand Limited (FSP691351) (NZBN:9429047678101) (“Kalkine”). Kalkine is a Financial Advice Provider (“FAP”) and is authorised by a Class 1 Financial Advice Provider Licence issued by Financial Markets Authority (“FMA”) to provide financial advice. Kalkine provides only general financial advice through its research reports following a person becoming a member. The reports contain buy/sell/hold and other recommendations in relation to equity securities, managed funds and other managed investment schemes and other financial advice products. The recommendations and opinions in this report and on Kalkine website do not take into account any of your investment objectives, financial situation or needs. Before you make a decision about whether to acquire a financial product, you should obtain the Product Disclosure Statement from the product issuer. You should consider the appropriateness of advice taking into account your own objectives, financial situation and needs and seek independent financial advice before making any financial decisions. If you act on the advice in the research reports, you may have to pay fees, expenses or other amounts (but not to Kalkine). Further information about the complaints and dispute resolution process, as well as information about Kalkine’s duties are available on Kalkine’s website. Please read our Financial Advice Provider (FAP) disclosure statement and Complaints Handling Guide, which are available on the website.
Past performance is not a reliable indicator of future performance.
 Please wait processing your request...