
This report is an updated version of the report published on 7 February 2024 at 2.50 PM AEDT.
Section 1: Company Overview and Fundamentals Insights
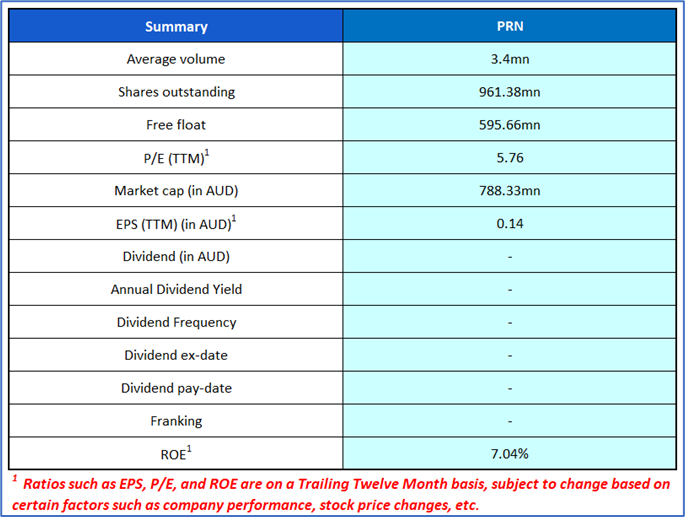
Company Overview: Perenti Limited (ASX: PRN) is an Australia-based diversified global mining services company with interests in contract mining, mining support services and future technology solutions. Its portfolio consists of sustainable, inter-related and value-adding mining services and technology-focused businesses. Kalkine’s Resources Report covers the Investment Highlights, Management Insights, Key Financial Metrics, Risks, Technical Analysis along with the Valuation, Target Price, and Recommendation on the stock.
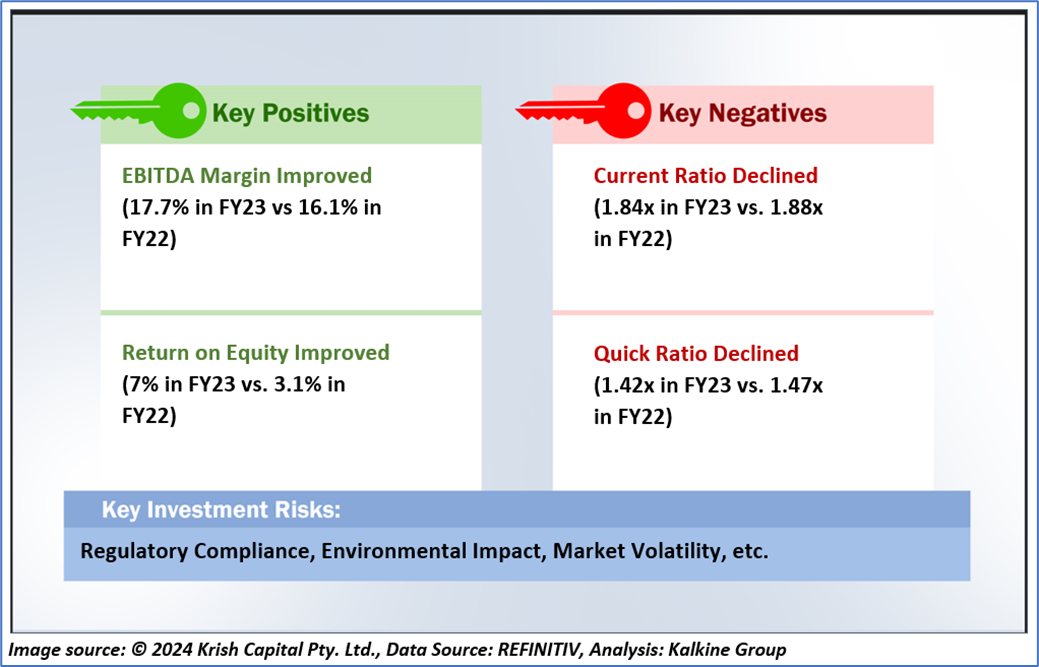
1.2 The Key Positives, Negatives, Investment Highlights, and Risks
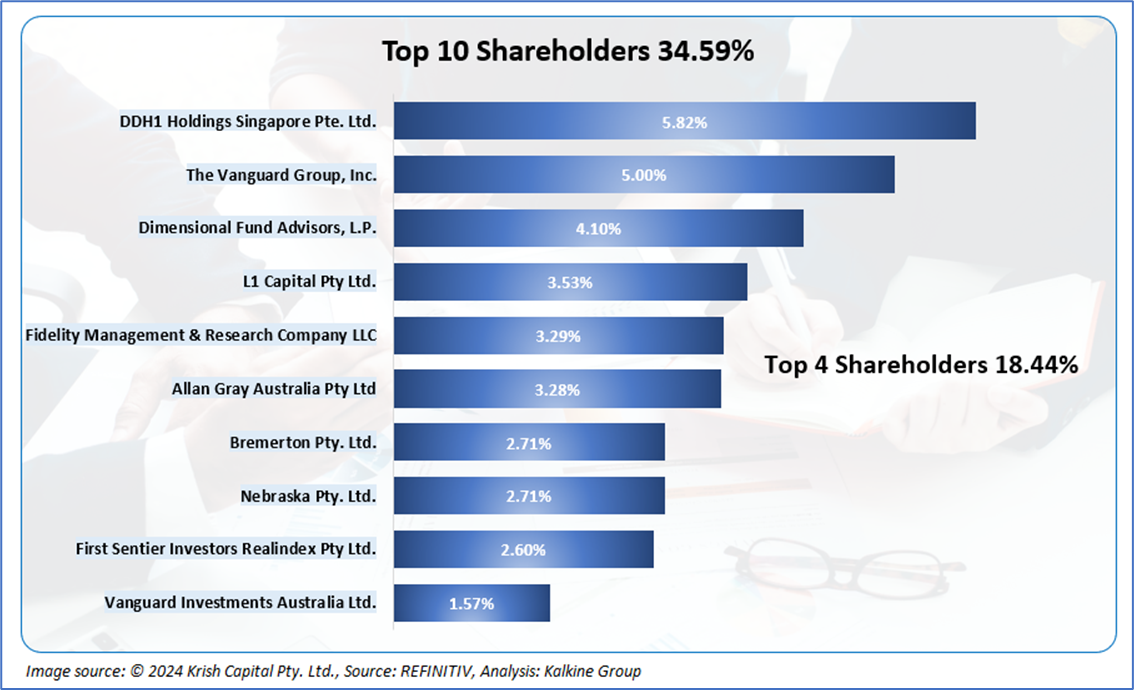
1.3 Top 10 Shareholders:
The top 10 shareholders together form ~34.59% of the total shareholding. DDH1 Holdings Singapore Pte. Ltd. and The Vanguard Group, Inc. hold maximum stakes in the company at ~5.82% and 5.00%, respectively.
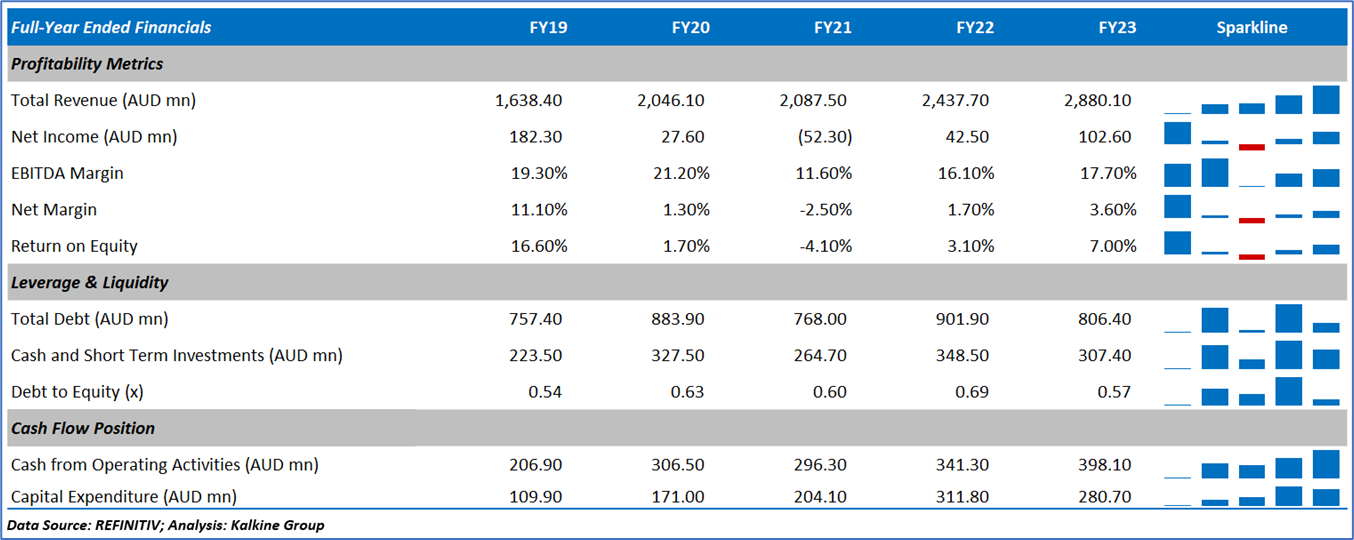
1.4 Key Metrics: In FY23, PRN’s EBITDA Margin improved to 17.7% in FY23 from 16.1% in FY22. Below is captured other metrics:
Section 2: Business Updates, Financial and Operational Highlights
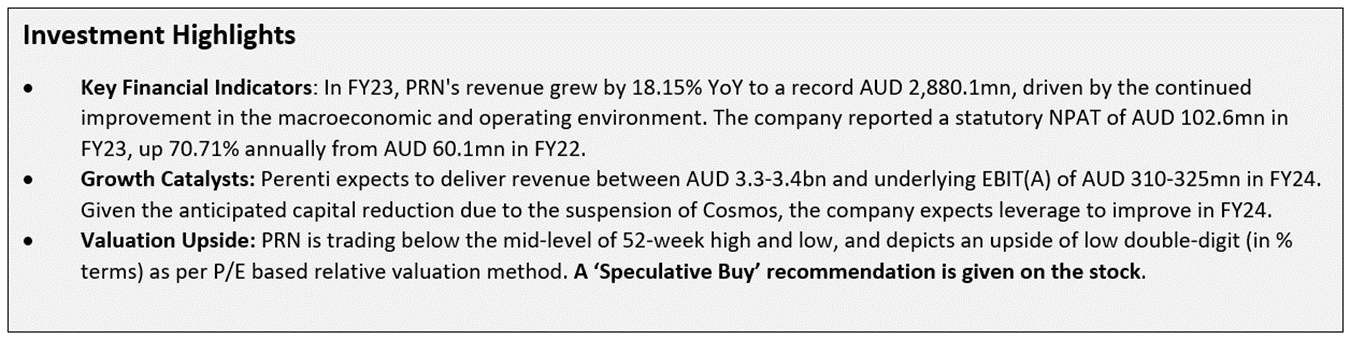
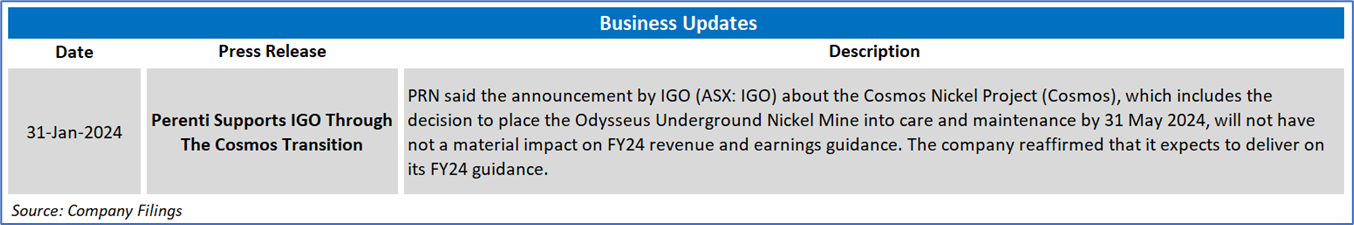
2.1 Recent Business Updates:
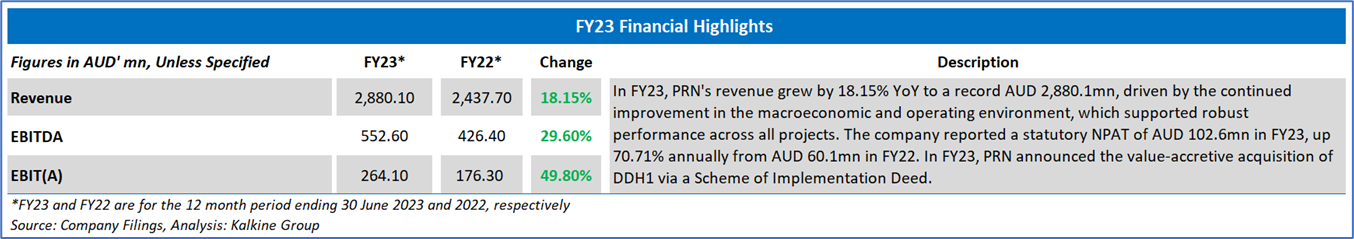
2.2 FY23 Results Highlights (for the period ended 30 September 2023): Below mentioned are some key financial highlights:
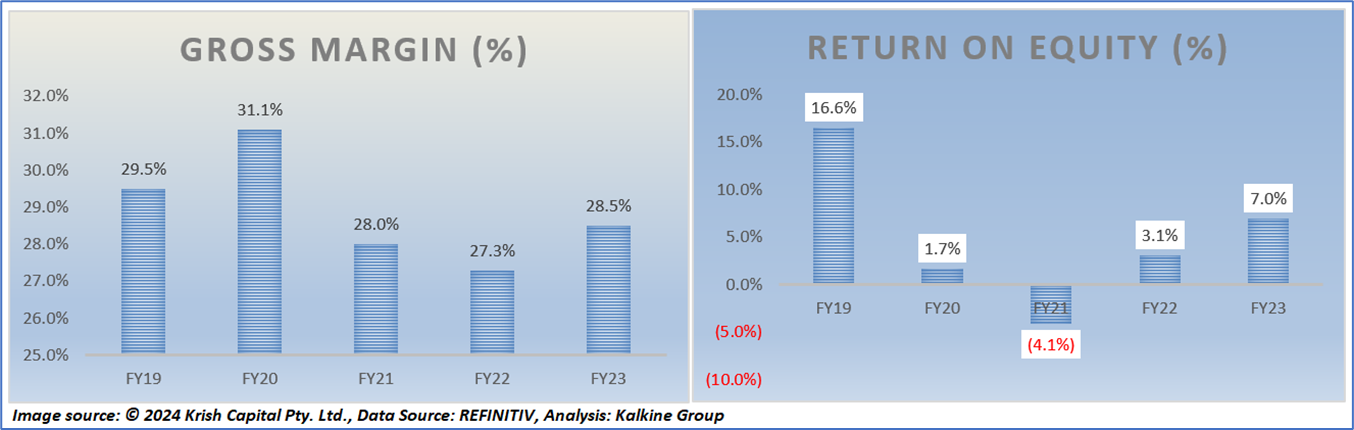
2.3 Historical Financial Trend
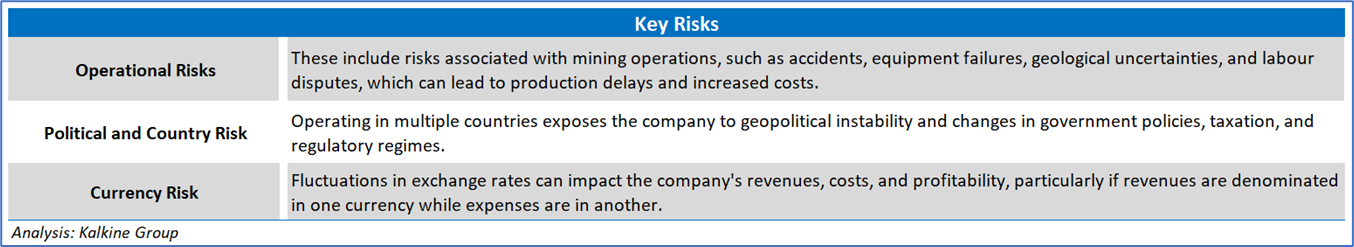
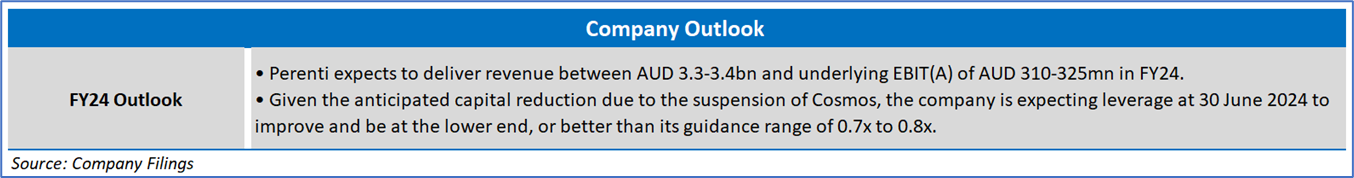
Section 3: Key Risks and Outlook:
Section 4: Stock Recommendation Summary
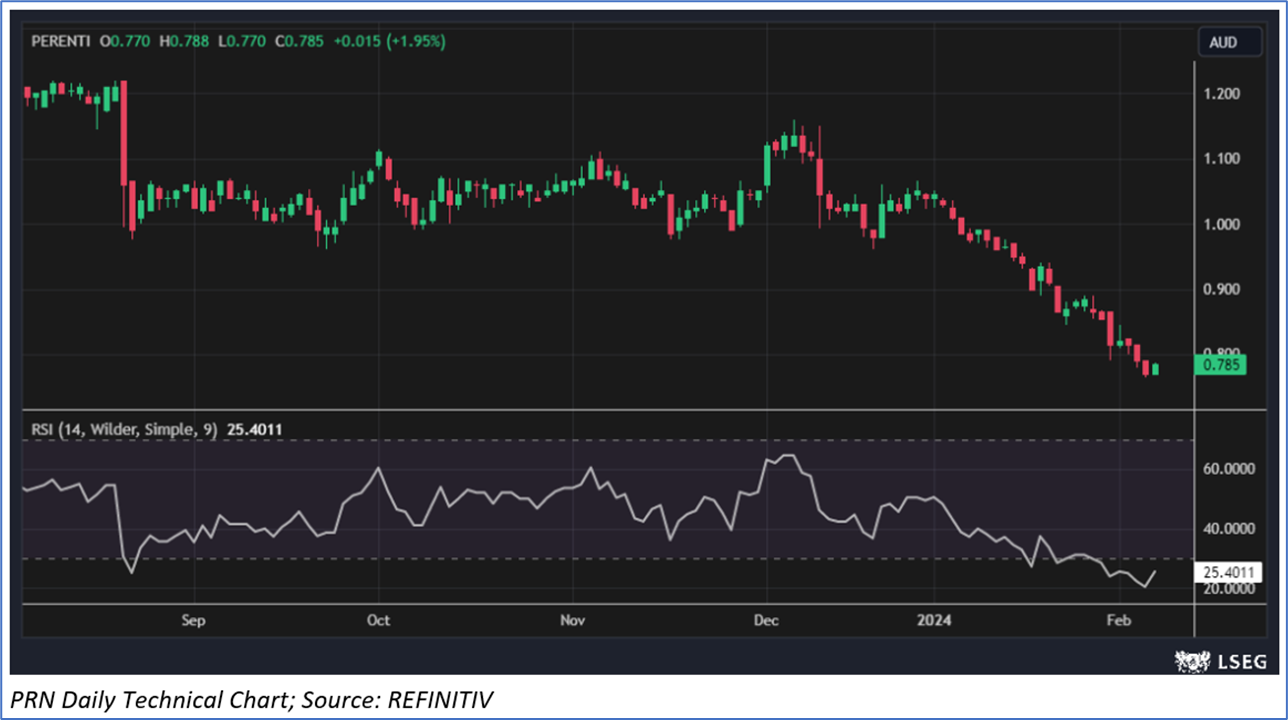
4.1 Price Performance and Technical Summary
The stock has declined by ~24.05% in the last 3 months, whereas over the last 1 year, the stock has witnessed a decline of ~33.74%. The stock has a 52-week low and 52-week high of AUD 0.765 and AUD 1.295, respectively, and is currently trading below the mid-point of its 52-week low and high. PRN was last covered in a report dated ‘6 December 2023’.

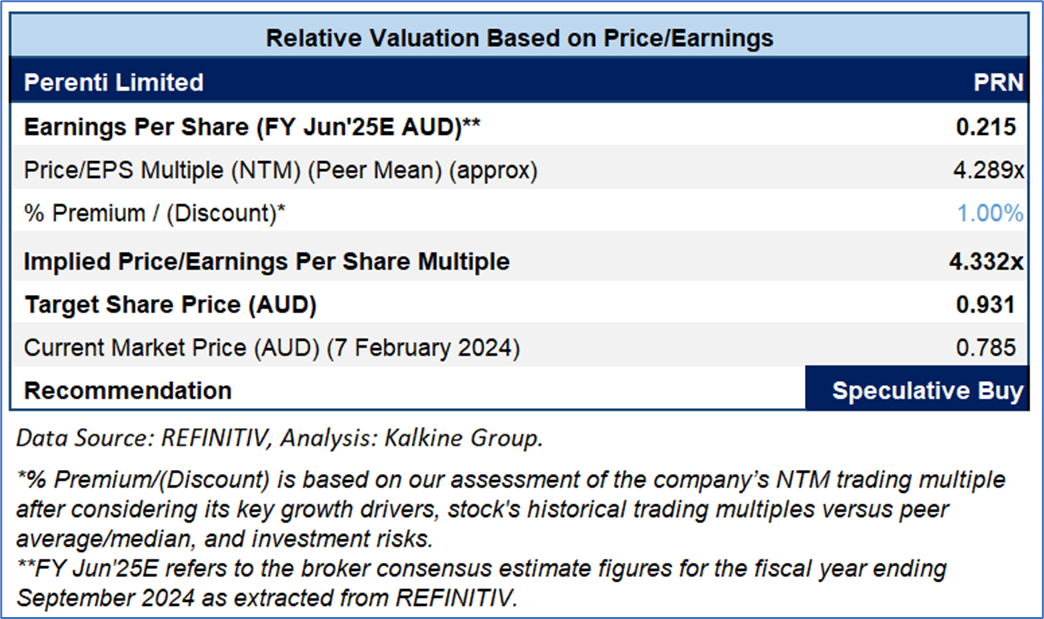
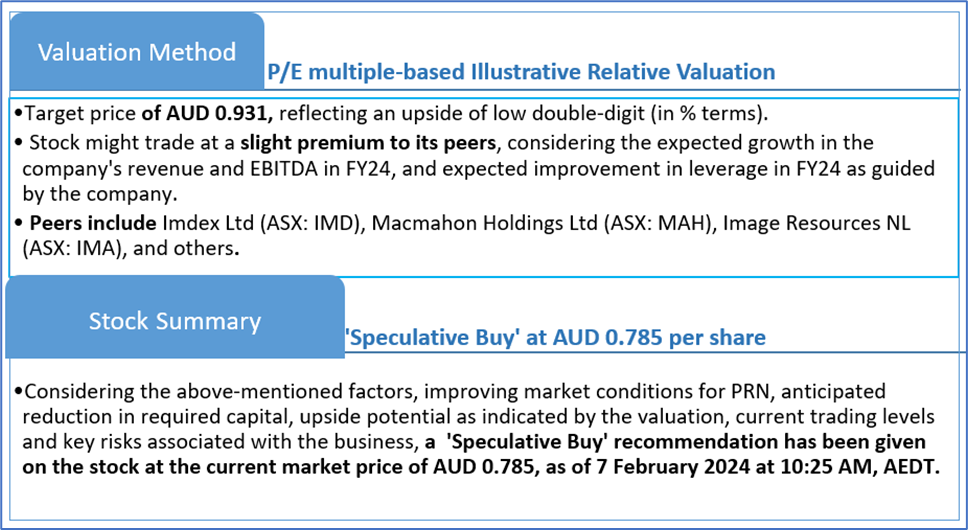
4.2 Fundamental Valuation
Valuation Methodology: P/E Multiple Based Relative Valuation (Illustrative)
Markets are trading in a highly volatile zone currently due to certain macro-economic issues and geopolitical tensions prevailing. Therefore, it is prudent to follow a cautious approach while investing.
Note 1: Past performance is neither an indicator nor a guarantee of future performance.
Note 2: The reference date for all price data, currency, technical indicators, support, and resistance levels is 7 February 2024. The reference data in this report has been partly sourced from REFINITIV.
Note 3: Investment decisions should be made depending on an individual's appetite for upside potential, risks, holding duration, and any previous holdings. An 'Exit' from the stock can be considered if the Target Price mentioned as per the Valuation and or the technical levels provided has been achieved and is subject to the factors discussed above.
Technical Indicators Defined: -
Support: A level at which the stock prices tend to find support if they are falling, and a downtrend may take a pause backed by demand or buying interest. Support 1 refers to the nearby support level for the stock and if the price breaches the level, then Support 2 may act as the crucial support level for the stock.
Resistance: A level at which the stock prices tend to find resistance when they are rising, and an uptrend may take a pause due to profit booking or selling interest. Resistance 1 refers to the nearby resistance level for the stock and if the price surpasses the level, then Resistance 2 may act as the crucial resistance level for the stock.
Stop-loss: It is a level to protect further losses in case of unfavourable movement in the stock prices.
Past performance is not a reliable indicator of future performance.
 Please wait processing your request...