Section 1: Company Overview and Fundamentals
Company Overview:
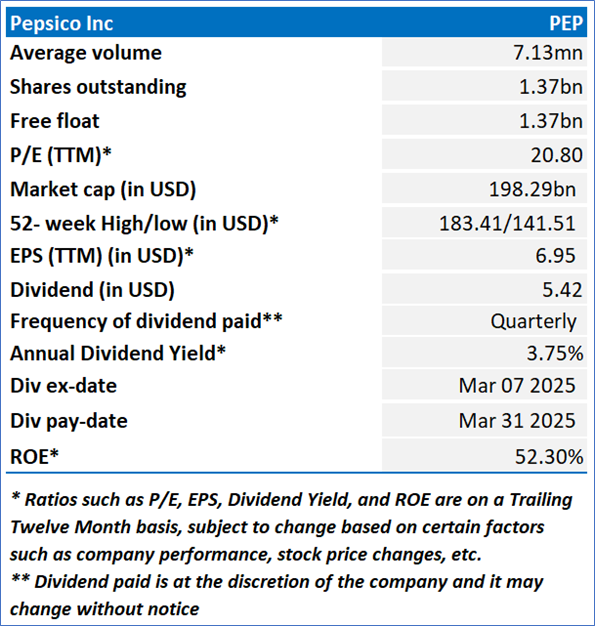
PepsiCo, Inc. (NASDAQ: PEP) is a beverage and convenient food company. The Company's segments include Frito-Lay North America, which includes its food businesses in the United States and Canada; Quaker Foods North America, which includes its food businesses, such as cereal, rice, pasta and other branded food, in the United States and Canada; PepsiCo Beverages North America, which includes its beverage businesses in the United States and Canada; Latin America, which includes its beverage and convenient food businesses in Latin America; Europe, which includes its beverage and convenient food businesses in Europe; Africa, Middle East and South Asia (AMESA), which includes all of its beverage and convenient food businesses in Africa, the Middle East and South Asia; and Asia Pacific, Australia and New Zealand and China Region (APAC), which includes all of its beverage and convenient food businesses in Asia Pacific, Australia and New Zealand, and China region. Its brands include Lays, Doritos and Cheetos.
Kalkine’s Low Carbon Research Report covers the Investment Highlights, Low Carbon Emission Initiatives, Key Financial Metrics, Risks, and Technical Analysis along with the Valuation, Target Price, and Recommendation on the stock.
Stock Performance:
1.2 Why do Low Carbon Emissions matter?
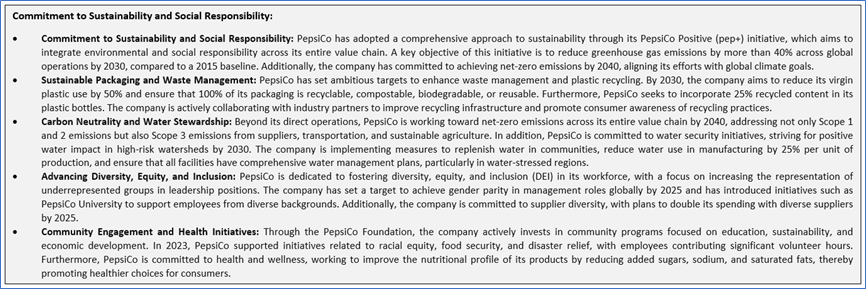
The shift toward a low-carbon economy is one of the most significant challenges of current time, spurred by the urgent need to combat climate change and reduce the environmental impact of corporate activities. This report covers the US-listed low-carbon emission company (NASDAQ: PEP), that is committed to sustainability and responsible environmental practices.
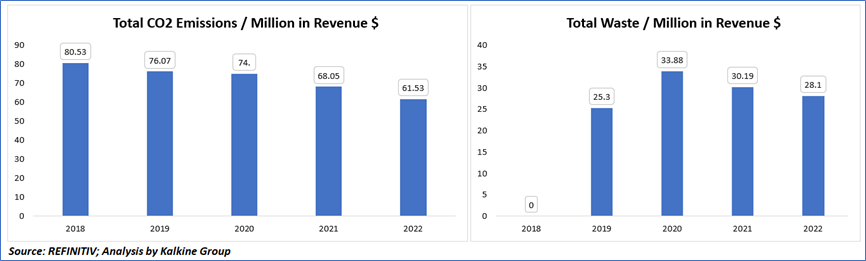
Carbon and Waste Management - Key Metrics
In terms of total waste, the figures indicate a rise from 25.3 in 2019 to a peak of 33.88 in 2020, before declining to 28.1 in 2022. This trend suggests an initial increase in waste generation relative to revenue, possibly due to operational scaling or inefficiencies, followed by a concerted effort towards waste reduction, aligning with broader sustainability goals. Conversely, the company's total CO2 emissions per million dollars in revenue have shown a consistent decrease from 80.53 in 2018 to 61.53 in 2022. This significant reduction underscores effective carbon management strategies, likely involving energy efficiency improvements, shifts towards renewable energy sources, or enhanced operational practices. The downward trajectory in emissions intensity is a positive indicator of the company's commitment to environmental stewardship and could reflect well on its corporate responsibility initiatives, potentially enhancing its reputation and aligning with global sustainability trends.
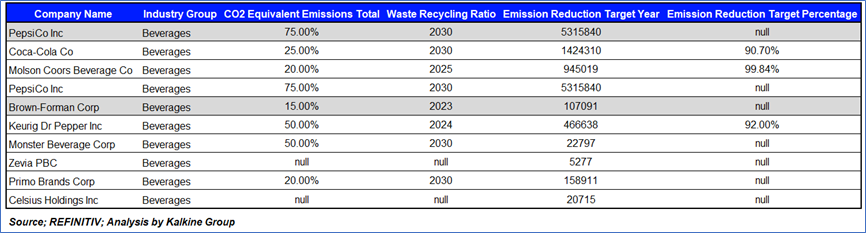
Peer Comparison: Carbon Emission and Waste Management Metrics
Based on data, companies within the Beverages industry group like PepsiCo Inc, Coca-Cola Co, and Molson Coors Beverage Co exhibit varying commitments to sustainability. PepsiCo and Coca-Cola both report a 25% CO2 equivalent emissions rate, aiming for significant waste recycling by 2030, with Coca-Cola targeting a 90.70% emission reduction by the same year. Molson Coors has a lower emissions rate at 20% and an ambitious 99.84% reduction target by 2025. Other companies like Brown-Forman and Keurig Dr Pepper show emissions rates of 15% and 50% respectively, with Keurig aiming for a 92% reduction by 2024. Monster Beverage and Primo Brands also report 50% and 20% emissions rates, while Zevia PBC and Celsius Holdings Inc have not disclosed emissions data. The variance in data availability and targets highlights different stages of sustainability commitment within the sector, with some companies leading in setting and pursuing aggressive environmental goals.
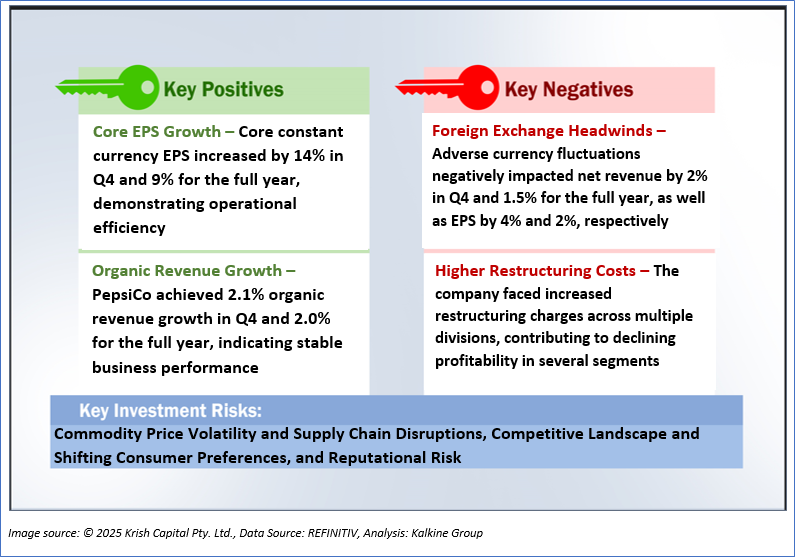
1.2 The Key Positives, Negatives, and Investment summary
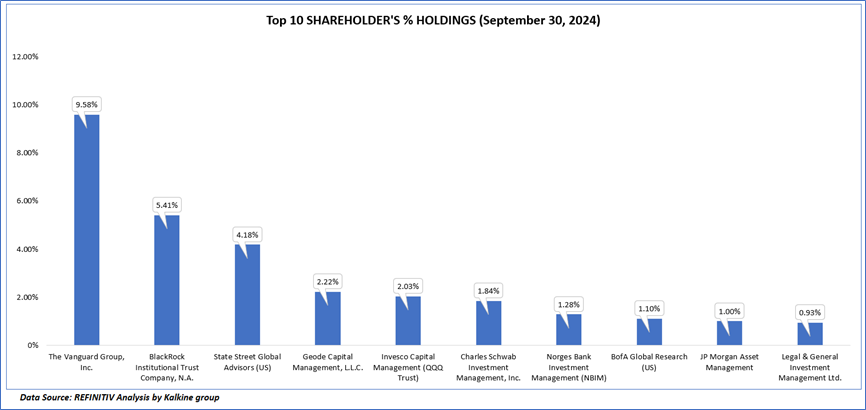
1.3 Top 10 shareholders:
The top 10 shareholders together form ~29.56% of the total shareholding, signifying diverse shareholding. The Vanguard Group, Inc. and BlackRock Institutional Trust Company, N.A. are the biggest shareholders, holding the maximum stake in the company at 9.58% and 5.41%, respectively.
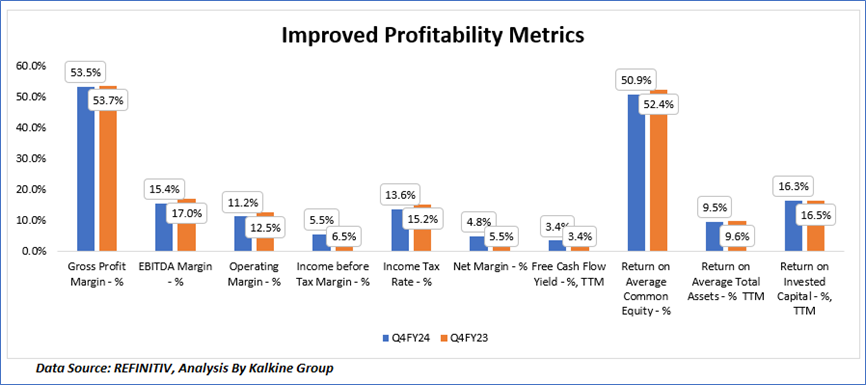
1.4 Key Metrics
In Q4FY24, PepsiCo, Inc. (PEP) maintained a Gross Profit Margin of 53.5% but saw declines in key profitability metrics compared to Q4FY23. The EBITDA Margin decreased from 17.0% to 15.4%, and the Operating Margin from 12.5% to 11.2%. Both Income Before Tax Margin and Net Margin fell, from 6.5% to 5.5% and 5.5% to 4.8% respectively. Despite a reduced Income Tax Rate from 15.2% to 13.6%, returns on equity, assets, and invested capital slightly declined, suggesting a need for strategic adjustments to enhance efficiency and profitability.
Section 2: Business Updates and Corporate Business Highlights
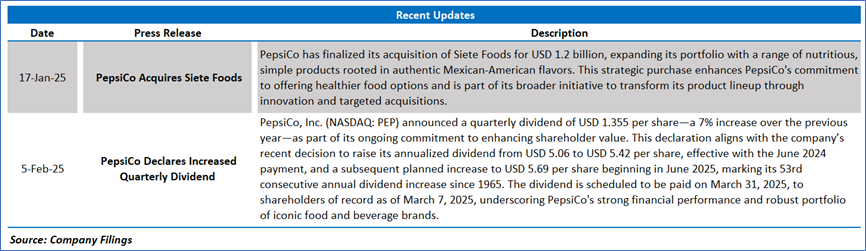
2.1 Recent Updates:
The below picture gives an overview of the recent updates:
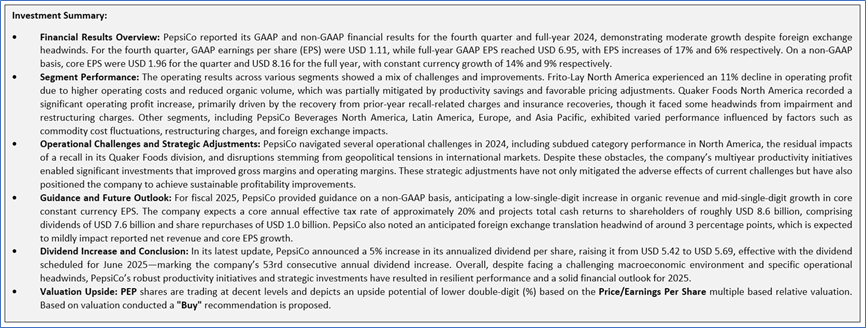
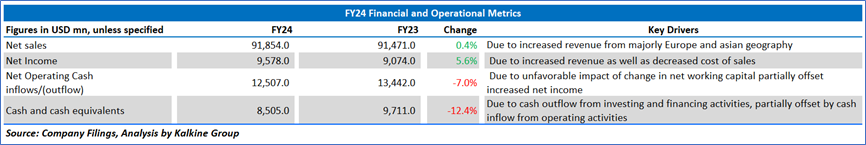
2.2 Insights of FY24:
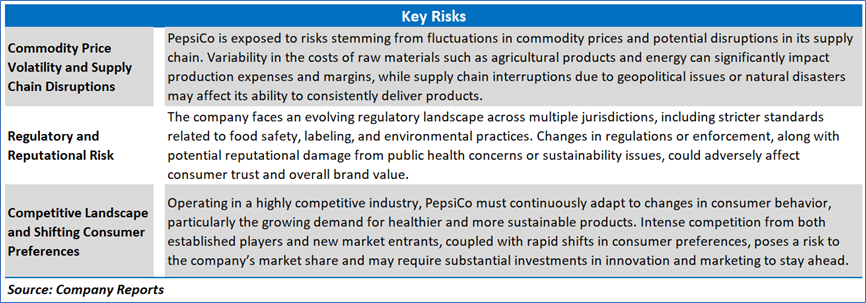
Section 3: Key Risks & Outlook
Section 4: Stock Recommendation Summary:
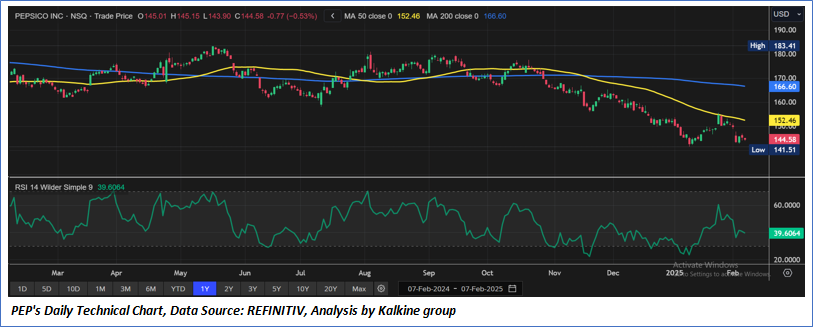
4.1 Price Performance and Technical Summary:
Stock Performance:
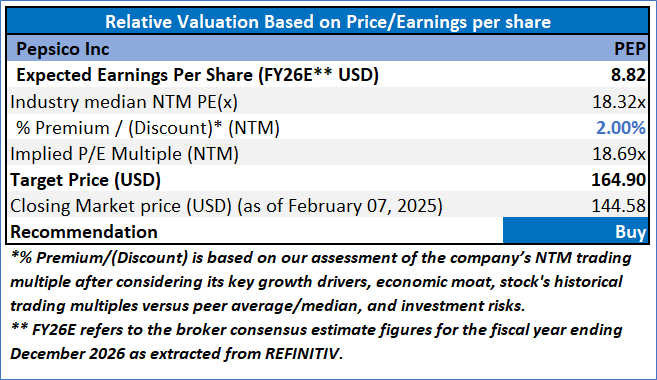
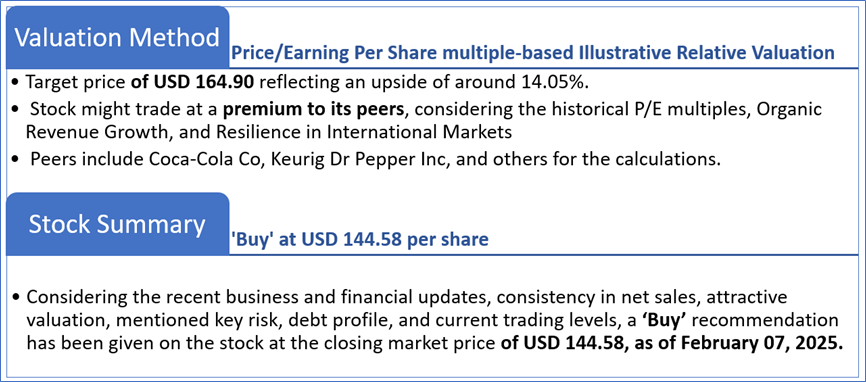
4.2 Fundamental Valuation
Valuation Methodology: Price/Earnings Per Share Multiple Based Relative Valuation
Markets are trading in a highly volatile zone currently due to certain macroeconomic issues and geopolitical tensions prevailing. Therefore, it is prudent to follow a cautious approach while investing.
Note 1: Past performance is not a reliable indicator of future performance.
Note 2: The reference date for all price data, currency, technical indicators, support, and resistance levels is February 07, 2025. The reference data in this report has been partly sourced from REFINITIV.
Note 3: Investment decisions should be made depending on an individual's appetite for upside potential, risks, holding duration, and any previous holdings. An 'Exit' from the stock can be considered if the Target Price mentioned as per the Valuation and or the technical levels provided has been achieved and is subject to the factors discussed above.
Note 4: The report publishing date is as per the Pacific Time Zone.
Technical Indicators Defined: -
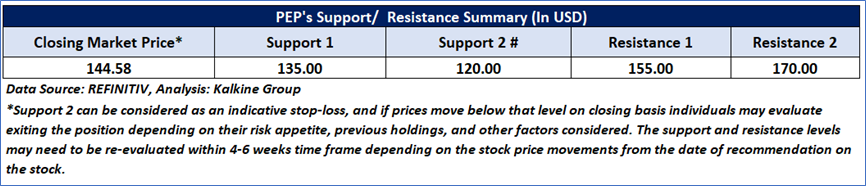
Support: A level at which the stock prices tend to find support if they are falling, and a downtrend may take a pause backed by demand or buying interest. Support 1 refers to the nearby support level for the stock and if the price breaches the level, then Support 2 may act as the crucial support level for the stock.
Resistance: A level at which the stock prices tend to find resistance when they are rising, and an uptrend may take a pause due to profit booking or selling interest. Resistance 1 refers to the nearby resistance level for the stock and if the price surpasses the level, then Resistance 2 may act as the crucial resistance level for the stock.
Stop-loss: It is a level to protect against further losses in case of unfavorable movement in the stock prices.
Disclaimer This report has been issued by Kalkine New Zealand Limited (FSP691351) (NZBN:9429047678101) (“Kalkine”). Kalkine is a Financial Advice Provider (“FAP”) and is authorised by a Class 1 Financial Advice Provider Licence issued by Financial Markets Authority (“FMA”) to provide financial advice. Kalkine provides only general financial advice through its research reports following a person becoming a member. The reports contain buy/sell/hold and other recommendations in relation to equity securities, managed funds and other managed investment schemes and other financial advice products. The recommendations and opinions in this report and on Kalkine website do not take into account any of your investment objectives, financial situation or needs. Before you make a decision about whether to acquire a financial product, you should obtain the Product Disclosure Statement from the product issuer. You should consider the appropriateness of advice taking into account your own objectives, financial situation and needs and seek independent financial advice before making any financial decisions. If you act on the advice in the research reports, you may have to pay fees, expenses or other amounts (but not to Kalkine). Further information about the complaints and dispute resolution process, as well as information about Kalkine’s duties are available on Kalkine’s website. Please read our Financial Advice Provider (FAP) disclosure statement and Complaints Handling Guide, which are available on the website.
Past performance is not a reliable indicator of future performance.
 Please wait processing your request...