
Section 1: Company Overview and Fundamentals
1.2 Company Overview:
Pacific Premier Bancorp, Inc. (NASDAQ: PPBI) is a bank holding company. The Company operates through its wholly owned subsidiary, Pacific Premier Bank (the Bank). The Bank provides banking products and services, including deposit accounts, digital banking, and treasury management services, to businesses, professionals, entrepreneurs, real estate investors, and nonprofit organizations.
Kalkine’s Dividend Income Report covers the Company Overview, Key positives & negatives, Investment summary, Key investment metrics, Top 10 shareholding, Business updates and insights into company recent financial results, Key Risks & Outlook, Price performance and technical summary, Target Price, and Recommendation on the stock.
Price Performance:

1.2 The Key Positives, Negatives, and Investment summary


1.3 Top 10 shareholders:
The top 10 shareholders together form ~55.06% of the total shareholding, signifying concentrated shareholding. BlackRock Institutional Trust Company, N.A., and The Vanguard Group, Inc. are the biggest shareholders, holding the maximum stake in the company at ~13.77% and ~11.61%, respectively.

Dividend payments with impressive dividend yield:
On November 4, 2024, Pacific Premier Bancorp, Inc. (PPBI) announced a cash dividend of USD 0.32 per share on its common stock, payable on November 12, 2024, to stockholders of record as of November 4, 2024. As of February 12, 2025, PPBI's dividend yield stands at 5.16%, showcasing its commitment to providing substantial returns to its shareholders. Historically, PPBI has upheld a consistent dividend policy, with a fiscal year (FY) dividend yield of 5.16% and a five-year average yield of 3.98%. However, PPBI's coverage ratio for the FY is -8.80%, contrasting with its five-year average of 68.33%, indicating recent challenges in covering dividend payments with earnings. Despite this, PPBI has shown a positive trend in dividend growth, with a five-year DPS growth of 14.87% and a DPS estimate growth of 5.26%, reflecting the company's efforts to increase shareholder value over time.

1.5 Key Metrics
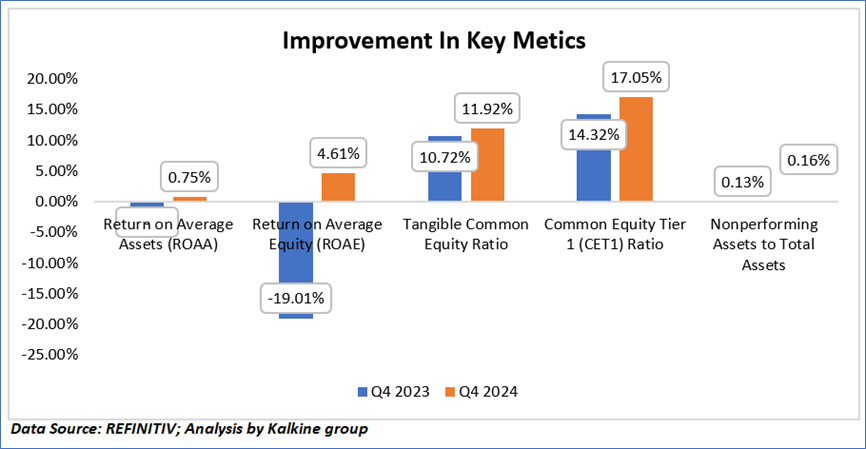
The financial performance indicators have demonstrated notable improvements over the past year, indicating a stronger financial position and enhanced profitability. The Return on Average Assets (ROAA) turned positive, rising from -2.76% in Q4 2023 to 0.75% in Q4 2024, suggesting improved asset utilization and overall operational efficiency. Similarly, the Return on Average Equity (ROAE) saw a substantial recovery from -19.01% to 4.61%, reflecting improved profitability and better returns for shareholders.
The Tangible Common Equity Ratio increased from 10.72% to 11.92%, signaling a stronger capital base and a more resilient financial structure. Additionally, the Common Equity Tier 1 (CET1) Ratio, a critical measure of a bank’s financial strength, rose from 14.32% to 17.05%, highlighting an improvement in the institution’s ability to absorb losses and maintain regulatory compliance.
However, the Nonperforming Assets to Total Assets ratio saw a slight increase from 0.13% to 0.16%, suggesting a minor deterioration in asset quality. While this uptick may indicate a slight rise in nonperforming loans, its impact appears to be minimal relative to the overall financial improvements.
Section 2: Business Updates and Financial Highlights
2.1 Recent Updates:
The below picture gives an overview of the recent updates:

2.2 Insights of FY24:

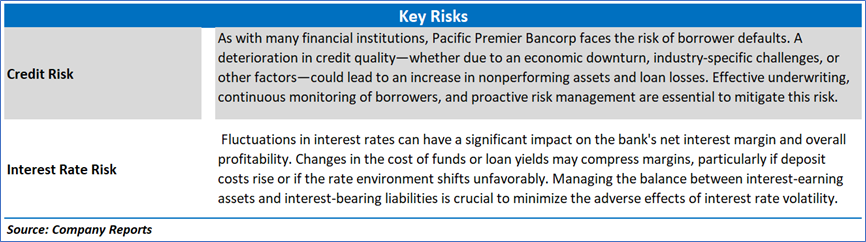
Section 3: Key Risks and Outlook:
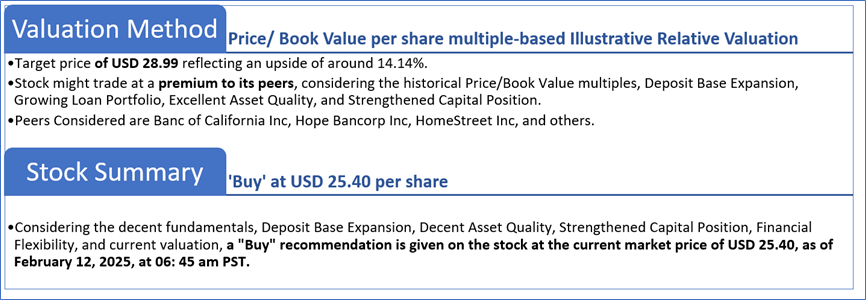
Section 4: Stock Recommendation Summary:
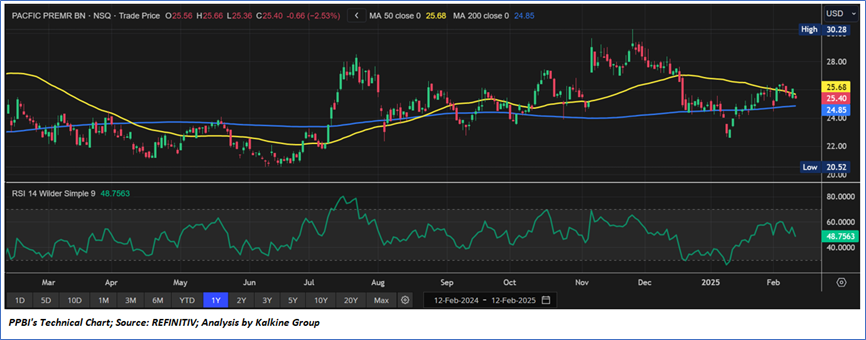
4.1 Technical Summary:
Price Performance:

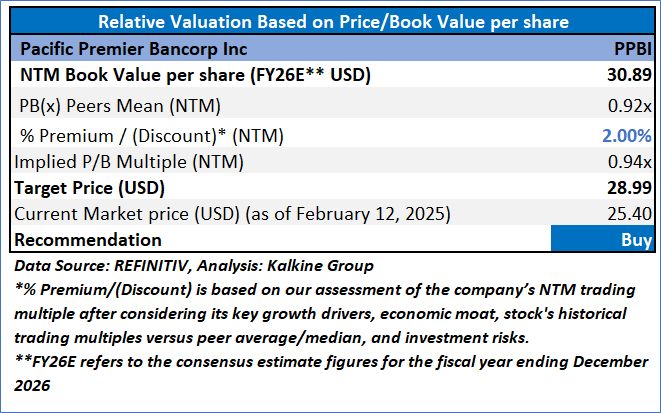
4.2 Fundamental Valuation
Valuation Methodology: Price/Book Value Per Share Multiple Based Relative Valuation
Markets are trading in a highly volatile zone currently due to certain macroeconomic issues and geopolitical tensions prevailing. Therefore, it is prudent to follow a cautious approach while investing.
Note 1: Past performance is not a reliable indicator of future performance.
Note 2: The reference date for all price data, currency, technical indicators, support, and resistance levels is February 12, 2025. The reference data in this report has been partly sourced from REFINITIV.
Note 3: Investment decisions should be made depending on an individual's appetite for upside potential, risks, holding duration, and any previous holdings. An 'Exit' from the stock can be considered if the Target Price mentioned as per the Valuation and or the technical levels provided has been achieved and is subject to the factors discussed above.
Note 4: The report publishing date is as per the Pacific Time Zone.
Technical Indicators Defined: -
Support: A level at which the stock prices tend to find support if they are falling, and a downtrend may take a pause backed by demand or buying interest. Support 1 refers to the nearby support level for the stock and if the price breaches the level, then Support 2 may act as the crucial support level for the stock.
Resistance: A level at which the stock prices tend to find resistance when they are rising, and an uptrend may take a pause due to profit booking or selling interest. Resistance 1 refers to the nearby resistance level for the stock and if the price surpasses the level, then Resistance 2 may act as the crucial resistance level for the stock.
Stop-loss: It is a level to protect against further losses in case of unfavorable movement in the stock prices.
Disclaimer This report has been issued by Kalkine New Zealand Limited (FSP691351) (NZBN:9429047678101) (“Kalkine”). Kalkine is a Financial Advice Provider (“FAP”) and is authorised by a Class 1 Financial Advice Provider Licence issued by Financial Markets Authority (“FMA”) to provide financial advice. Kalkine provides only general financial advice through its research reports following a person becoming a member. The reports contain buy/sell/hold and other recommendations in relation to equity securities, managed funds and other managed investment schemes and other financial advice products. The recommendations and opinions in this report and on Kalkine website do not take into account any of your investment objectives, financial situation or needs. Before you make a decision about whether to acquire a financial product, you should obtain the Product Disclosure Statement from the product issuer. You should consider the appropriateness of advice taking into account your own objectives, financial situation and needs and seek independent financial advice before making any financial decisions. If you act on the advice in the research reports, you may have to pay fees, expenses or other amounts (but not to Kalkine). Further information about the complaints and dispute resolution process, as well as information about Kalkine’s duties are available on Kalkine’s website. Please read our Financial Advice Provider (FAP) disclosure statement and Complaints Handling Guide, which are available on the website.
Past performance is not a reliable indicator of future performance.
 Please wait processing your request...