This report is an updated version of the report published on 28 February 2025 at 11:49 AM AEDT.
Section 1: Company Overview, Low Carbon Emission Initiatives and Fundamentals
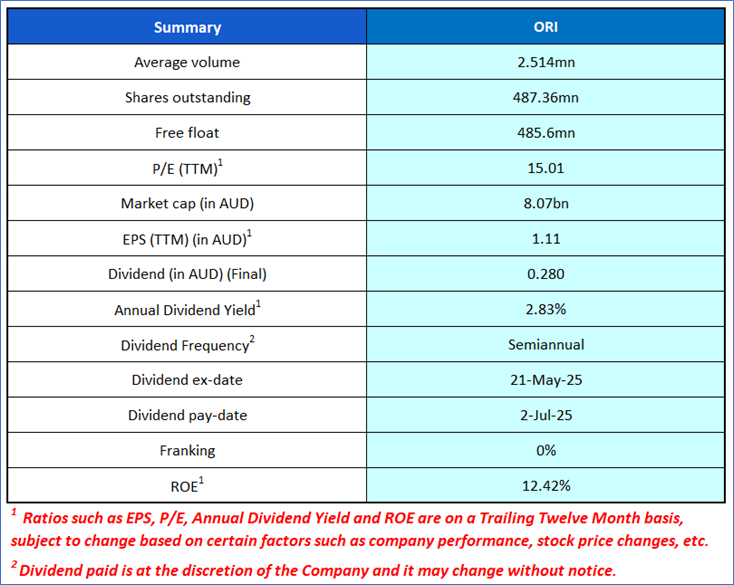
Section 1.1: Company Overview: Orica Limited (ASX: ORI) is an Australia-based mining and infrastructure solutions provider. The Company is engaged in the production and supply of explosives, blasting systems, mining chemicals and geotechnical monitoring to its cutting-edge digital solutions. Kalkine’s Low Carbon Research Report covers the Investment Highlights, Low Carbon Emission Initiatives, Key Financial Metrics, Risks, and Technical Analysis along with the Valuation, Target Price, and Recommendation on the stock.
Section 1.2: Why Low Carbon Emission Matters?
The shift toward a low-carbon economy is one of the most significant challenges of current time, spurred by the urgent need to combat climate change and reduce the environmental impact of corporate activities. This report covers ASX-listed low-carbon emission company (ASX: ORI), that is committed to sustainability and responsible environmental practices.

Carbon and Waste Management - Key Metrics
Orica has evidently made progress in reducing its environmental impact. Its CO₂ emissions per AUD million in revenue dropped from 564.46 in 2020 to 333.33 in 2023, aligning with its net-zero target and interim goal of a 40% reduction by 2030. Similarly, total waste per AUD million in revenue fell from 4.85 in 2020 to 2.24 in 2023, with a sharp decline between 2021 and 2022, reflecting improved waste management. These reductions enhance Orica’s ESG profile and demonstrate its commitment to sustainable operations.

Peer Comparison: Carbon Emission and Waste Management Metrics
Orica stands out among its peers in carbon emissions reduction and waste management efforts. The company has set a 30% emission reduction target by 2026, which is relatively near-term compared to some peers with targets extending to 2030 or beyond. A key strength for Orica is its 62% waste recycling ratio, the highest among most of its peers, indicating a commitment to circular economy principles and waste management efficiency. In a nutshell, Orica’s environmental targets reflect a near-term focus on emissions cuts alongside a robust waste management strategy.

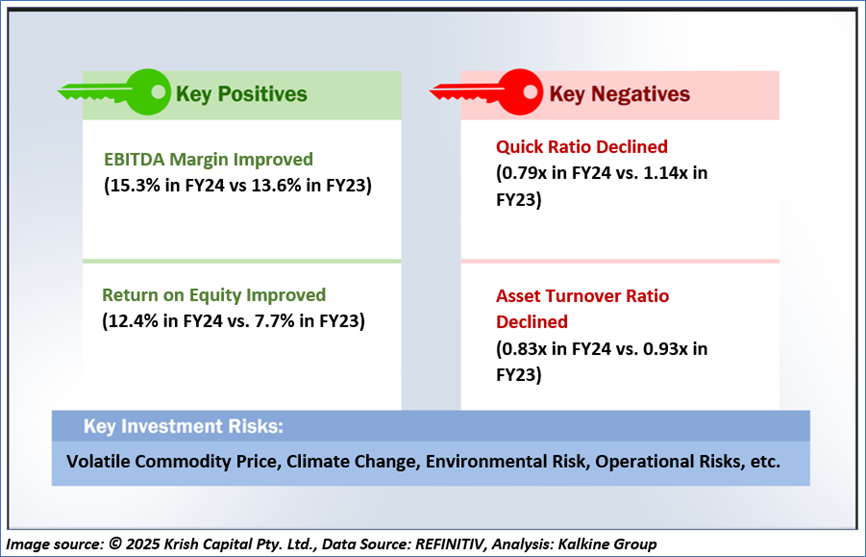
1.3 The Key Positives, Negatives, Investment Highlights, and Risks

1.4 Top 10 Shareholders:
The top 10 shareholders together form ~31.27% of the total shareholding. AustralianSuper and The Vanguard Group, Inc., hold maximum stakes in the company at ~13.19% and ~4.69%, respectively.

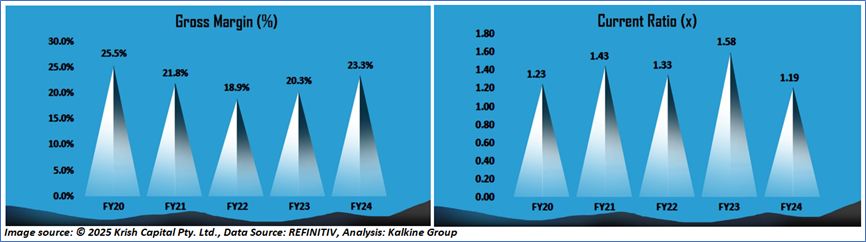
1.5 Key Metrics: ORI's EBITDA Margin increased to 15.3% in FY24 vs 13.6% in FY23. Below are captured other metrics:
Section 2: Business Updates, Financial and Operational Highlights
2.1 Recent Business Updates:

2.2 FY24 Results Highlights

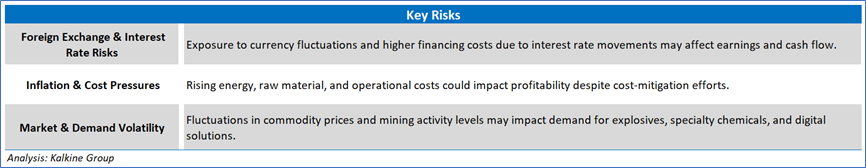
Section 3: Key Risks and Outlook:

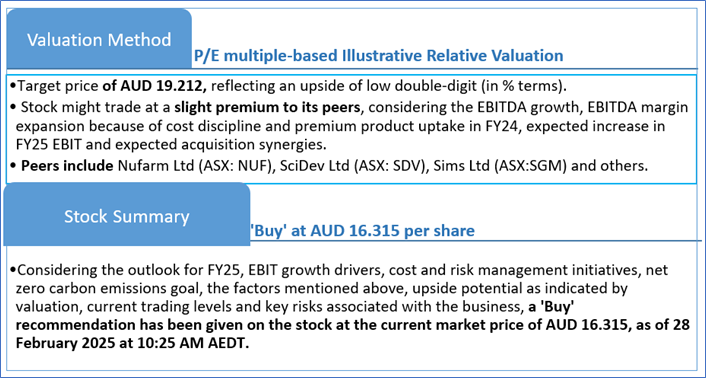
Section 4: Stock Recommendation Summary
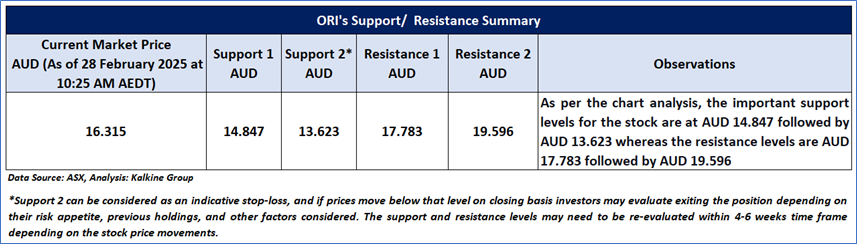
4.1 Price Performance and Technical Summary
The stock price has declined by ~3.80% in the last one month, whereas over the last nine months, it has corrected by ~10.15%. The stock has a 52-week low and 52-week high of AUD 16.160 and AUD 18.965, respectively, and is currently trading below the mid-points of its 52-week low and 52-week high. ORI was last covered in a report dated ‘25 October 2024’.

4.2 Fundamental Valuation
Valuation Methodology: P/E Multiple Based Relative Valuation (Illustrative)

Markets are trading in a highly volatile zone currently due to certain macro-economic issues and geopolitical tensions prevailing. Therefore, it is prudent to follow a cautious approach while investing.
Note 1: Past performance is neither an indicator nor a guarantee of future performance.
Note 2: The reference date for all price data, currency, technical indicators, support, and resistance levels is 28 February 2025. The reference data in this report has been partly sourced from REFINITIV.
Note 3: Investment decisions should be made depending on an individual's appetite for upside potential, risks, holding duration, and any previous holdings. An 'Exit' from the stock can be considered if the Target Price mentioned as per the Valuation and or the technical levels provided has been achieved and is subject to the factors discussed above.
Note 4: Dividend Yield may vary as per the stock price movement.
Note 5: Kalkine reports are prepared based on the stock prices captured either from REFINITIV or Trading View. Typically, REFINITIV or Trading View may reflect stock prices with a delay which could be a lag of 25-30 minutes. There can be no assurance that future results or events will be consistent with the information provided in the report. The information is subject to change without any prior notice.
Technical Indicators Defined: -
Support: A level at which the stock prices tend to find support if they are falling, and a downtrend may take a pause backed by demand or buying interest. Support 1 refers to the nearby support level for the stock and if the price breaches the level, then Support 2 may act as the crucial support level for the stock.
Resistance: A level at which the stock prices tend to find resistance when they are rising, and an uptrend may take a pause due to profit booking or selling interest. Resistance 1 refers to the nearby resistance level for the stock and if the price surpasses the level, then Resistance 2 may act as the crucial resistance level for the stock.
Stop-loss: It is a level to protect further losses in case of unfavourable movement in the stock prices.
Disclaimer This report has been issued by Kalkine New Zealand Limited (FSP691351) (NZBN:9429047678101) (“Kalkine”). Kalkine is a Financial Advice Provider (“FAP”) and is authorised by a Class 1 Financial Advice Provider Licence issued by Financial Markets Authority (“FMA”) to provide financial advice. Kalkine provides only general financial advice through its research reports following a person becoming a member. The reports contain buy/sell/hold and other recommendations in relation to equity securities, managed funds and other managed investment schemes and other financial advice products. The recommendations and opinions in this report and on Kalkine website do not take into account any of your investment objectives, financial situation or needs. Before you make a decision about whether to acquire a financial product, you should obtain the Product Disclosure Statement from the product issuer. You should consider the appropriateness of advice taking into account your own objectives, financial situation and needs and seek independent financial advice before making any financial decisions. If you act on the advice in the research reports, you may have to pay fees, expenses or other amounts (but not to Kalkine). Further information about the complaints and dispute resolution process, as well as information about Kalkine’s duties are available on Kalkine’s website. Please read our Financial Advice Provider (FAP) disclosure statement and Complaints Handling Guide, which are available on the website.
Past performance is not a reliable indicator of future performance.
 Please wait processing your request...