
Section 1: Company Overview and Fundamentals
1.1 Company Overview:
OneMain Holdings, Inc. (NYSE: OMF) is a financial services holding company. The Company provides personal loan products; offers auto financing; offers credit cards; offers optional products; offers a customer-focused financial wellness program; services loans, and acquisitions and dispositions of assets and businesses. It provides origination, underwriting, and servicing of personal loans, primarily to nonprime customers. In addition, the Company offers two credit cards, BrightWay and BrightWay+, through a third-party bank partner.
Kalkine’s Dividend Income Report covers the Company Overview, Key positives & negatives, Investment summary, Key investment metrics, Top 10 shareholding, Business updates and insights into company recent financial results, Key Risks & Outlook, Price performance and technical summary, Target Price, and Recommendation on the stock.
Price Performance:
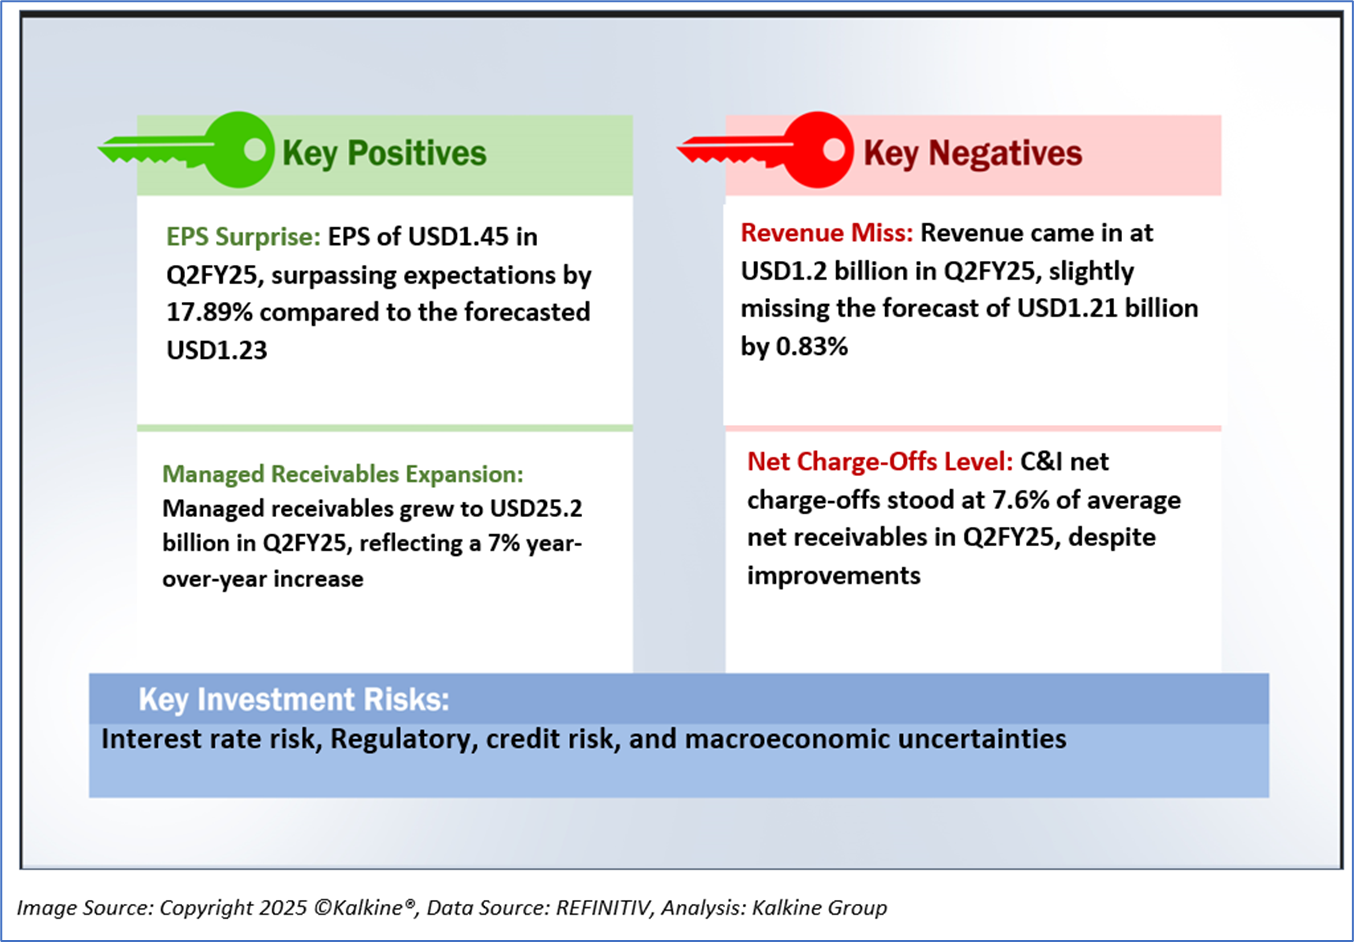
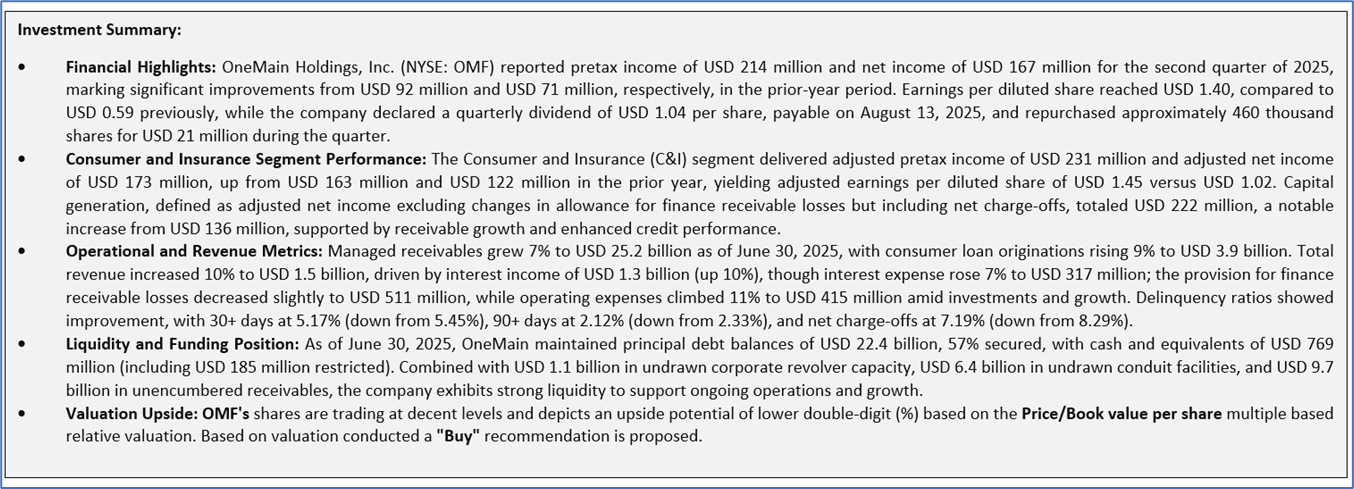
1.2 The Key Positives, Negatives, and Investment summary
1.3 Top 10 shareholders:
The top 10 shareholders together form ~50.33% of the total shareholding, signifying concentrated shareholding. The Vanguard Group, Inc., and Capital International Investors are the biggest shareholders, holding the maximum stake in the company at ~9.83% and ~8.66%, respectively.

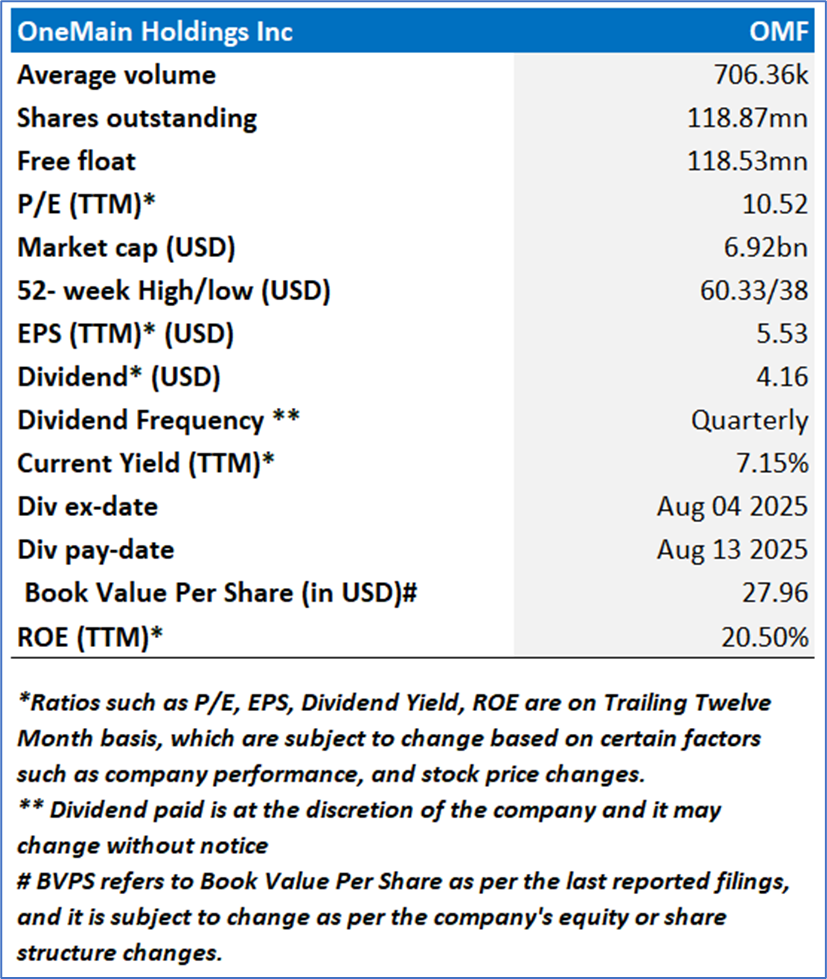
1.4 Dividend payments with impressive dividend yield:
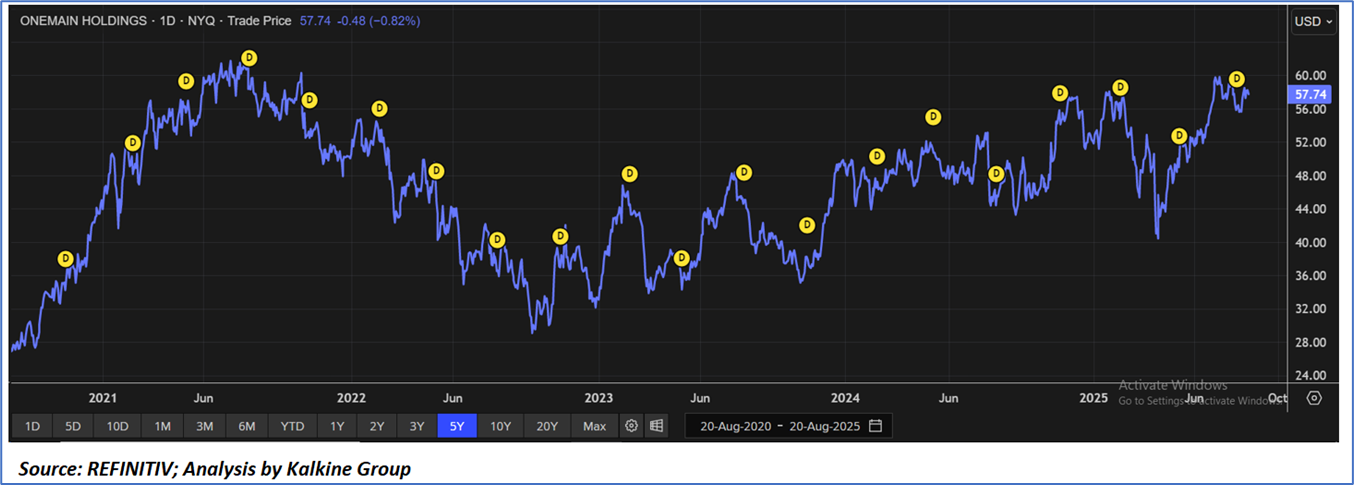
The five-year stock price chart for OneMain Holdings Inc. (OMF) from August 2020 to August 20, 2025, illustrates a generally upward trajectory with periodic volatility, starting around USD 28 per share in late 2020, peaking near USD 60 in mid-2021 and again in early 2025, and closing at USD 57.74 with a slight 0.82% decline on the current date, marked by multiple yellow "D" icons denoting dividend payment dates that align with the company's consistent quarterly distribution schedule. OneMain Holdings has maintained a robust dividend history since initiating payments, featuring regular quarterly dividends that have progressively increased from USD 0.45 per share in November 2020 to USD 0.70 in 2021, USD 0.95 in 2022, USD 1.00 in 2023, and USD 1.04 since 2024, culminating in an annualized dividend of USD 4.16 per share as of 2025, supplemented by special dividends of USD 3.95 in February 2021 and USD 4.20 in August 2021 to reward shareholders during periods of strong capital generation. This distribution strategy underscores the company's commitment to shareholder returns, with the latest ex-dividend date on August 4, 2025, for a USD 1.04 regular payout on August 13, 2025, and a current forward dividend yield of 7.15%, reflecting an attractive value proposition amid solid fundamentals and a resilient business model focused on non-prime consumer lending.
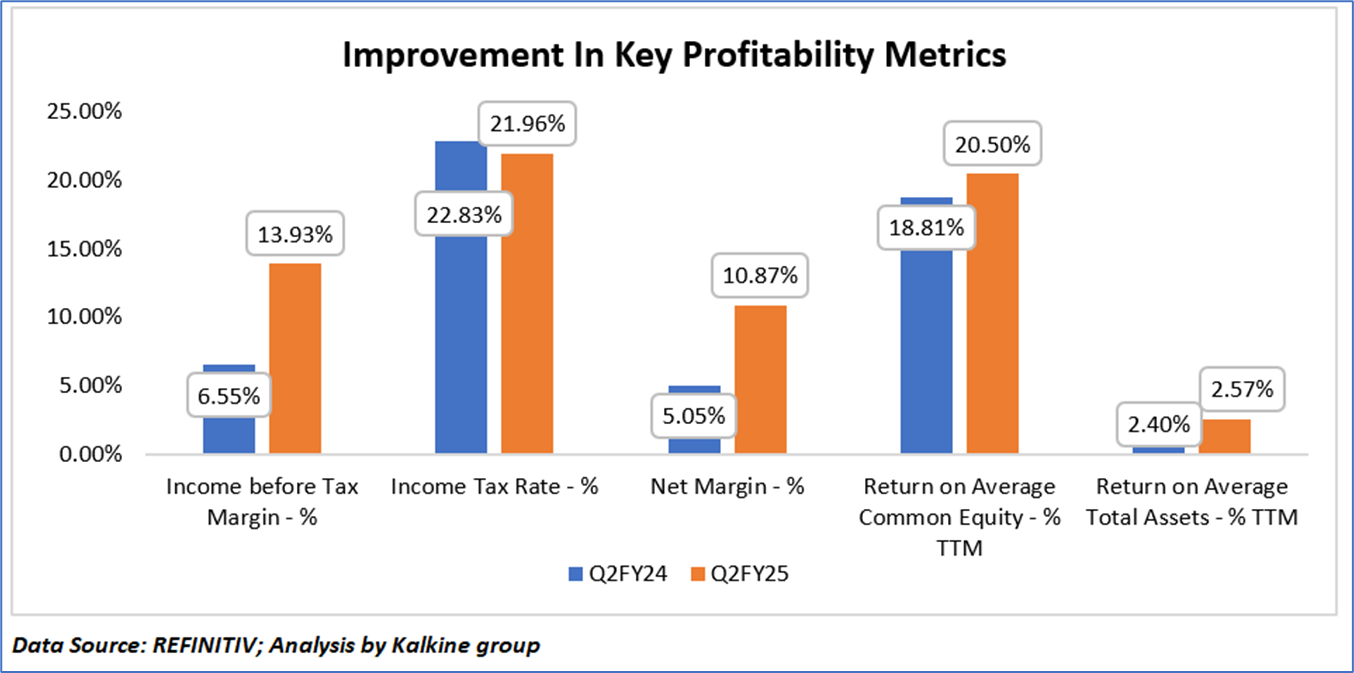
1.5 Key Metrics
OneMain Holdings Inc. (OMF) demonstrated substantial year-over-year profitability enhancements in Q2 FY25 compared to Q2 FY24, as evidenced by a doubling of the income before tax margin from 6.55% to 13.93%, driven by robust revenue growth of 10%, improved credit performance with net charge-offs declining 88 basis points, and effective cost management despite an 11% rise in operating expenses; this was complemented by a modest reduction in the effective income tax rate from 22.83% to 21.96%, contributing to a more than twofold increase in net margin from 5.05% to 10.87%. Furthermore, trailing twelve-month (TTM) returns reflected strengthened efficiency and shareholder value creation, with return on average common equity rising from 18.81% to 20.50% amid significant capital generation of USD222 million (up 63%) and ongoing share repurchases, while return on average total assets improved from 2.40% to 2.57%, underscoring the company's resilient balance sheet, conservative underwriting, and strategic expansions in credit cards and auto finance that bolstered managed receivables to USD25.2 billion.
Section 2: Business Updates and Financial Highlights
2.1 Recent Updates:
The below picture gives an overview of the recent updates:

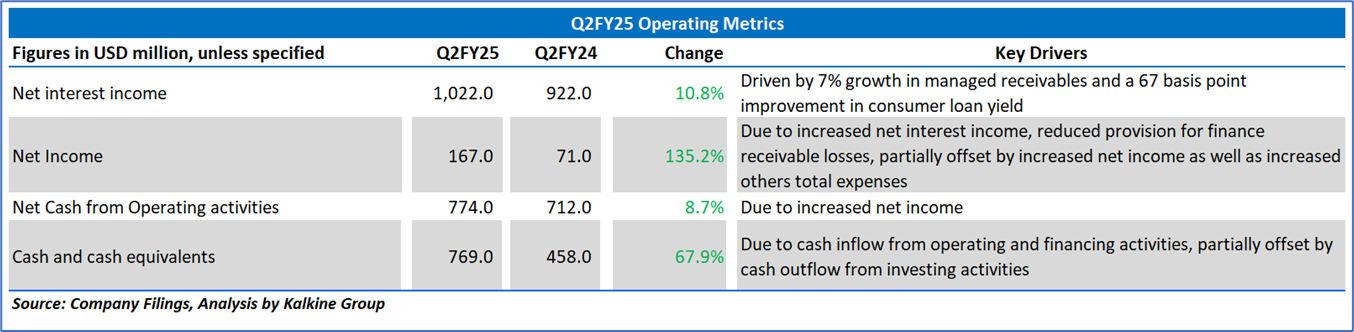
2.2 Insights of Q2FY25:
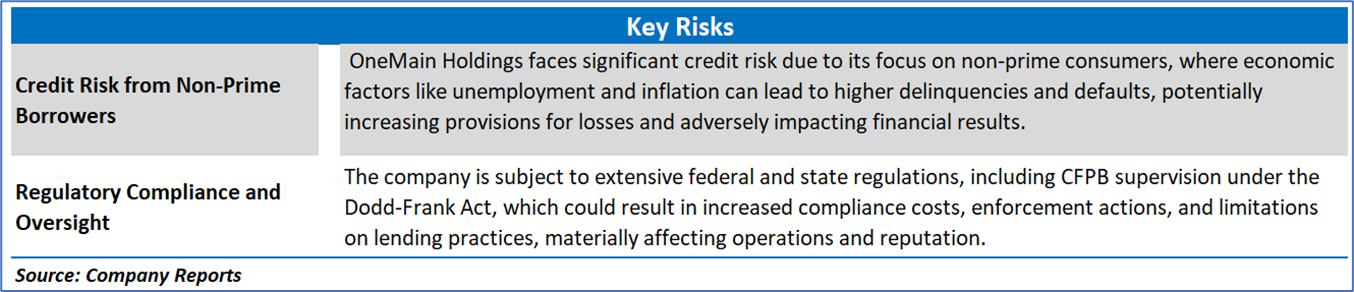
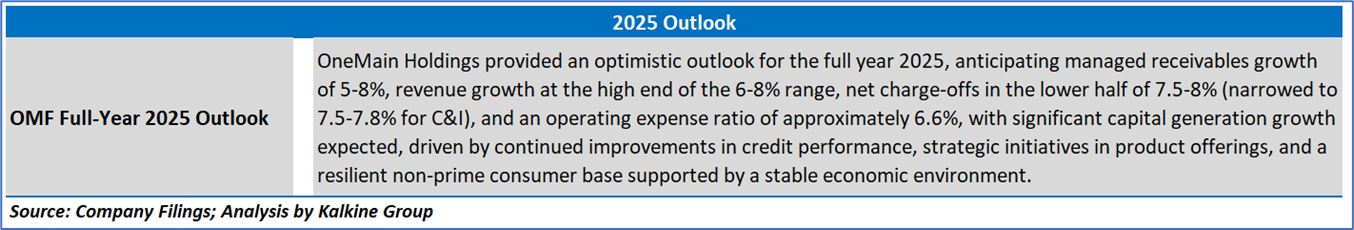
Section 3: Key Risks and Outlook for FY2025:
Section 4: Stock Recommendation Summary:
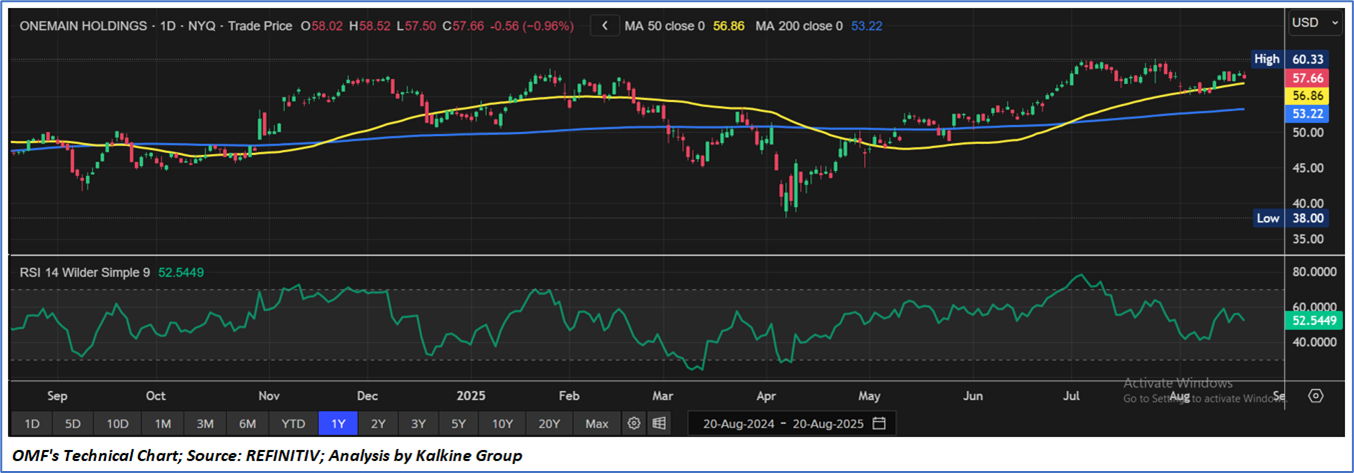
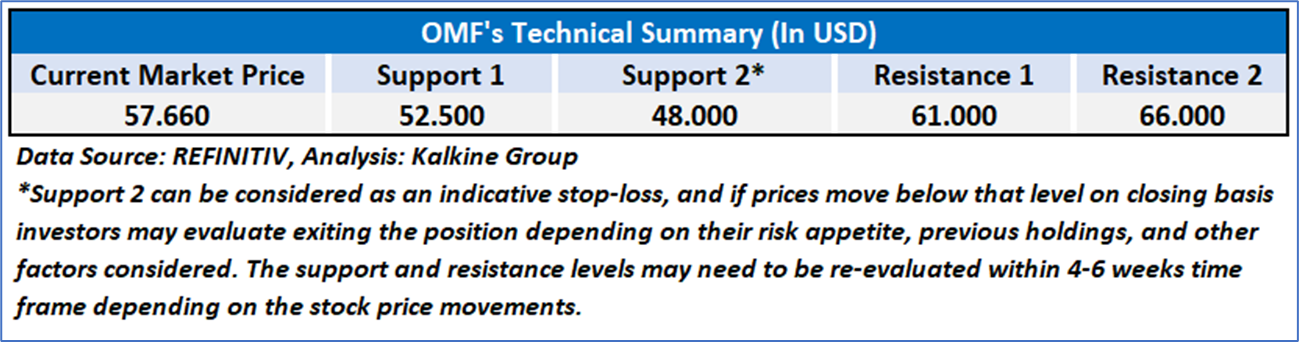
4.1 Technical Summary:
Price Performance:
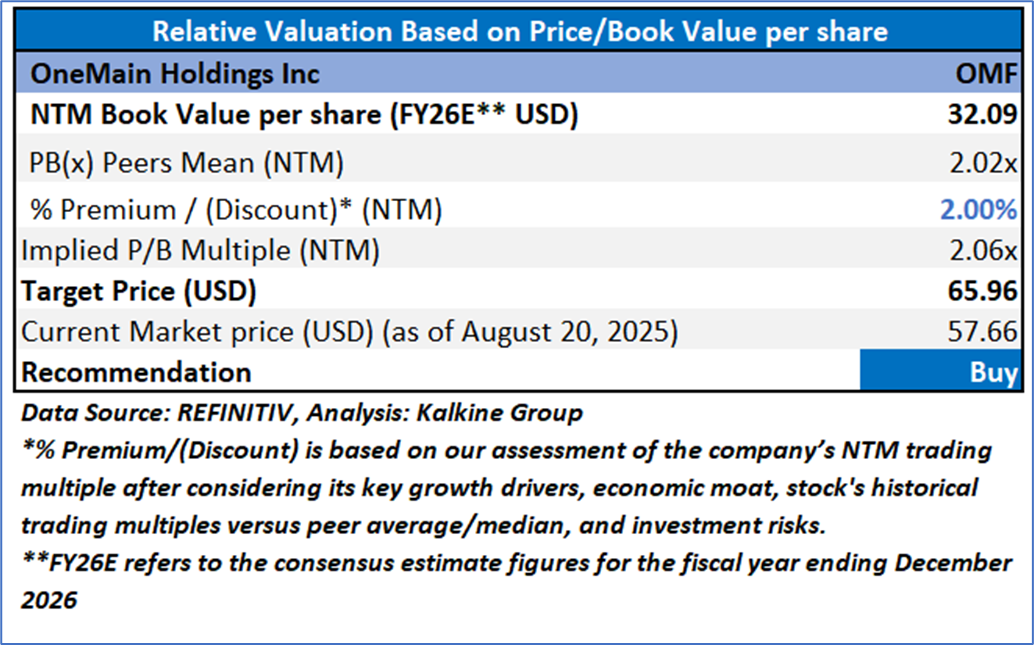
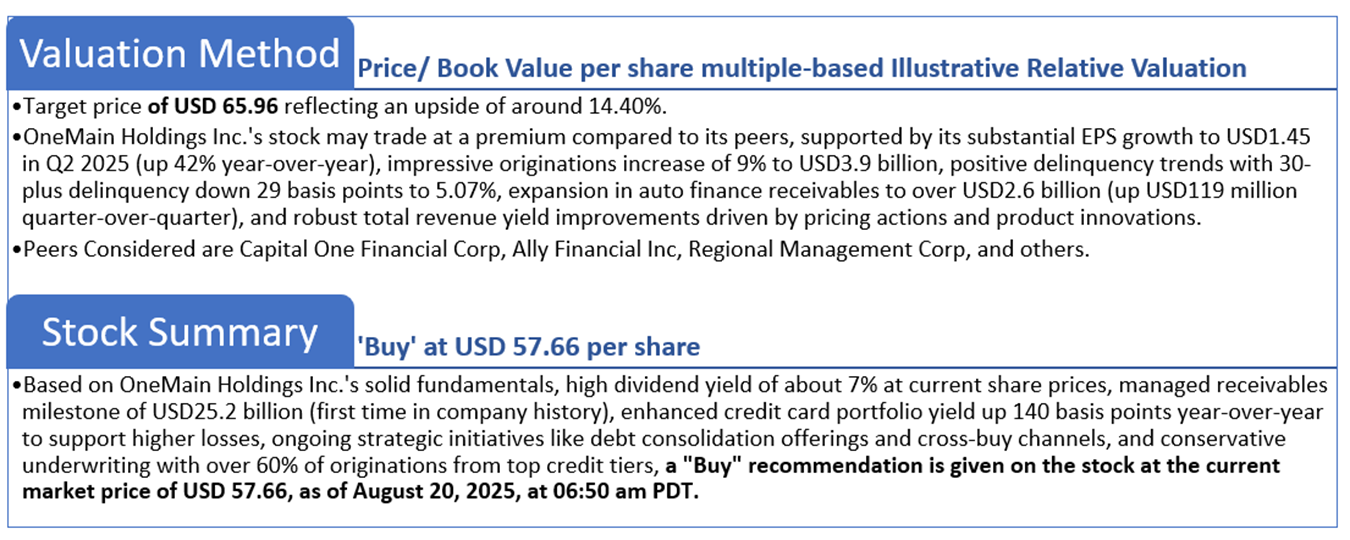
4.2 Fundamental Valuation
Valuation Methodology: Price/Book Value Per Share Multiple Based Relative Valuation
Markets are trading in a highly volatile zone currently due to certain macroeconomic issues and geopolitical tensions prevailing. Therefore, it is prudent to follow a cautious approach while investing.
Note 1: Past performance is not a reliable indicator of future performance.
Note 2: The reference date for all price data, currency, technical indicators, support, and resistance levels is August 20, 2025. The reference data in this report has been partly sourced from REFINITIV.
Note 3: Investment decisions should be made depending on an individual's appetite for upside potential, risks, holding duration, and any previous holdings. An 'Exit' from the stock can be considered if the Target Price mentioned as per the Valuation and or the technical levels provided has been achieved and is subject to the factors discussed above.
Note 4: The report publishing date is as per the Pacific Time Zone.
Technical Indicators Defined: -
Support: A level at which the stock prices tend to find support if they are falling, and a downtrend may take a pause backed by demand or buying interest. Support 1 refers to the nearby support level for the stock and if the price breaches the level, then Support 2 may act as the crucial support level for the stock.
Resistance: A level at which the stock prices tend to find resistance when they are rising, and an uptrend may take a pause due to profit booking or selling interest. Resistance 1 refers to the nearby resistance level for the stock and if the price surpasses the level, then Resistance 2 may act as the crucial resistance level for the stock.
Stop-loss: It is a level to protect against further losses in case of unfavorable movement in the stock prices.
Disclaimer This report has been issued by Kalkine New Zealand Limited (FSP691351) (NZBN:9429047678101) (“Kalkine”). Kalkine is a Financial Advice Provider (“FAP”) and is authorised by a Class 1 Financial Advice Provider Licence issued by Financial Markets Authority (“FMA”) to provide financial advice. Kalkine provides only general financial advice through its research reports following a person becoming a member. The reports contain buy/sell/hold and other recommendations in relation to equity securities, managed funds and other managed investment schemes and other financial advice products. The recommendations and opinions in this report and on Kalkine website do not take into account any of your investment objectives, financial situation or needs. Before you make a decision about whether to acquire a financial product, you should obtain the Product Disclosure Statement from the product issuer. You should consider the appropriateness of advice taking into account your own objectives, financial situation and needs and seek independent financial advice before making any financial decisions. If you act on the advice in the research reports, you may have to pay fees, expenses or other amounts (but not to Kalkine). Further information about the complaints and dispute resolution process, as well as information about Kalkine’s duties are available on Kalkine’s website. Please read our Financial Advice Provider (FAP) disclosure statement and Complaints Handling Guide, which are available on the website.
Past performance is not a reliable indicator of future performance.
 Please wait processing your request...