Section 1: Company Overview and Fundamentals
1.1 Company Overview:
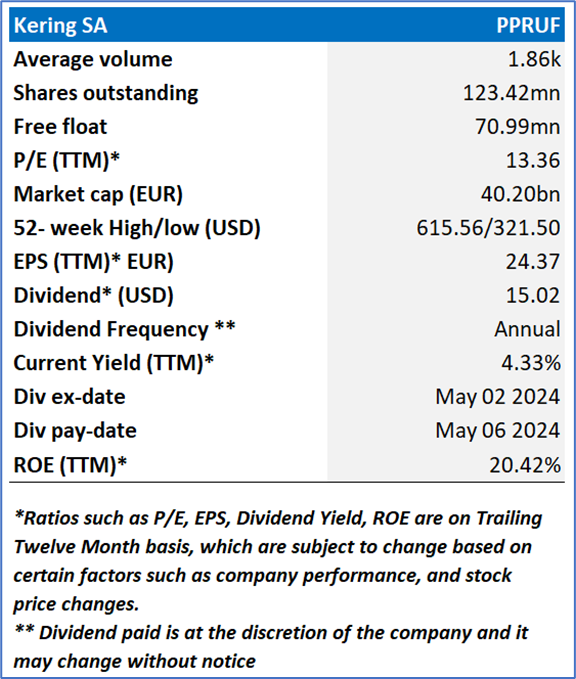
Kering SA (OTC: PPRUF) is a France-based company that mainly active in fashion group on luxurious branded products. The Group manages the development of a series of renowned Houses in Fashion, Leather Goods and Jewelry: Gucci, Saint Laurent, Bottega Veneta, Balenciaga, Alexander McQueen, Brioni, Boucheron, Pomellato, DoDo, Ginori 1735, as well as Kering Eyewear and Kering Beaute.
Kalkine’s Dividend Income Report covers the Company Overview, Key positives & negatives, Investment summary, Key investment metrics, Top 10 shareholding, Business updates and insights into company recent financial results, Key Risks & Outlook, Price performance and technical summary, Target Price, and Recommendation on the stock.
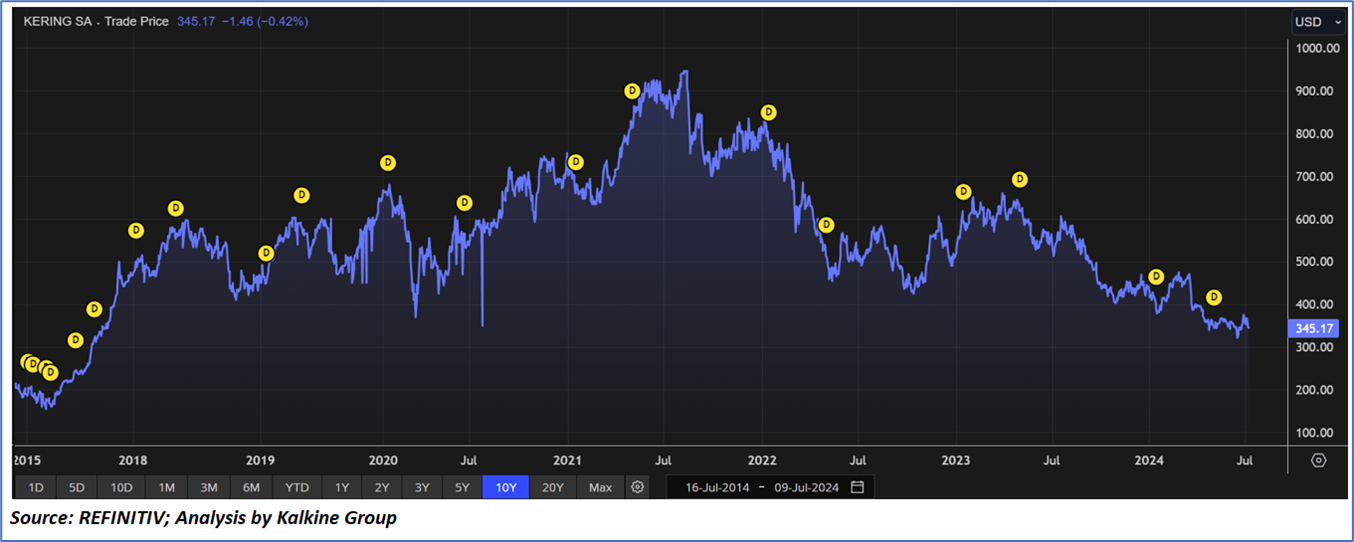
Price Performance:
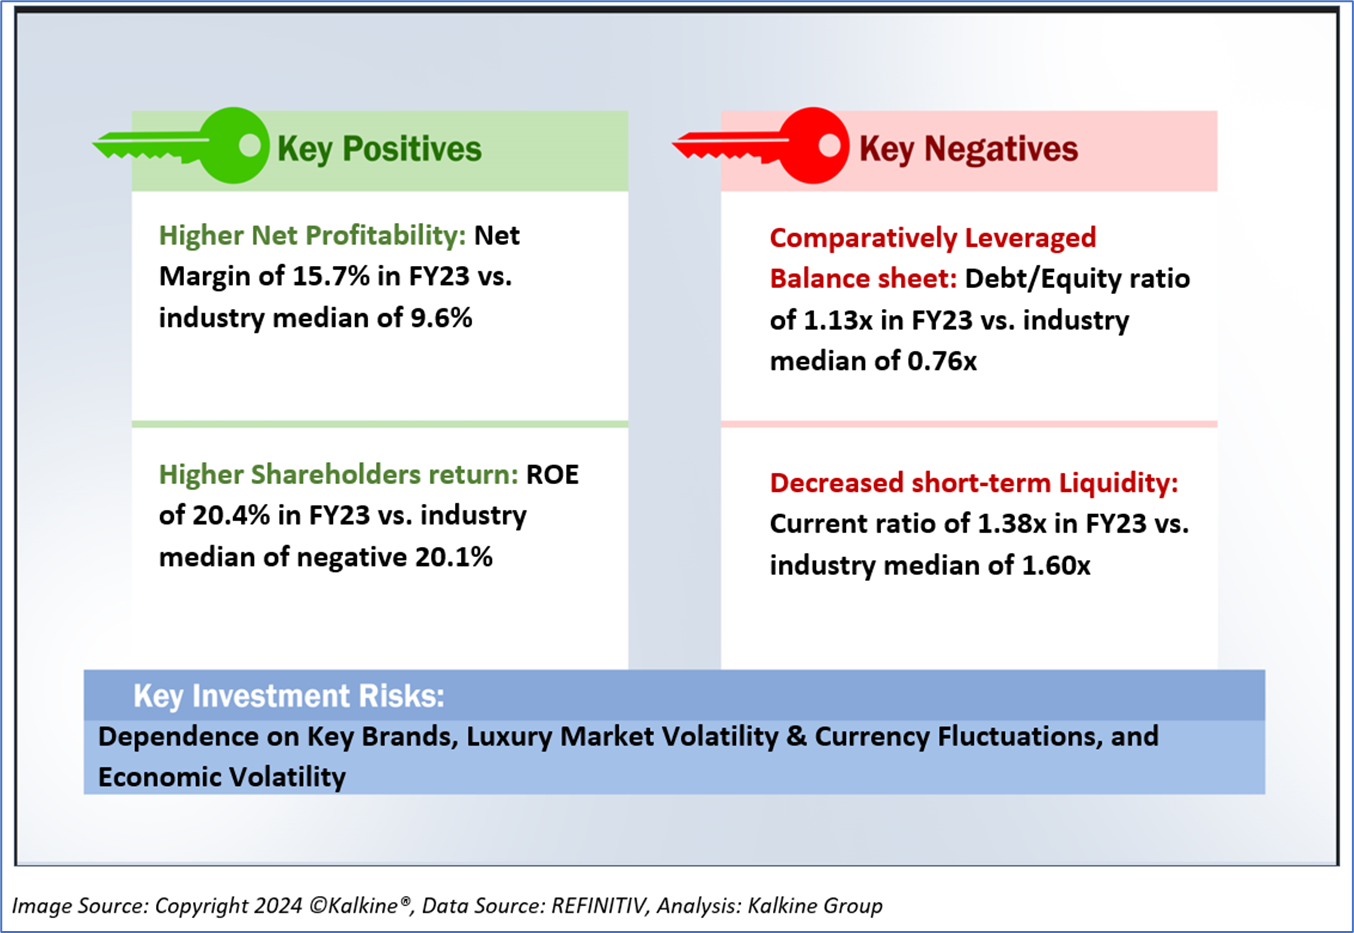
1.2 The Key Positives, Negatives, and Investment summary
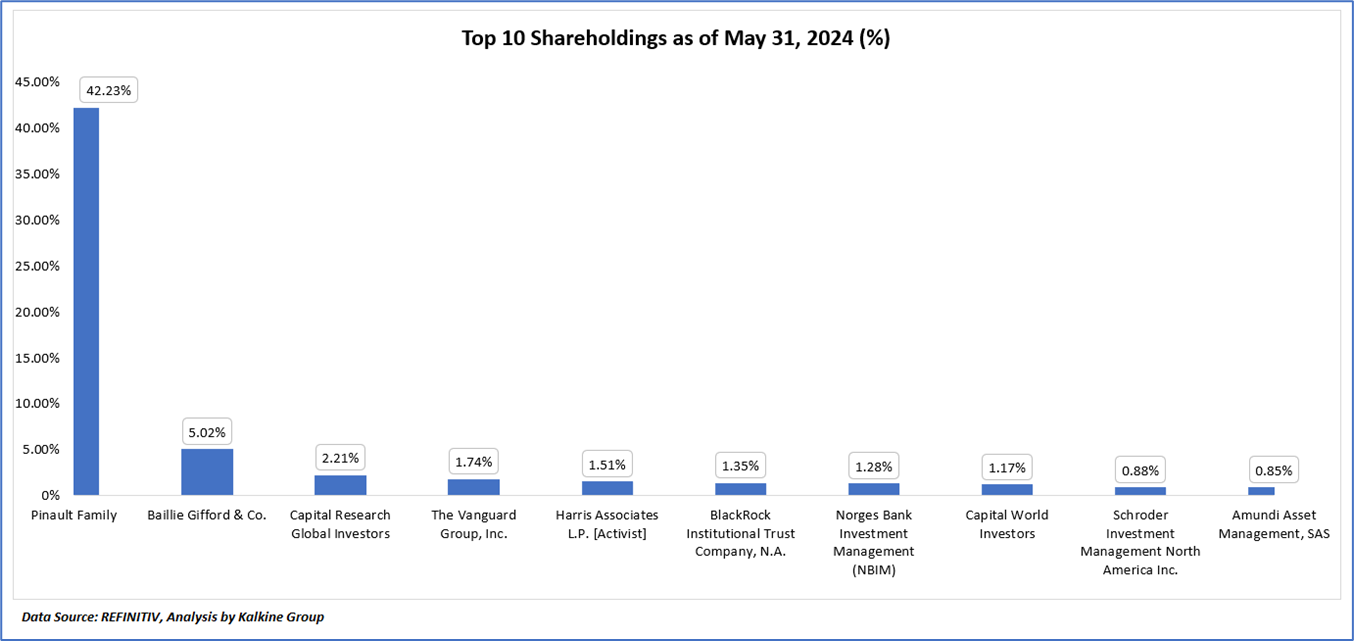
1.3 Top 10 shareholders:
The top 10 shareholders together form ~58.24% of the total shareholding, signifying concentrated shareholding. Pinault Family, and Baillie Gifford & Co., are the biggest shareholders, holding the maximum stake in the company at ~42.23% and ~5.02%, respectively.
1.4 Dividend payments with impressive dividend yield:
Kering SA maintains a policy of paying annual dividends, reflecting its commitment to providing consistent returns to shareholders. For the fiscal year, the company declared a dividend of USD 15.02 per share, with a competitive current yield of 4.33% based on the trailing twelve months (TTM). The ex-dividend date is May 02, 2024, and the payment date is May 06, 2024, ensuring timely distribution to shareholders. This robust yield highlights Kering's strong profitability and confidence in its future cash flows, demonstrating its ability to generate substantial revenue and maintain liquidity despite market fluctuations. The consistent annual payouts underscore Kering's dedication to long-term shareholder value and financial discipline.
1.5 Key Metrics
Between 2019 and 2023, Kering's revenue experienced notable fluctuations, starting at USD 17,776 million in 2019 and declining to USD 14,931 million in 2020, due to the global pandemic. The company rebounded in 2021 with revenue rising to USD 20,859 million and continued growth in 2022 to USD 21,392 million, followed by a slight decrease to USD 21,153 million in 2023. Gross profit followed a similar trend, beginning at USD 13,178 million in 2019, dropping to USD 10,839 million in 2020, then increasing to USD 15,449 million in 2021, USD 15,975 million in 2022, and reaching USD 16,138 million in 2023.
Comparing Kering’s financial performance to the industry median across several key margins reveals that Kering (PPRUF) has a gross margin of 76.3%, significantly higher than the industry median of 71.2%, indicating efficient cost management and pricing strategies. The EBITDA margin for Kering is 33.5%, well above the industry median of 23.7%, reflecting strong operational efficiency and profitability. Kering's operating margin stands at 23.7%, compared to the industry median of 15.7%, showcasing superior operational management. The pretax margin for Kering is 21.6%, exceeding the industry median of 14.9%, indicating robust profitability before tax considerations. Finally, Kering's net margin is 15.7%, notably higher than the industry median of 9.6%, highlighting effective cost controls and strong overall financial health.

Section 2: Business Updates and Financial Highlights
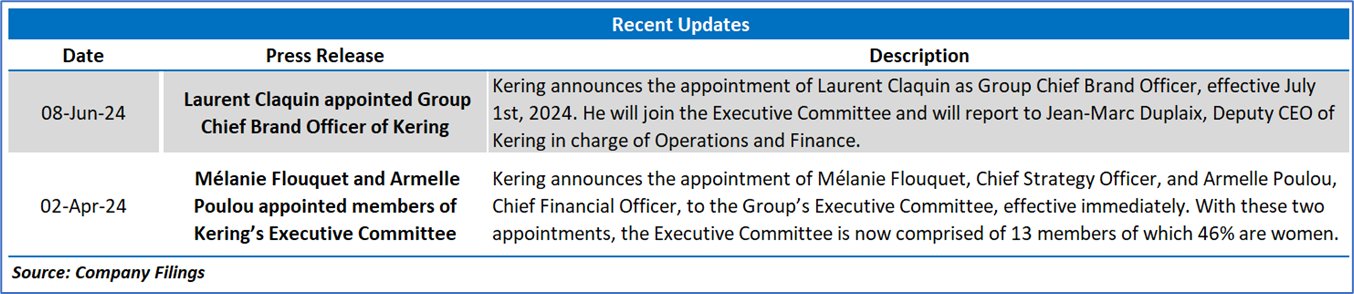
2.1 Recent Updates:
The below picture gives an overview of the recent updates:
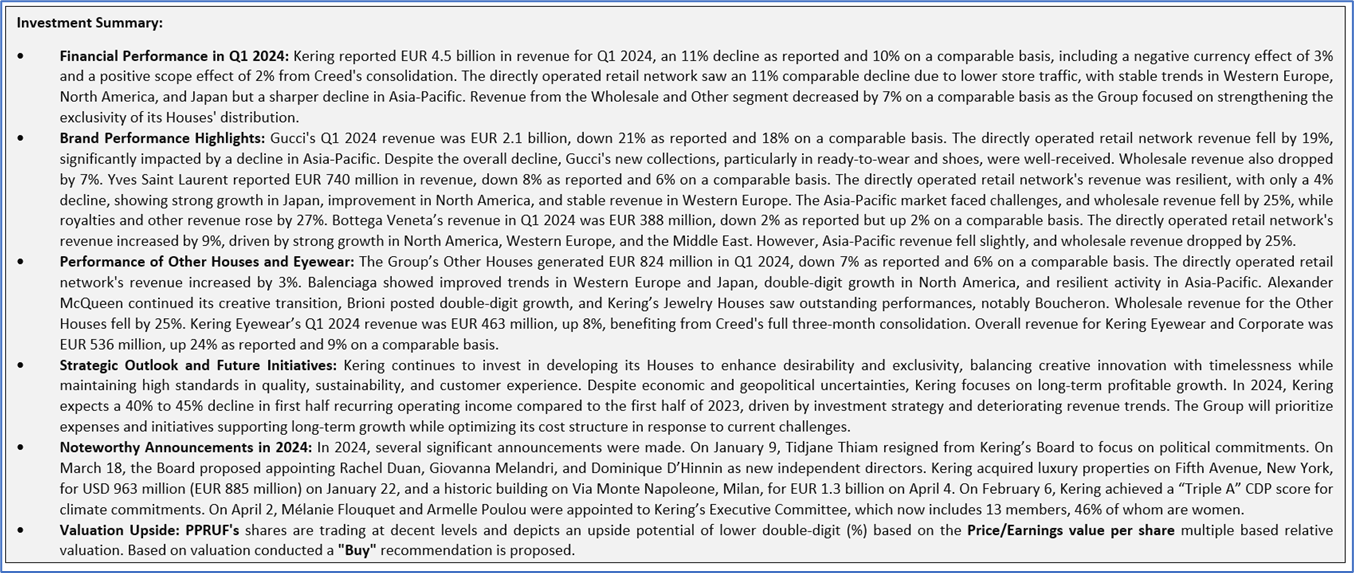
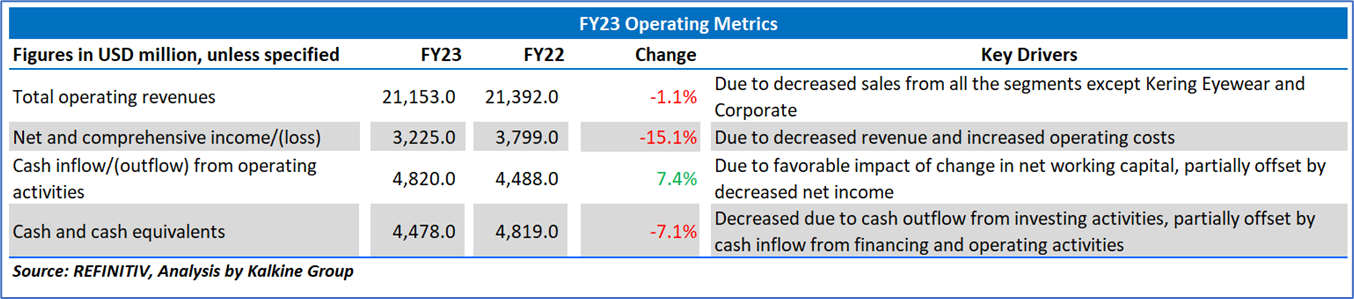
2.2 Insights of FY23:
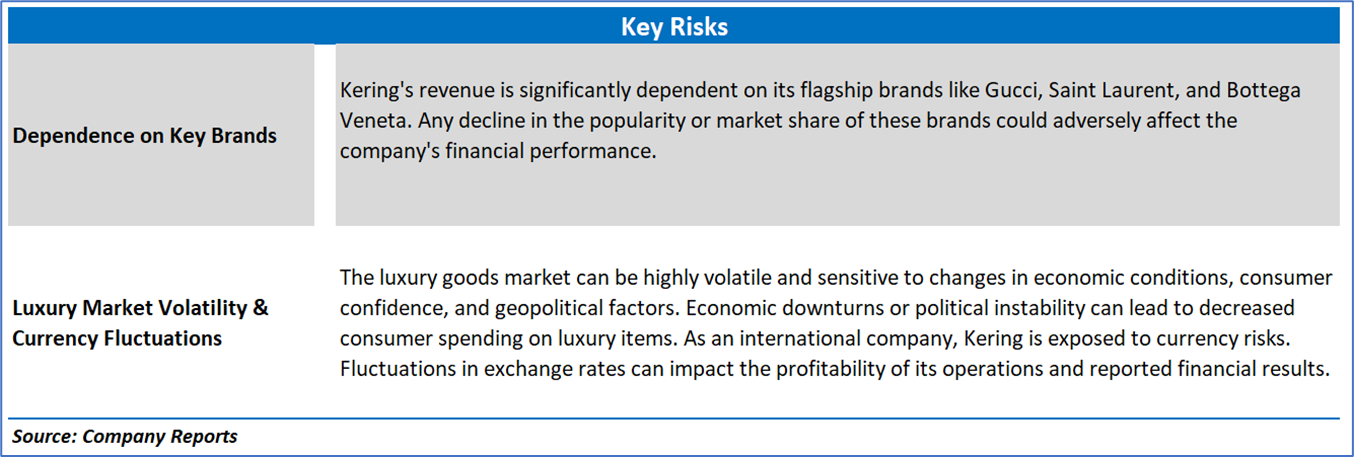
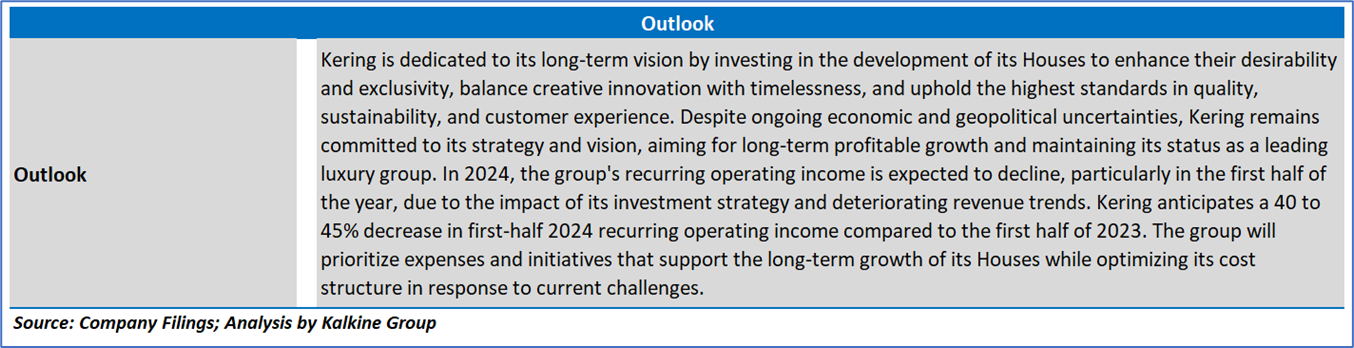
Section 3: Key Risks and Outlook:
Section 4: Stock Recommendation Summary:
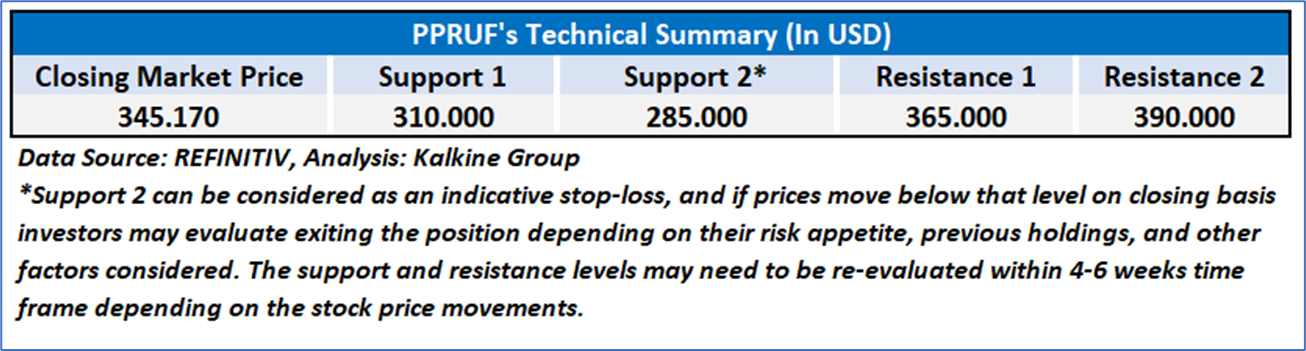
4.1 Technical Summary:
Price Performance:

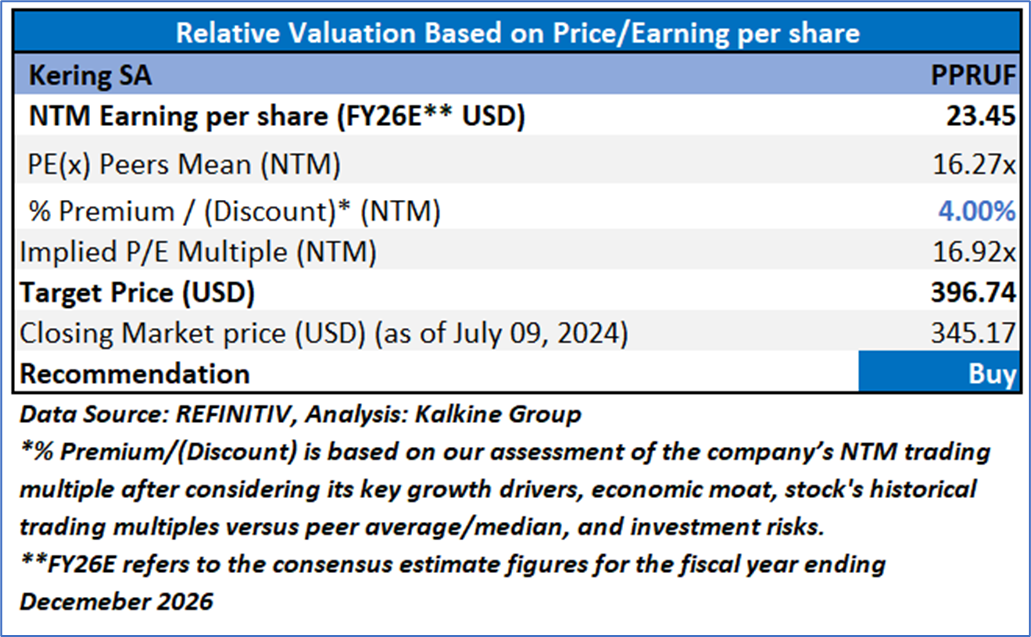
4.2 Fundamental Valuation
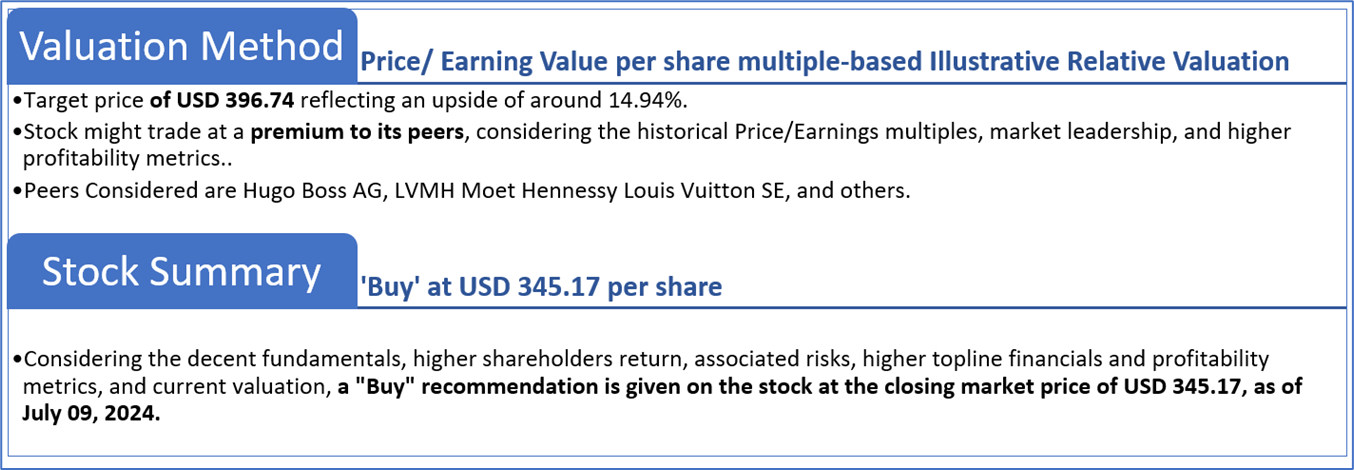
Valuation Methodology: Price/Earnings Per Share Multiple Based Relative Valuation
Markets are trading in a highly volatile zone currently due to certain macroeconomic issues and geopolitical tensions prevailing. Therefore, it is prudent to follow a cautious approach while investing.
Note 1: Past performance is not a reliable indicator of future performance.
Note 2: The reference date for all price data, currency, technical indicators, support, and resistance levels is July 09, 2024. The reference data in this report has been partly sourced from REFINITIV.
Note 3: Investment decisions should be made depending on an individual's appetite for upside potential, risks, holding duration, and any previous holdings. An 'Exit' from the stock can be considered if the Target Price mentioned as per the Valuation and or the technical levels provided has been achieved and is subject to the factors discussed above.
Note 4: The report publishing date is as per the Pacific Time Zone.
Technical Indicators Defined: -
Support: A level at which the stock prices tend to find support if they are falling, and a downtrend may take a pause backed by demand or buying interest. Support 1 refers to the nearby support level for the stock and if the price breaches the level, then Support 2 may act as the crucial support level for the stock.
Resistance: A level at which the stock prices tend to find resistance when they are rising, and an uptrend may take a pause due to profit booking or selling interest. Resistance 1 refers to the nearby resistance level for the stock and if the price surpasses the level, then Resistance 2 may act as the crucial resistance level for the stock.
Stop-loss: It is a level to protect against further losses in case of unfavorable movement in the stock prices.
Disclaimer This report has been issued by Kalkine New Zealand Limited (FSP691351) (NZBN:9429047678101) (“Kalkine”). Kalkine is a Financial Advice Provider (“FAP”) and is authorised by a Class 1 Financial Advice Provider Licence issued by Financial Markets Authority (“FMA”) to provide financial advice. Kalkine provides only general financial advice through its research reports following a person becoming a member. The reports contain buy/sell/hold and other recommendations in relation to equity securities, managed funds and other managed investment schemes and other financial advice products. The recommendations and opinions in this report and on Kalkine website do not take into account any of your investment objectives, financial situation or needs. Before you make a decision about whether to acquire a financial product, you should obtain the Product Disclosure Statement from the product issuer. You should consider the appropriateness of advice taking into account your own objectives, financial situation and needs and seek independent financial advice before making any financial decisions. If you act on the advice in the research reports, you may have to pay fees, expenses or other amounts (but not to Kalkine). Further information about the complaints and dispute resolution process, as well as information about Kalkine’s duties are available on Kalkine’s website. Please read our Financial Advice Provider (FAP) disclosure statement and Complaints Handling Guide, which are available on the website.
Past performance is not a reliable indicator of future performance.
 Please wait processing your request...