Section 1: Company Overview and Fundamentals
1.1 Company Overview:
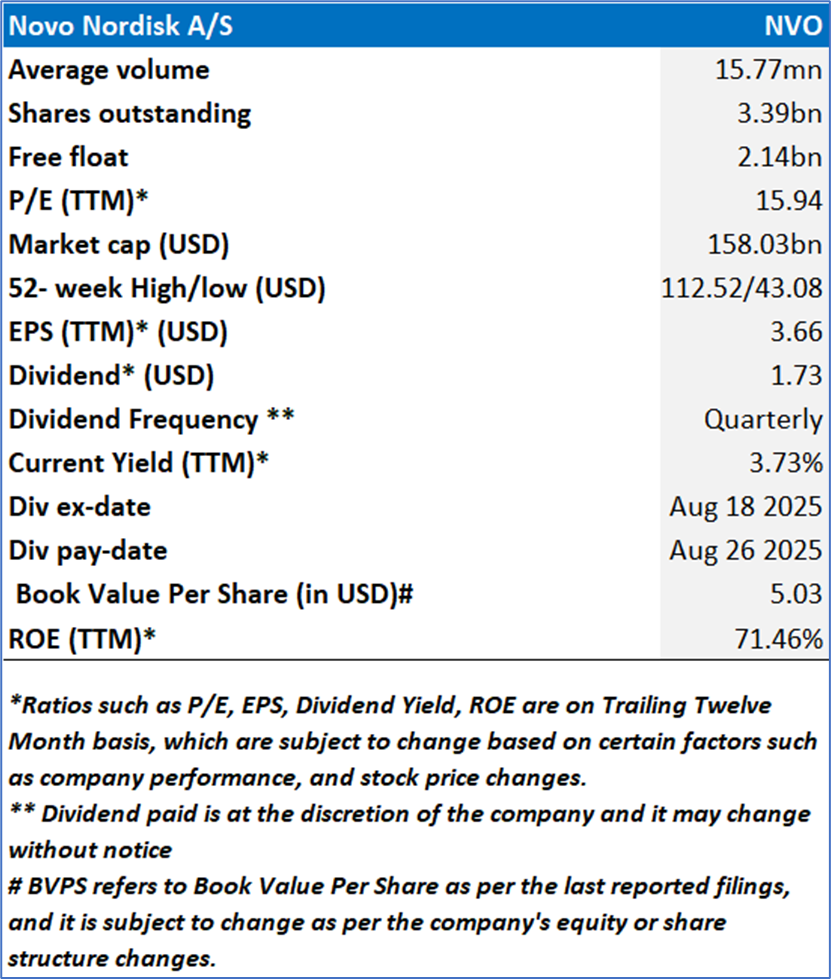
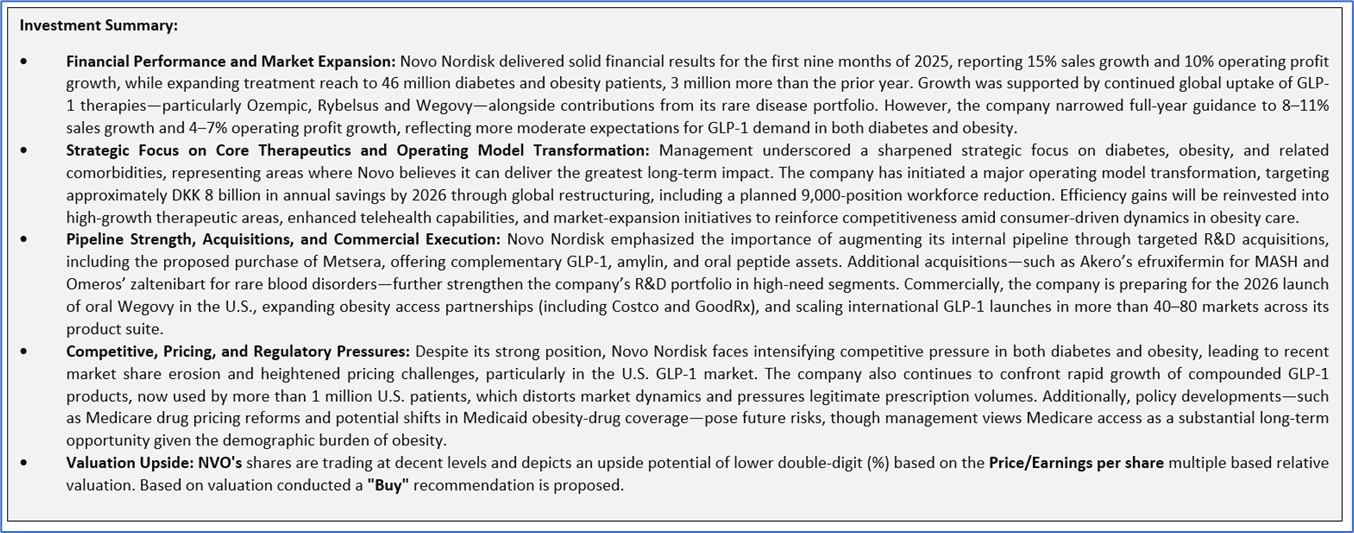
Novo Nordisk A/S (NYSE: NVO) is a global healthcare company engaged in diabetes care. The Company is also engaged in the discovery, development, manufacturing and marketing of pharmaceutical products. The Company operates through two business segments: diabetes and obesity care, and biopharmaceuticals.
Kalkine’s Dividend Income Report covers the Company Overview, Key positives & negatives, Investment summary, Key investment metrics, Top 10 shareholding, Business updates and insights into company recent financial results, Key Risks & Outlook, Price performance and technical summary, Target Price, and Recommendation on the stock.
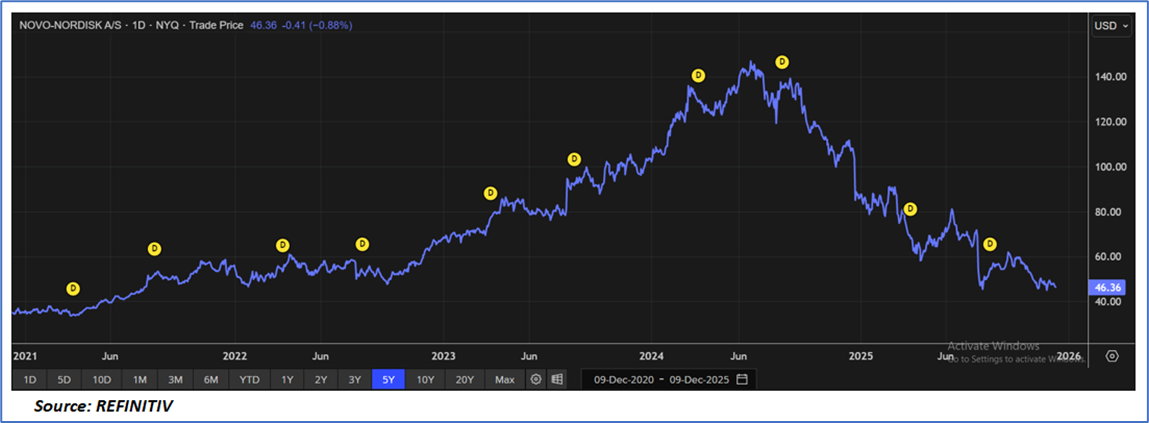
Price Performance:
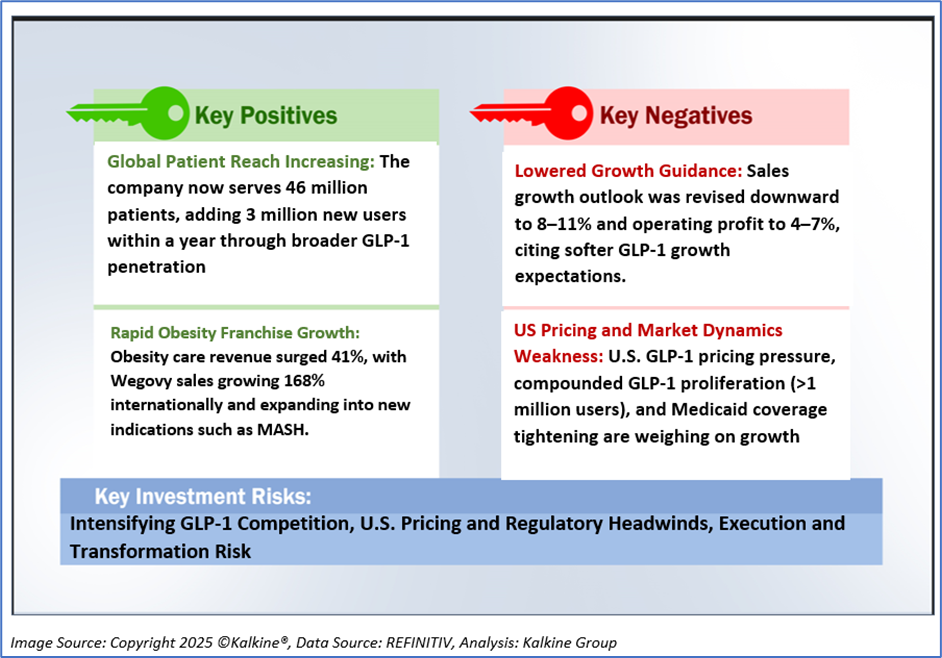
1.2 The Key Positives, Negatives, and Investment summary
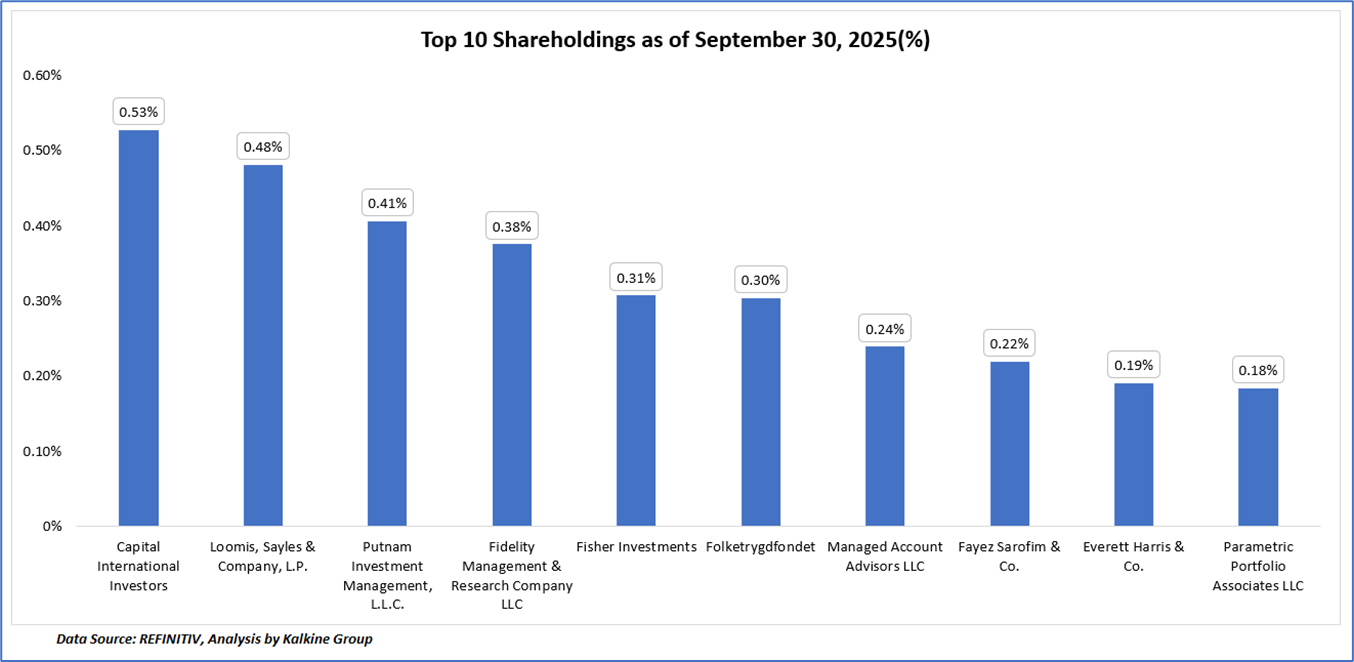
1.3 Top 10 shareholders:
The top 10 shareholders together form ~3.23% of the total shareholding, signifying diverse shareholding. Capital International Investors and Loomis, Sayles & Company, L.P. are the biggest shareholders, holding the maximum stake in the company at ~0.53% and ~0.48%, respectively.
1.4 Dividend payments with impressive dividend yield:
Novo Nordisk (NVO), with a dividend yield of 3.69%, has maintained a consistent and shareholder-friendly dividend record, demonstrated by a long history of annual increases supported by strong cash generation from its diabetes and obesity franchises. The company follows a progressive dividend policy, aiming to raise the dividend over time in line with sustainable earnings growth while retaining flexibility to fund acquisitions, R&D expansion, and large-scale capacity investments. Dividend payouts have historically grown at a steady pace, reflecting management’s confidence in long-term profitability; however, the recent sharp share price correction has elevated the nominal yield above historical averages. While NVO continues returning substantial capital through both dividends and share buybacks, its dividend decisions remain closely tied to operating performance, restructuring impacts, and strategic reinvestment needs tied to its high-growth GLP-1 pipeline.
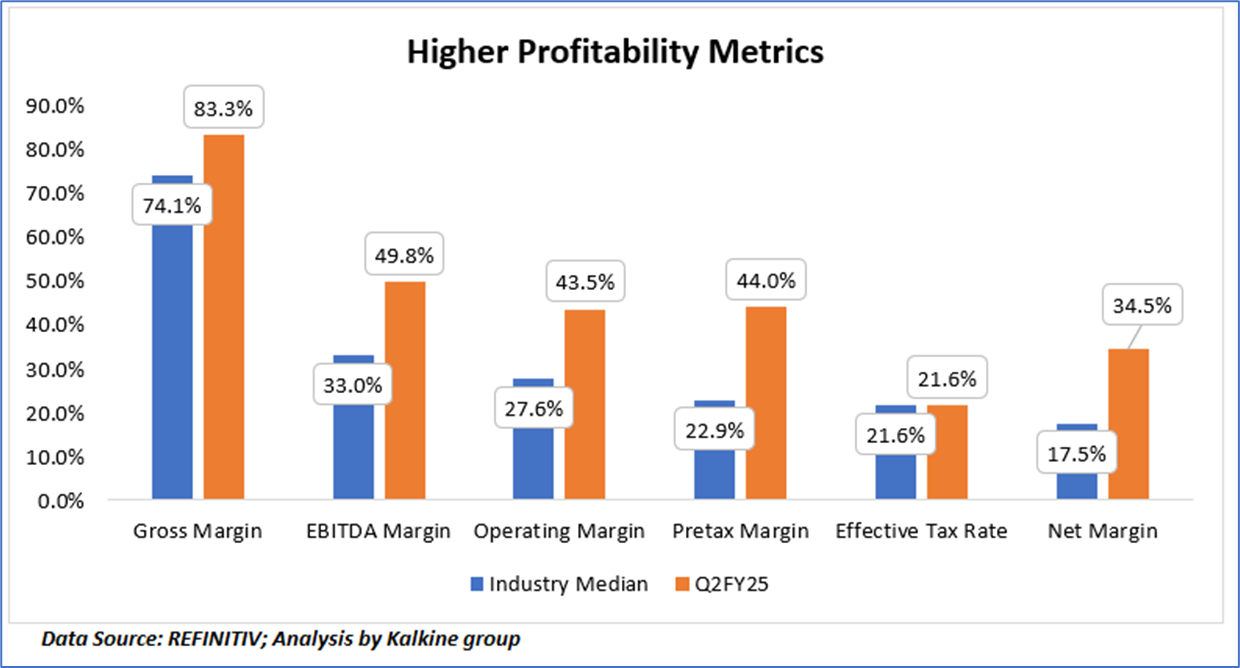
1.5 Key Metrics
Novo Nordisk’s Q2FY25 profitability metrics significantly outperform industry medians across every major measure, underscoring the company’s exceptional operating efficiency and pricing power driven by its GLP-1 diabetes and obesity portfolio. Gross margin of 83.3% vs. the industry’s 74.1% highlights NVO’s advantaged cost structure and premium product mix, while its EBITDA (49.8%) and operating margins (43.5%) far exceed sector norms, reflecting disciplined cost control and strong scalability despite ongoing restructuring expenses. Pretax and net margins of 44.0% and 34.5%, roughly double industry medians, reinforce the company’s superior profitability engine even as competition intensifies. Notably, NVO’s effective tax rate aligns exactly with the industry median (21.6%), indicating that margin outperformance stems from core operations rather than tax advantages, collectively positioning NVO as one of the most financially robust players in global biopharma.
Section 2: Business Updates and Financial Highlights
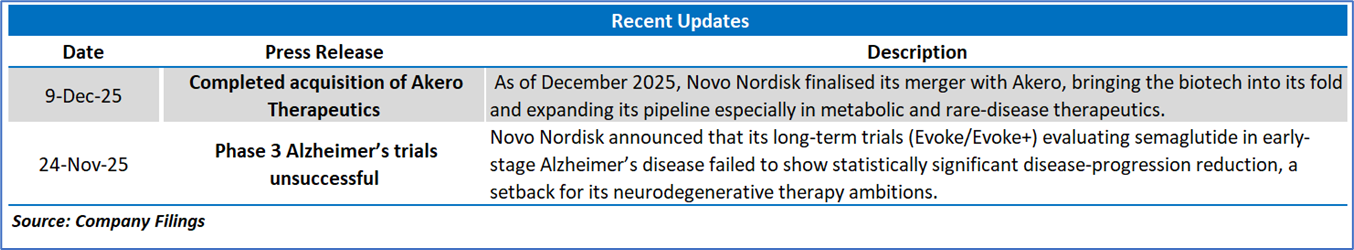
2.1 Recent Updates:
The below picture gives an overview of the recent updates:
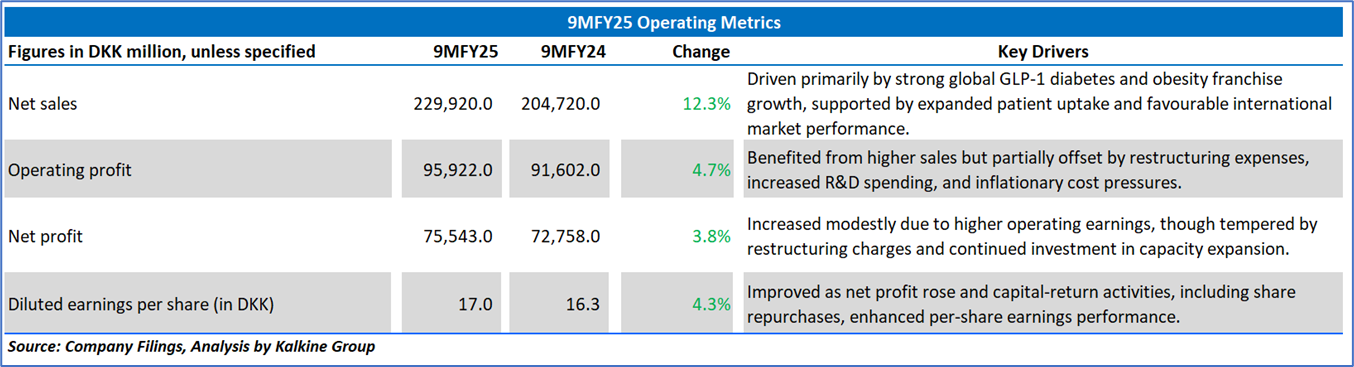
2.2 Insights of 9MFY25:
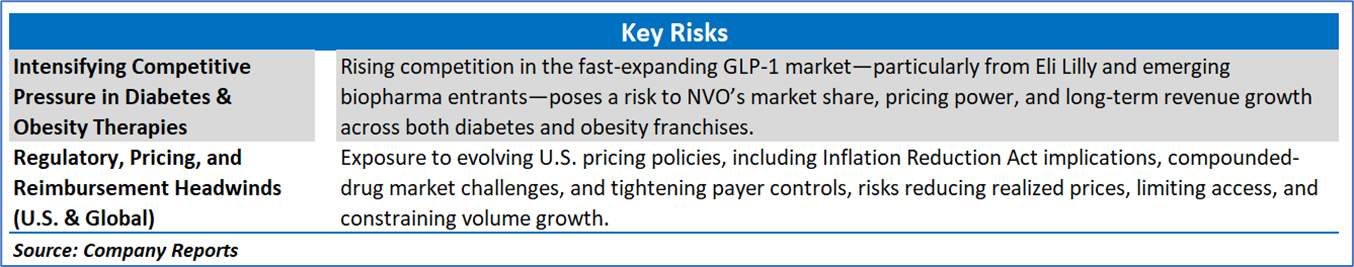
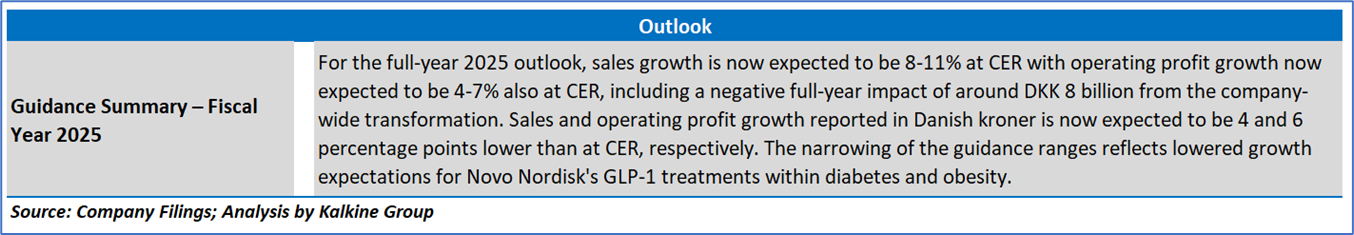
Section 3: Key Risks and Outlook:
Section 4: Stock Recommendation Summary:
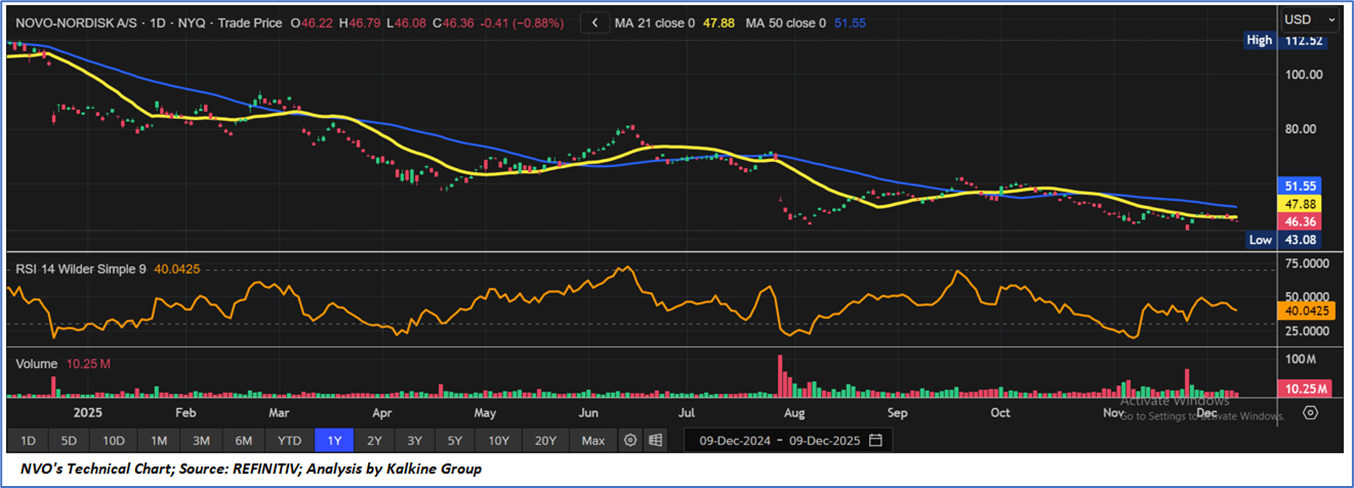
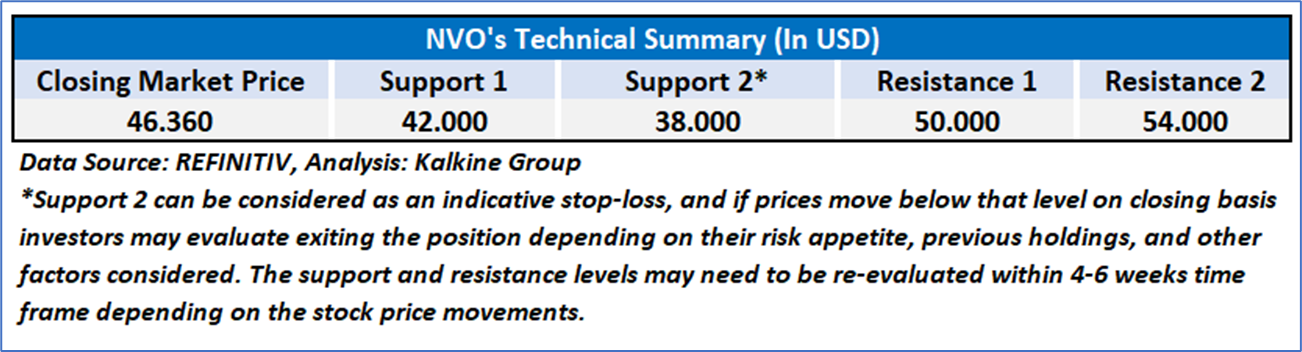
4.1 Technical Summary:
Price Performance:
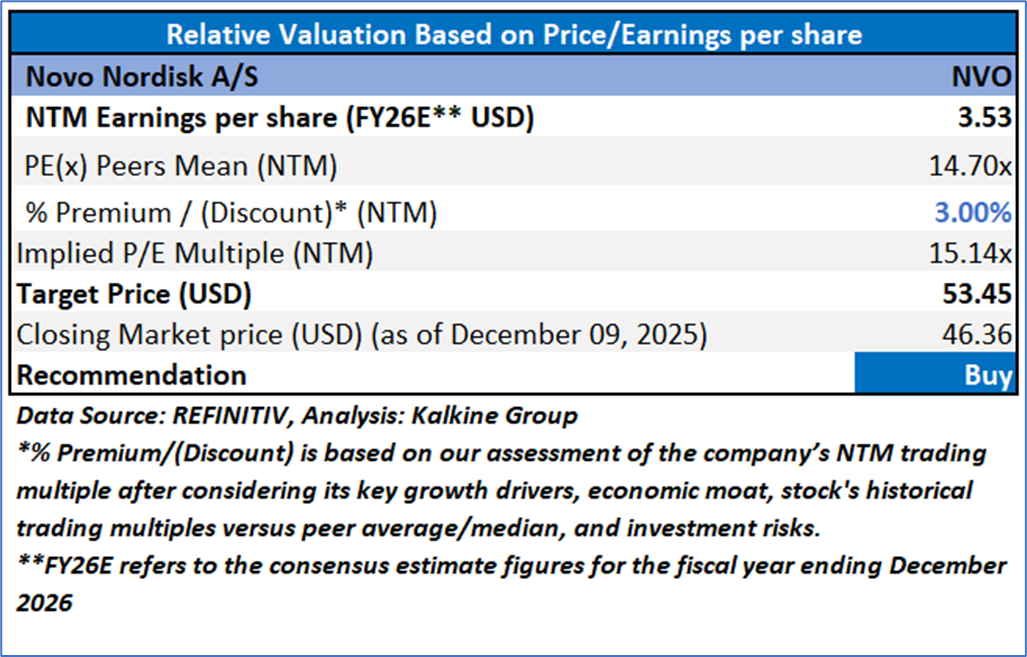
4.2 Fundamental Valuation
Valuation Methodology: Price/Earnings Per Share Multiple Based Relative Valuation

Markets are trading in a highly volatile zone currently due to certain macroeconomic issues and geopolitical tensions prevailing. Therefore, it is prudent to follow a cautious approach while investing.
Note 1: Past performance is not a reliable indicator of future performance.
Note 2: The reference date for all price data, currency, technical indicators, support, and resistance levels is December 09, 2025. The reference data in this report has been partly sourced from REFINITIV.
Note 3: Investment decisions should be made depending on an individual's appetite for upside potential, risks, holding duration, and any previous holdings. An 'Exit' from the stock can be considered if the Target Price mentioned as per the Valuation and or the technical levels provided has been achieved and is subject to the factors discussed above.
Note 4: The report publishing date is as per the Pacific Time Zone.
Technical Indicators Defined: -
Support: A level at which the stock prices tend to find support if they are falling, and a downtrend may take a pause backed by demand or buying interest. Support 1 refers to the nearby support level for the stock and if the price breaches the level, then Support 2 may act as the crucial support level for the stock.
Resistance: A level at which the stock prices tend to find resistance when they are rising, and an uptrend may take a pause due to profit booking or selling interest. Resistance 1 refers to the nearby resistance level for the stock and if the price surpasses the level, then Resistance 2 may act as the crucial resistance level for the stock.
Stop-loss: It is a level to protect against further losses in case of unfavorable movement in the stock prices.
This report (“Report”) has been issued by Kalkine New Zealand Limited (FSP691351) (NZBN:9429047678101) (“Kalkine”). Kalkine is a Financial Advice Provider (“FAP”) and is authorised by a Class 1 Financial Advice Provider Licence issued by Financial Markets Authority (“FMA”) to provide financial advice. Kalkine provides only general financial advice through its research reports following a person becoming a member. The reports contain buy/sell/hold and other recommendations in relation to equity securities, managed funds and other managed investment schemes and other financial advice products. The recommendations and opinions in this Report and on Kalkine website do not take into account any of your investment objectives, financial situation or needs. Before you make a decision about whether to acquire a financial product, you should obtain the Product Disclosure Statement from the product issuer. You should consider the appropriateness of advice taking into account your own objectives, financial situation and needs and seek independent financial advice before making any financial decisions. If you act on the advice in the research reports, you may have to pay fees, expenses or other amounts (but not to Kalkine).
The information in this Report and on the Kalkine website has been prepared from a wide variety of sources, which Kalkine, to the best of its knowledge and belief, considers accurate. Kalkine has made every effort to ensure the reliability of the information contained in its reports (including this Report), newsletters and websites. All information represents our views at the date of publication and may change without notice.
Kalkine does not issue, sell or deal in any financial products. The information in this Report does not constitute an offer to sell securities or other financial products or a solicitation of an offer to buy securities or other financial products. Our reports contain general recommendations to invest in securities and other financial products. Kalkine is not responsible for, and does not guarantee, the performance of, or returns on, any investments mentioned in this Report.
This Report may contain information on past performance of particular investments. Past performance is not a reliable indicator of future performance. Returns stated do not take into account transaction costs and taxes.
Further information about the complaints and dispute resolution process, as well as information about Kalkine’s duties are available on Kalkine’s website. Please read our Financial Advice Provider (FAP) disclosure statement and Complaints Handling Guide, which are available on the website.
Copyright 2025 Krish Capital Pty. Ltd. (ABN 61629651510). All Rights Reserved. No part of this Report, or its content, may be reproduced in any form without our prior consent.
Past performance is not a reliable indicator of future performance.
 Please wait processing your request...