
Section 1: Company Overview and Fundamentals
1.1 Company Overview:
Omega Healthcare Investors, Inc. (NYSE: OHI) is a real estate investment trust (REIT). The Company operates through a single segment, which invests in healthcare-related real estate properties located in the United States and the United Kingdom. Its core business is to provide financing and capital to the long-term healthcare industry with a particular focus on skilled nursing facilities (SNFs), assisted living facilities (ALFs), and to a lesser extent, independent living facilities (ILFs), rehabilitation and acute care facilities (specialty facilities) and medical office buildings (MOBs).
Kalkine’s Dividend Income Report covers the Company Overview, Key positives & negatives, Investment summary, Key investment metrics, Top 10 shareholding, Business updates and insights into company recent financial results, Key Risks & Outlook, Price performance and technical summary, Target Price, and Recommendation on the stock.
Price Performance:
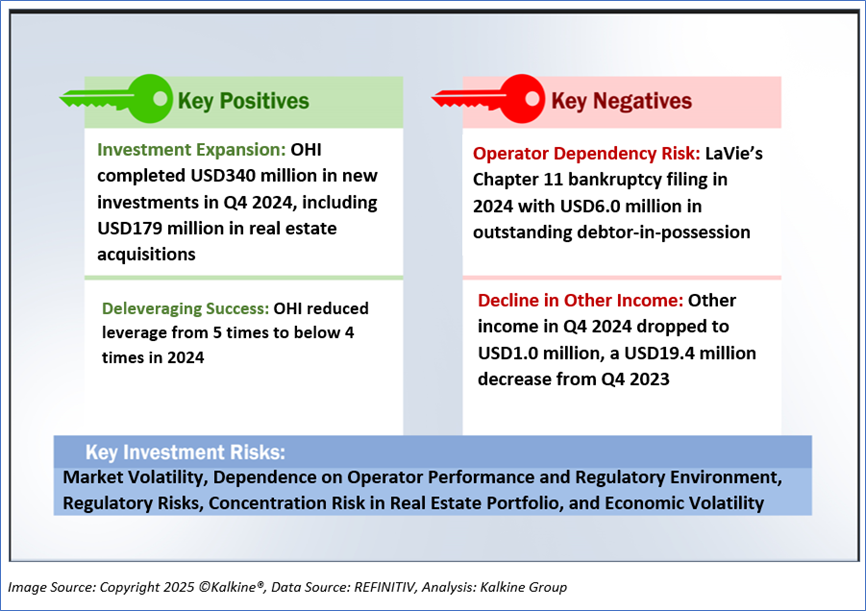
1.2 The Key Positives, Negatives, and Investment summary
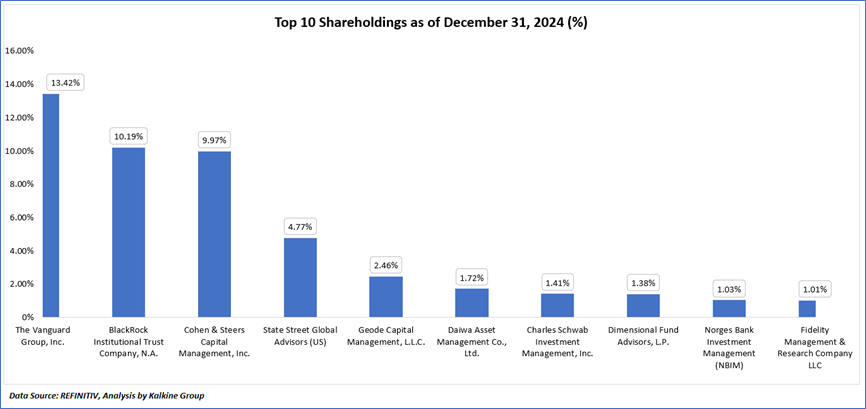
1.3 Top 10 shareholders:
The top 10 shareholders together form ~47.36% of the total shareholding, signifying concentrated shareholding. The Vanguard Group, Inc. and BlackRock Institutional Trust Company, N.A., are the biggest shareholders, holding the maximum stake in the company at ~13.42% and ~10.19%, respectively.
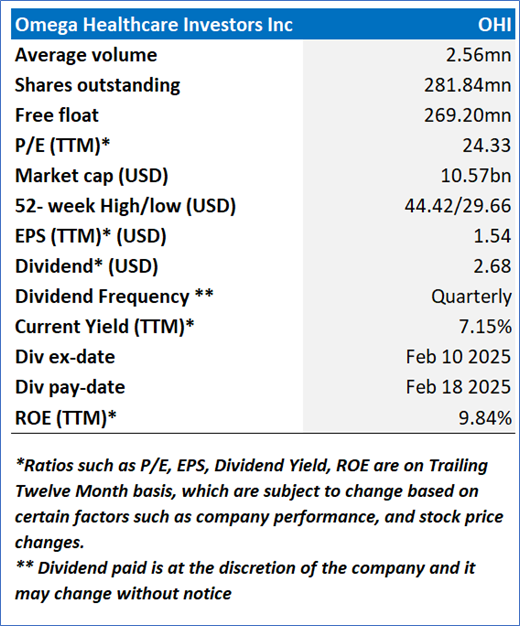
1.4 Dividend payments with impressive dividend yield:
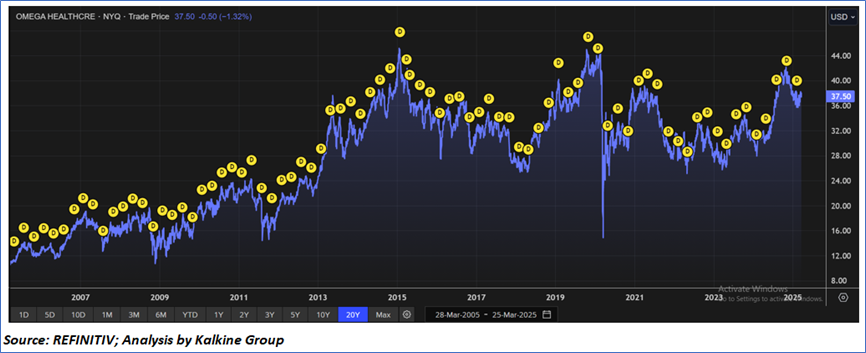
Omega Healthcare Investors, Inc. (OHI) has a consistent history of paying quarterly dividends, with its most recent declaration on January 29, 2025, setting a cash dividend of USD0.67 per share, payable on February 18, 2025, to shareholders of record by February 10, 2025, reflecting its commitment to delivering stable returns to investors. The stock chart indicates a trade price of USD37.50 as of March 25, 2025, which, with an annual dividend of USD2.68 (USD0.67 quarterly), implies a current dividend yield of approximately 7.15%, a competitive figure for a REIT. OHI’s ability to maintain this yield is supported by its strong Funds Available for Distribution (FAD), which grew to USD202 million, or USD0.70 per share, in Q4 2024, alongside a reduced dividend payout ratio in 2024, as noted by CEO Taylor Pickett. However, the chart also shows periods of volatility, such as the sharp decline around 2020, highlighting potential risks to dividend stability from market or sector-specific challenges, though OHI’s recent deleveraging and operational improvements bolster its capacity to sustain dividends
1.5 Key Metrics
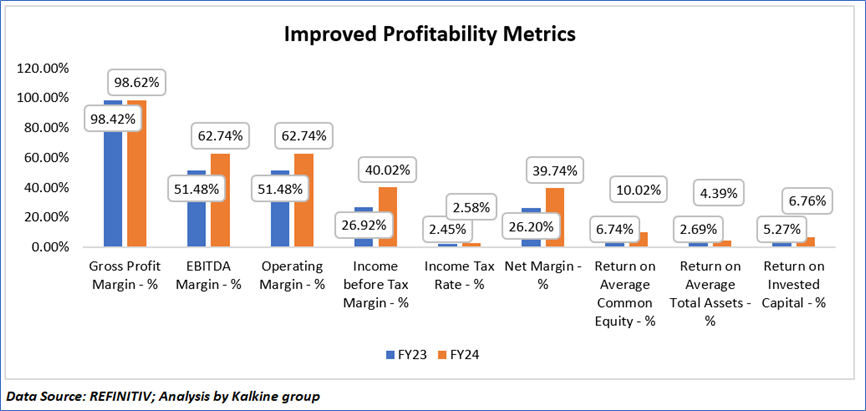
Omega Healthcare Investors, Inc. (OHI) demonstrated significant financial improvement in FY24, with its EBITDA and operating margins both rising to 62.74% from 51.48% in FY23, reflecting enhanced operational efficiency, while net margin increased to 39.74% from 26.20%, driven by a USD169 million rise in net income to USD417.8 million. Return on average common equity improved to 10.02% from 6.74%, return on average total assets grew to 4.39% from 2.69%, and return on invested capital rose to 6.76% from 5.27%, indicating better capital utilization and profitability. However, the gross profit margin slightly declined to 98.62% from 98.42%, and the income tax rate edged up to 2.58% from 2.45%, suggesting minor pressures on profitability. Overall, OHI’s FY24 performance underscores its ability to grow earnings and improve returns, supported by strategic investments and deleveraging, though slight margin pressures warrant monitoring.
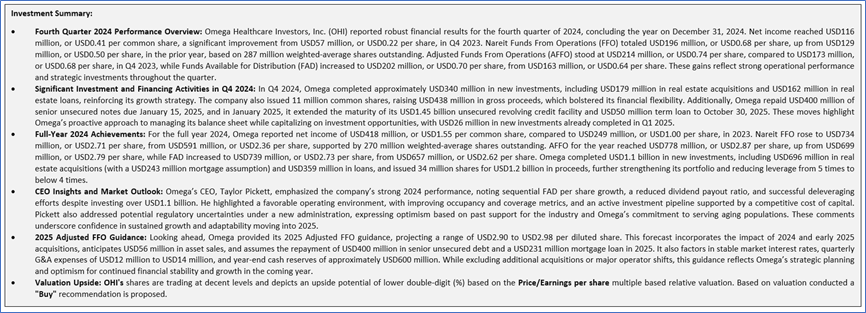
Section 2: Business Updates and Financial Highlights
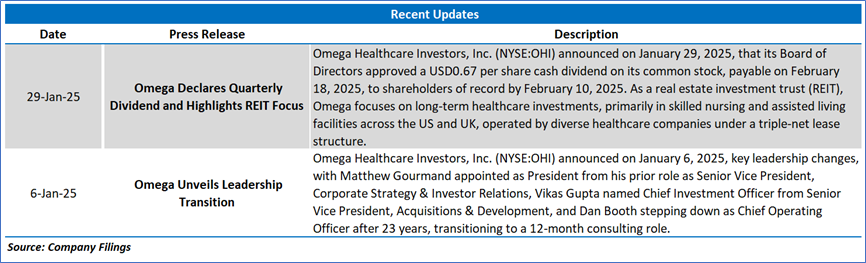
2.1 Recent Updates:
The below picture gives an overview of the recent updates:
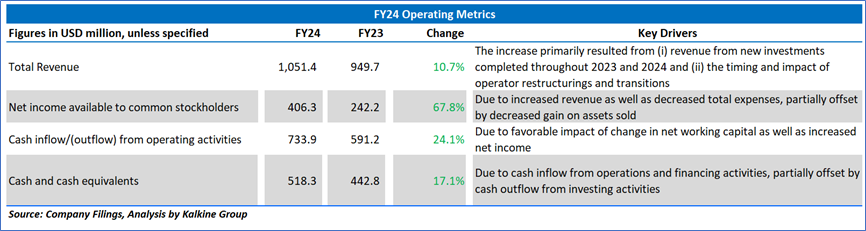
2.2 Insights of FY24:
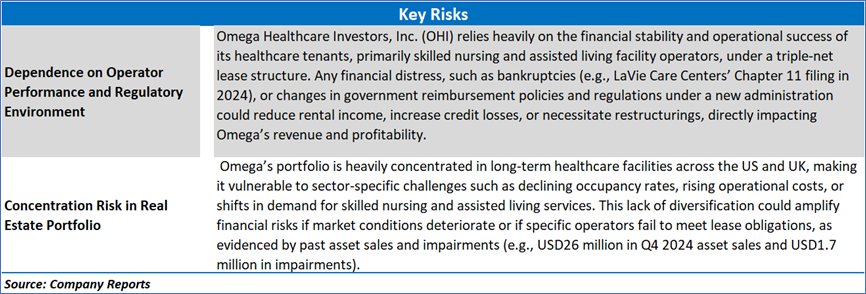
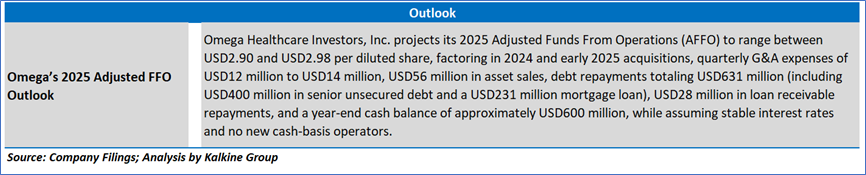
Section 3: Key Risks and Outlook:
Section 4: Stock Recommendation Summary:
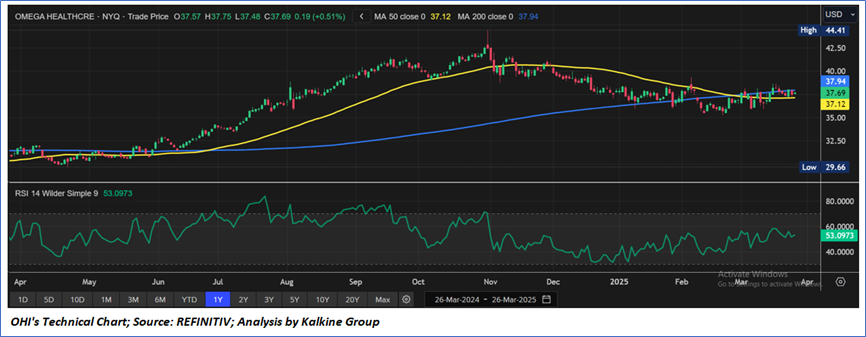
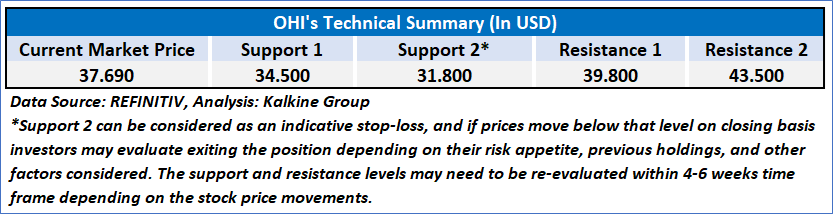
4.1 Technical Summary:
Price Performance:
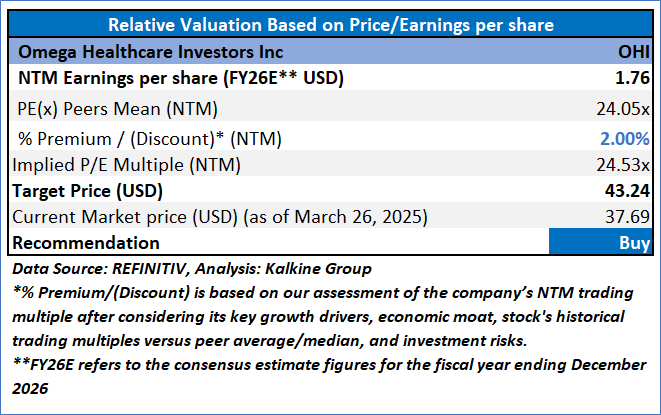
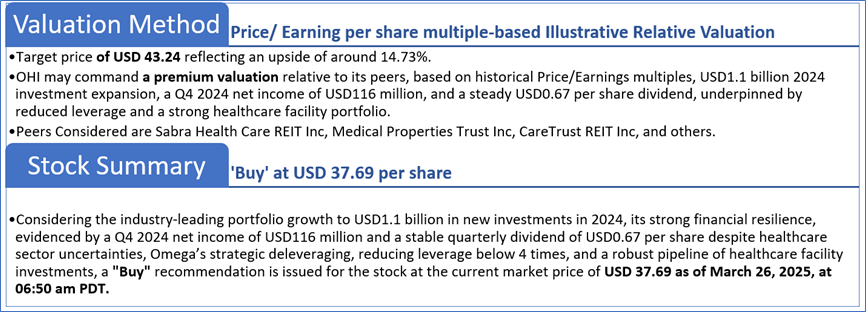
4.2 Fundamental Valuation
Valuation Methodology: Price/Earnings Per Share Multiple Based Relative Valuation
Markets are trading in a highly volatile zone currently due to certain macroeconomic issues and geopolitical tensions prevailing. Therefore, it is prudent to follow a cautious approach while investing.
Note 1: Past performance is not a reliable indicator of future performance.
Note 2: The reference date for all price data, currency, technical indicators, support, and resistance levels is March 26, 2025. The reference data in this report has been partly sourced from REFINITIV.
Note 3: Investment decisions should be made depending on an individual's appetite for upside potential, risks, holding duration, and any previous holdings. An 'Exit' from the stock can be considered if the Target Price mentioned as per the Valuation and or the technical levels provided has been achieved and is subject to the factors discussed above.
Note 4: The report publishing date is as per the Pacific Time Zone.
Technical Indicators Defined: -
Support: A level at which the stock prices tend to find support if they are falling, and a downtrend may take a pause backed by demand or buying interest. Support 1 refers to the nearby support level for the stock and if the price breaches the level, then Support 2 may act as the crucial support level for the stock.
Resistance: A level at which the stock prices tend to find resistance when they are rising, and an uptrend may take a pause due to profit booking or selling interest. Resistance 1 refers to the nearby resistance level for the stock and if the price surpasses the level, then Resistance 2 may act as the crucial resistance level for the stock.
Stop-loss: It is a level to protect against further losses in case of unfavorable movement in the stock prices.
Disclaimer This report has been issued by Kalkine New Zealand Limited (FSP691351) (NZBN:9429047678101) (“Kalkine”). Kalkine is a Financial Advice Provider (“FAP”) and is authorised by a Class 1 Financial Advice Provider Licence issued by Financial Markets Authority (“FMA”) to provide financial advice. Kalkine provides only general financial advice through its research reports following a person becoming a member. The reports contain buy/sell/hold and other recommendations in relation to equity securities, managed funds and other managed investment schemes and other financial advice products. The recommendations and opinions in this report and on Kalkine website do not take into account any of your investment objectives, financial situation or needs. Before you make a decision about whether to acquire a financial product, you should obtain the Product Disclosure Statement from the product issuer. You should consider the appropriateness of advice taking into account your own objectives, financial situation and needs and seek independent financial advice before making any financial decisions. If you act on the advice in the research reports, you may have to pay fees, expenses or other amounts (but not to Kalkine). Further information about the complaints and dispute resolution process, as well as information about Kalkine’s duties are available on Kalkine’s website. Please read our Financial Advice Provider (FAP) disclosure statement and Complaints Handling Guide, which are available on the website.
Past performance is not a reliable indicator of future performance.
 Please wait processing your request...