
Company Overview: NZX Limited (NZX: NZX) is a leading exchange of New Zealand that operates in securities, derivatives and energy markets. Its segments include Markets, Funds Services, and Corporate. The Company's Markets segment is an operator and regulator of securities and derivatives markets and provider of trading, post-trade and data services for securities and derivatives, as well as the provider of a central securities depository. Its Funds Services segment is a provider of superannuation, KiwiSaver and Exchange Traded Funds and funds administration platforms.
NZX Details
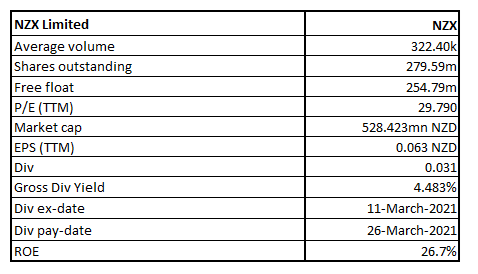
NZX Limited (NZX: NZX) operates New Zealand’s equity, debt, derivatives, and energy markets. It also provides clearing, trading, depository, settlement, and data services. The company has a market capitalization of ~$528.423 million as on 9th August 2021.
Looking at the past performance, NZX’s top-line and bottom-line for FY16-20 grew with a compounded annual growth rate (CAGR) of 0.29% and 17.65%, respectively. Its total revenue for FY20 stood at $78.43 million, as compared to $77.54 million in FY16. Its net income for FY20 stood at $17.59 million, as compared to $9.18 million in FY16.
Exhibit 1: Operating Performance
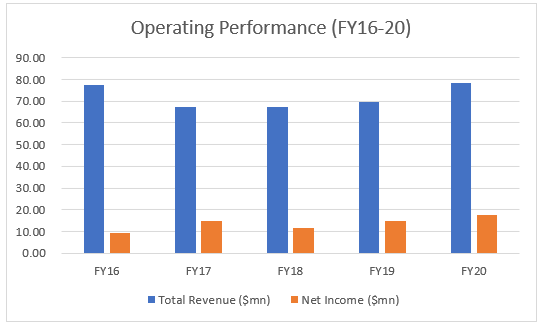
(Source: Company Reports, Analysis by Kalkine Group)
Financial Performance (Year ended 31 December 2020 – FY20)
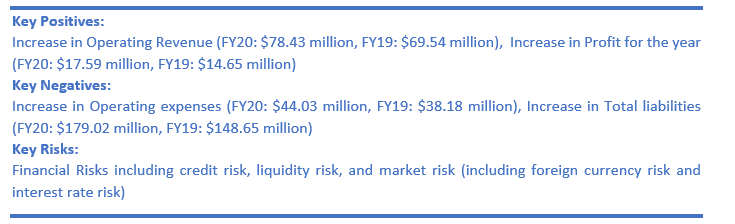
Total Revenue up 12.8%: The company’s revenue from continuing operations for full-year period stood at $78.43 million, an increase of 12.8% on the previous year. The revenue growth came from across its capital markets, smartshares and wealth technologies. Securities trading and clearing revenues were strongly up with listing and data revenues also showing good growth. However, the year also witnessed a 15.3% YoY increase in operating expenses to $44.03 million which could be attributed to increased spend in technology, investing in staff and sales opportunities. Increased operating expenses caused EBITDA to register a moderate growth of 9.7% YoY to $34.4 million. Total net profit for the full-year period stood at $17.59 million, an increase of 20.1% on the previous year.
Decent Dividend for FY20: The board of directors declared a final dividend of 3.1 cents per share, contributing to a FY20 dividend of 6.1 cents per share, fully imputed. Higher dividend along with a strong appreciation in NZX’s share price, helped the company to deliver total shareholder return (TSR) of 50.3% for FY20.
Volume Traded Up 149%: The year witnessed an increase of 149% in the volume traded, and 42% increase in the value traded to $53.7 billion compared with $37.8 billion in the previous year.
Exhibit 2: Income Statement
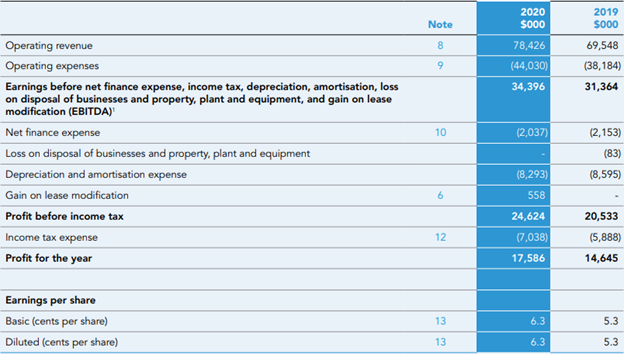
(Source: Company Reports)
Top 10 Shareholders: The top 10 shareholders have been highlighted in the pie chat, which together form around 28.78% of the total shareholding. Accident Compensation Corporation and Aberdeen Asset Managers Ltd. are holding a maximum stake in the company at 6.16% and 5.23%, respectively. ,
Exhibit 3: Top 10 Shareholders
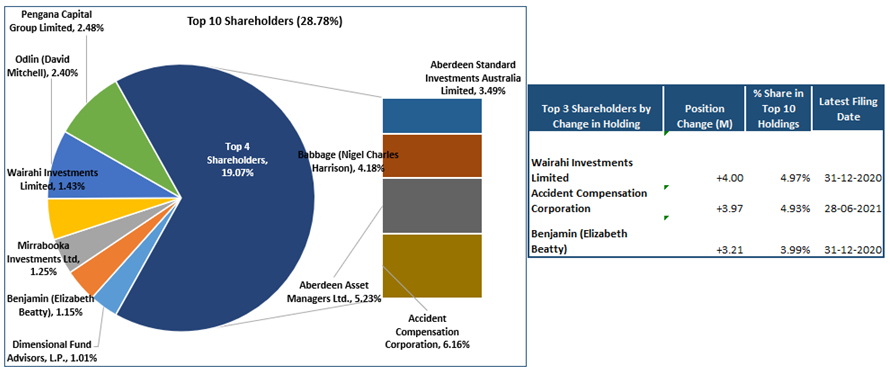
Source: Analysis by Kalkine Group
A Quick Look at Key Metrics: The company’s EBITDA margin and net margin for FY20 stood at a strong level of 43.9% and 22.4%, respectively, implying improved operational efficiency in terms of managing operational and non-operational costs. Its current ratio and cash cycle days reflect decent liquidity position.
Exhibit 4: Key Metrics
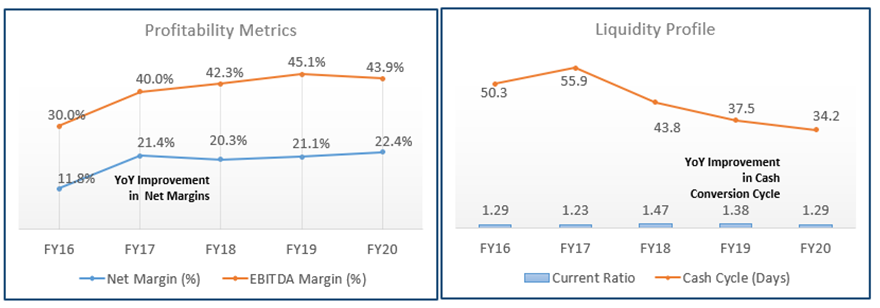
Source: Analysis by Kalkine Group
Recent Update:
Outlook:
Improvement in Investor Experience: The ongoing strategic progress from removing the fixed-fee elements of trade fees and improving rules to support price transparency have been attracting new participants and investors to the NZX. This development is opening up access to a broader range of investors resulting in improved liquidity to the exchange. Alongside the increase in value traded across the NZX, it is expected to continue to observe growth in on-market liquidity levels which have now normalised above 60%.
Emphasis on Improvement in Technology: The company has identified certain issues that have affected its technology platforms and market participants in 2020 and has felt the need for further investment in technology to enhance platform stability and resilience, and deliver other improvements, confirming additional spend on people and systems in 2021.
FY21 Guidance: The company expects its 2021 operating earnings to be in the range of $31.5 million to $35.5 million, with guidance subject to market outcomes, particularly with respect to market capitalisation, total capital raised, secondary market value and derivatives volumes traded, funds under management and administration growth and technology costs.
Key Risks:
The company is susceptible to certain risks such as Financial risks which arise on account of adverse strategic decisions (including inappropriate resource allocation); general market risk – including lower numbers of listed issuers, less listing and capital raisings, lower levels of trading activity, market capitalisation declines; counterparty credit risk in operating the clearing house; and operational errors, undetected fraud or poor execution of projects that are designed to deliver the strategy.
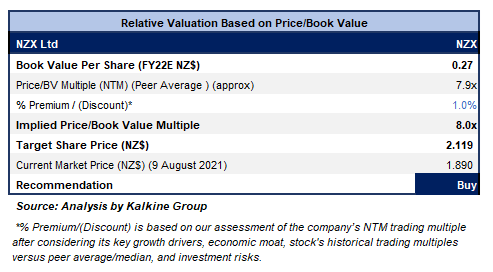
Valuation Methodology: Price/Book Value per Share Based Relative Valuation (Illustrative)
Technical Overview:
Chart:
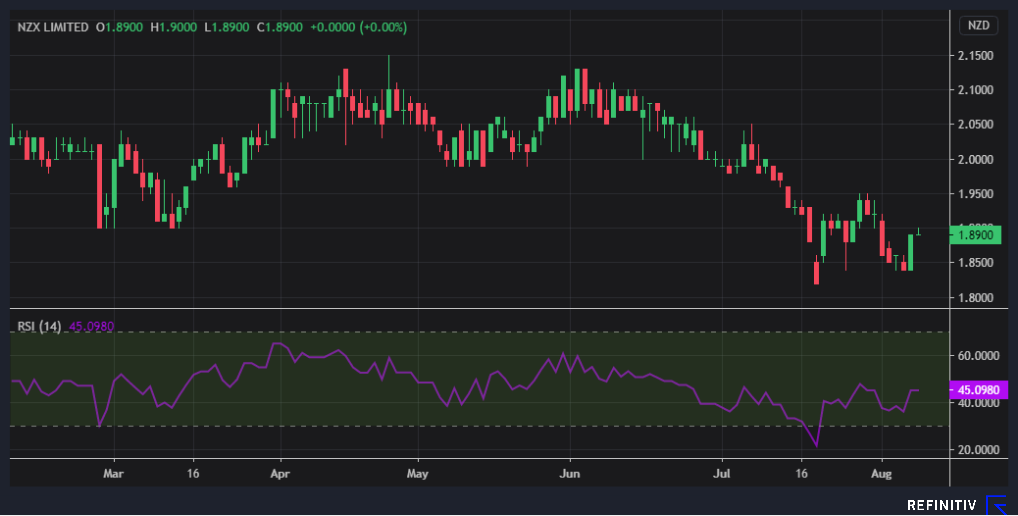
Source: REFINITIV
Note: Purple Color Line Reflects RSI (14-Period)
Stock Recommendation:
The company’s capital expenditure continues to be focused on NZX Wealth Technologies' core platform and NZX’s trading system upgrade, together with strengthening the cybersecurity protection, requiring increased investment. Despite increased operating expenses, the company managed to generate a return on equity of 26.7% for FY20 against the industry median of 9.5%, reflecting on operational efficiency.
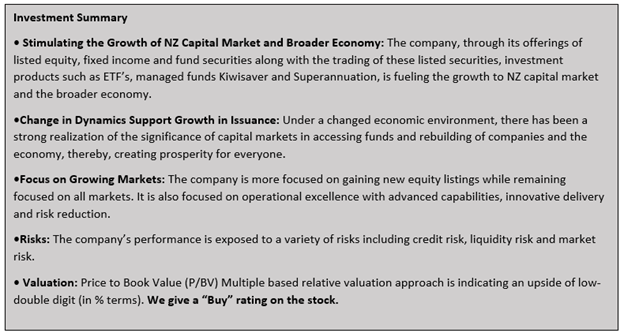
We have applied P/BV multiple based relative valuation (on an illustrative basis) and the target price reflects a rise of low double-digit (in % terms). We have applied a slight premium to Price/BV Multiple (NTM) (Peer Average) considering its focus towards growing markets as well as YoY rise in profit in FY 2020. The stock rose by ~27.5% in 1 year. It has made a 52-week low and high of $1.4500 and $2.1900, respectively.
Hence, we give a “Buy” recommendation on the stock at the current market price of NZ$1.890 per share on 9th August 2021.
Note 1: The reference data in this report has been partly sourced from REFINITIV.
Note 2: Investment decisions should be made depending on the investors’ appetite on upside potential, risks, holding duration, and any previous holdings. Investors can consider exiting from the stock if the Target Price mentioned as per the analysis has been achieved and subject to the factors discussed above alongside support levels provided.
Technical Indicators Defined:-
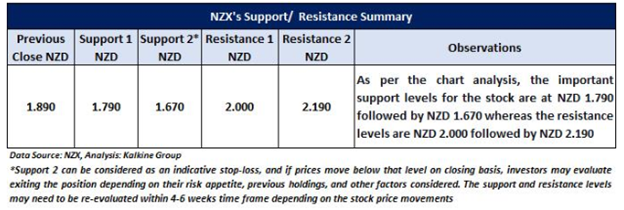
Support: A level where-in the stock prices tend to find support if they are falling, and downtrend may take a pause backed by demand or buying interest.
Resistance: A level where-in the stock prices tend to find resistance when they are rising, and uptrend may take a pause due to profit booking or selling interest.
Stop-loss: It is a level to protect further losses in case of unfavourable movement in the stock prices.
Disclaimer
Kalkine New Zealand Limited is authorised to provide class advice only. The information on this site does not take into account any of your investment objectives, financial situation or needs. Before you make a decision about whether to acquire a financial product, you should obtain the Product Disclosure Statement from the product issuer. You should consider the appropriateness of advice taking into account your own objectives, financial situation and needs and seek independent financial advice before making any financial decisions.
Past performance is not a reliable indicator of future performance.
 Please wait processing your request...