
Company Overview: NZX Limited (NZX: NZX) is engaged in providing an array of quality financial services to its customers both domestic as well as global ranging from operating capital markets infrastructure to managing investors’ assets and providing unique insights. NZX operates New Zealand's equity, debt, funds, derivatives, and energy markets.
NZX Limited
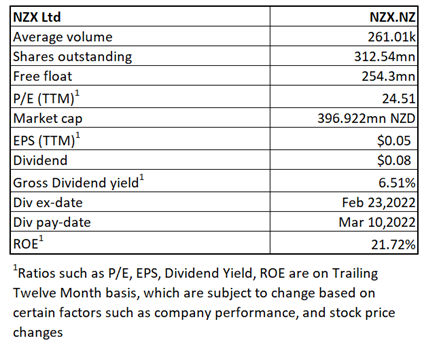
NZX Details
The market capitalisation of the company stood at ~$396.92 million on 20th June 2022.
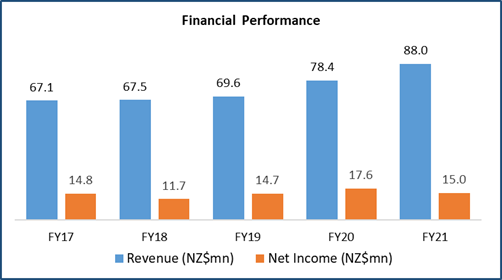
Looking at the past performance over FY17 to FY21, NZX’s top line grew with a compounded annual growth rate (CAGR) of 7.0%. Total Revenue of the company improved from $67.1 million in FY17 to $88.0 million in FY21. Net Income improved from $14.8 million in FY17 to $15.0 million in FY21.
Exhibit 1: Financial Statistics
Source: Analysis by Kalkine Group
Result Performance for FY21 (For the Year Ended 31 December 2021)
Focused Towards Growth Strategy
The company continues to deliver on its strategy to position the group for future growth and high priority is placed on capital listed and raised. Further, it is focusing on partnership to drive growth and attain the potential in the Dairy market. NZX has been making deployments to support scale in Smartshares and Wealth Technologies.
Top 10 Shareholders:
The top 10 shareholders have been highlighted in the table, which together forms ~27.95% of the total shareholding.
Exhibit 2: Top 10 Shareholders
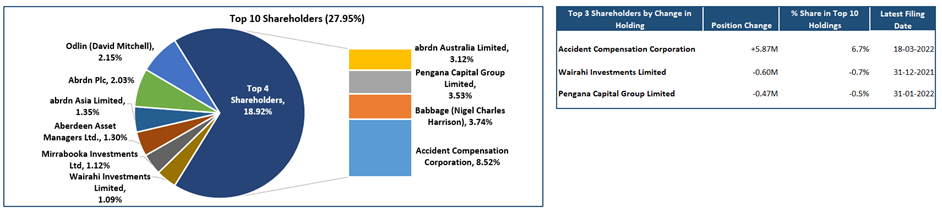
Source: Analysis by Kalkine Group
A Quick Look at Key Metrics:
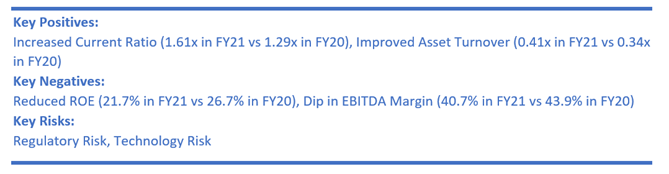
The company has posted an improvement in both EBITDA margin and ROE over FY17-21 to reach 40.7% and 21.7% in FY21, from 40.0% and 20.7% in FY17, respectively. The company’s current ratio expanded to 1.61x in FY21 from 1.23x in FY17. The increase in the current ratio indicates that the company possesses better capabilities to meet short-term obligations.
Exhibit 3: Key Metrics
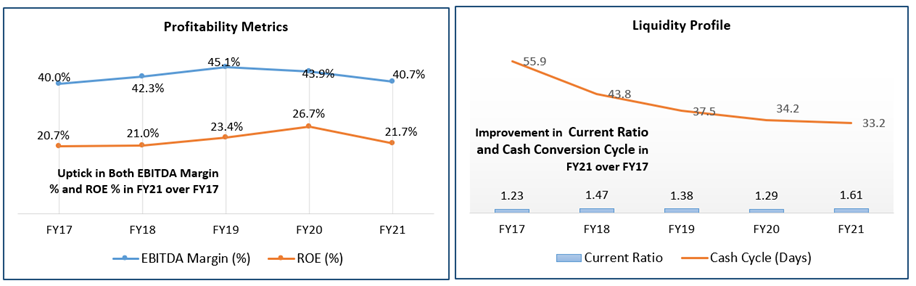
Analysis by Kalkine Group
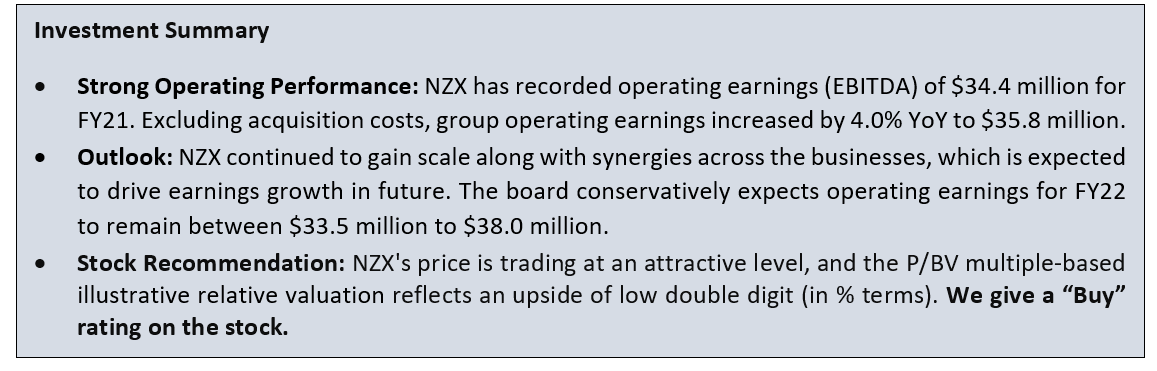
Outlook:
In FY21, the company undertook a step-change in its investment to support additional capacity, capability, and to enhance the security of its operating platform and it expects this to continue in 2022. Driven by impact of increased market volatility and a general tightening in financial conditions, the board conservatively expects operating earnings for FY22 to remain between $33.5 million to $38.0 million.
NZX is pursuing a number of opportunities focused towards growing the business which will require deployments moving forward, under its strategy to develop its markets further as well as deliver greater value to the shareholders over the long term.
Risks:
The company is exposed to various financial risks that may arise due to adverse strategic decisions and general market risks such as lower numbers of listed issuers, lesser listing and capital raisings, and lower levels of trading activity. Further, its business is prone to IT risk as well as cyber security risk.
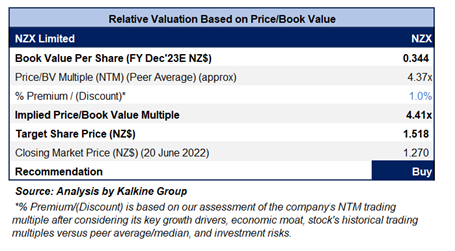
Valuation Methodology: Price/Book Value Per Share Multiple Based Relative Valuation (Illustrative)
Technical Overview:
Chart:
.png)
Source: REFINITIV
Note: Purple Color Line Reflects RSI (14-Period)
.png)
Stock Performance:
The stock is trading lower than the average of the 52-week high price of $2.06 and the 52-week low price of $1.20, which indicates a good opportunity for accumulation.
The stock has been valued using P/BV based relative valuation (on an illustrative basis) and the target price so arrived reflects a rise of low double-digit (in % terms). A slight premium has been applied to P/BV Multiple (NTM) (Peer Average) considering its strong operating earnings in FY21 as well as strategic growth investment.
Markets are trading in a highly volatile zone currently due to certain macro-economic issues and geopolitical tensions prevailing. Therefore, it is prudent to follow a cautious approach while investing.
Considering the aforementioned factors, we give a “Buy” recommendation on the stock at the closing market price of $1.270 per share, down by 1.55% on 20th June 2022.
Note 1: The reference data in this report has been partly sourced from REFINITIV.
Note 2: Investment decisions should be made depending on the investors’ appetite on upside potential, risks, holding duration, and any previous holdings. Investors can consider exiting from the stock if the Target Price mentioned as per the analysis has been achieved and subject to the factors discussed above alongside support levels provided.
Technical Indicators Defined:-
Support: A level where-in the stock prices tend to find support if they are falling, and downtrend may take a pause backed by demand or buying interest.
Resistance: A level where-in the stock prices tend to find resistance when they are rising, and uptrend may take a pause due to profit booking or selling interest.
Stop-loss: It is a level to protect further losses in case of unfavourable movement in the stock prices.
Disclaimer
Kalkine New Zealand Limited is authorised to provide general advice only. The information on this website does not take into account any of your investment objectives, financial situation or needs. Before you make a decision about whether to acquire a financial product, you should obtain the Product Disclosure Statement from the product issuer. You should consider the appropriateness of advice taking into account your own objectives, financial situation and needs and seek independent financial advice before making any financial decisions.
Past performance is not a reliable indicator of future performance.
 Please wait processing your request...