
Section 1: Company Overview and Fundamentals
1.1 Company Overview:
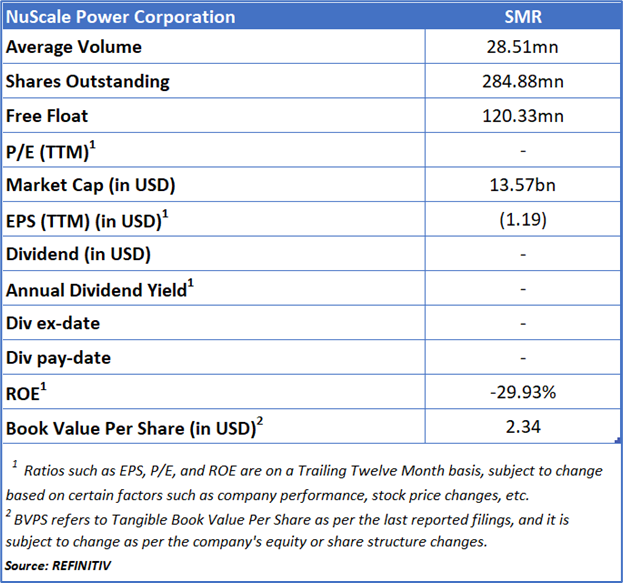
NuScale Power Corporation (NYSE: SMR) specializes in developing and delivering proprietary advanced small modular reactor (SMR) nuclear technologies.
Kalkine’s Low Carbon Research Report covers the Investment Highlights, Low Carbon Emission Initiatives, Key Financial Metrics, Risks, and Technical Analysis along with the Valuation, Target Price, and Recommendation on the stock.
Stock Performance:
1.2 Why do Low Carbon Emissions matter?
The shift toward a low-carbon economy is one of the most significant challenges of current time, spurred by the urgent need to combat climate change and reduce the environmental impact of corporate activities. This report covers the US-listed low-carbon emission company NuScale Power Corporation (NYSE: SMR), that is committed to sustainability and responsible environmental practices.
Carbon and Waste Management - Key Metrics
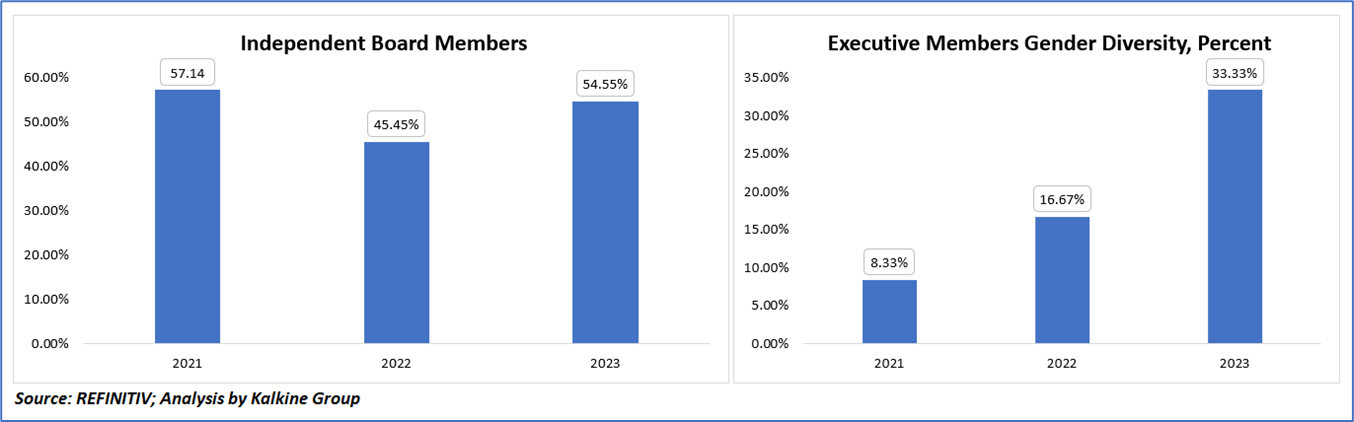
Between 2021 and 2023, NuScale Power demonstrated evolving trends in governance composition and leadership diversity. The proportion of independent board members fluctuated, declining from 57.14% in 2021 to 45.45% in 2022 before rebounding to 54.55% in 2023, reflecting adjustments in board structure while maintaining a generally strong level of independent oversight. In contrast, executive gender diversity showed consistent and substantial improvement, rising from 8.33% in 2021 to 16.67% in 2022 and further to 33.33% in 2023, indicating sustained efforts to enhance female representation in leadership roles. Overall, while board independence exhibited short-term variability, the continued advancement in gender diversity highlights NuScale’s growing focus on inclusive leadership and balanced corporate governance.
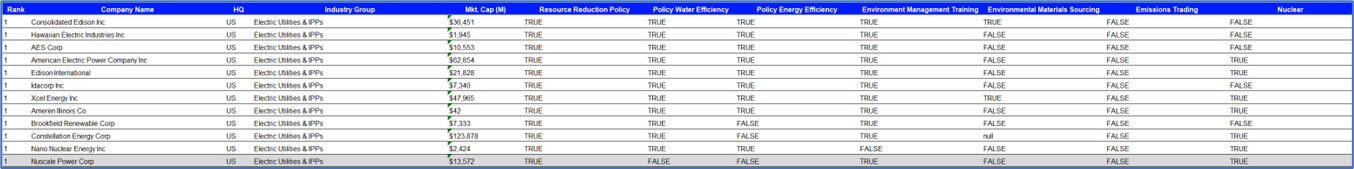
Peer Comparison:
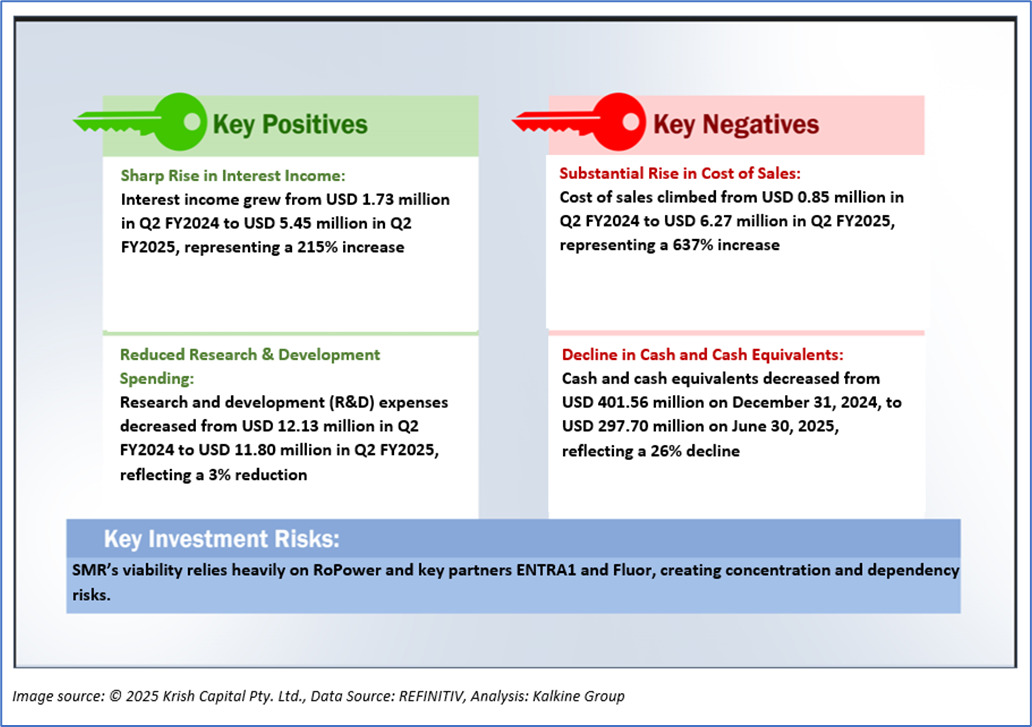
1.2 The Key Positives, Negatives, and Investment summary
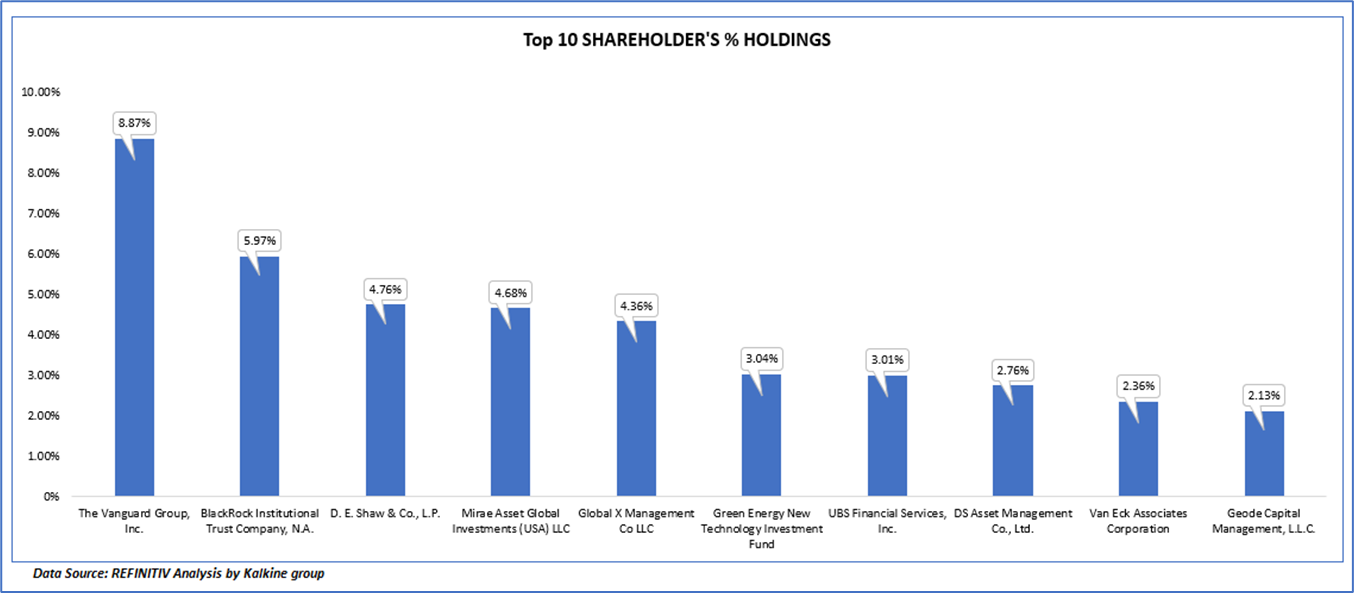
1.3 Top 10 shareholders:
The top 10 shareholders together form ~41.93% of the total shareholding, signifying concentrated shareholding. The Vanguard Group, Inc. and BlackRock Institutional Trust Company, N.A. are the biggest shareholders, holding the maximum stake in the company at 8.87% and 5.97%, respectively.
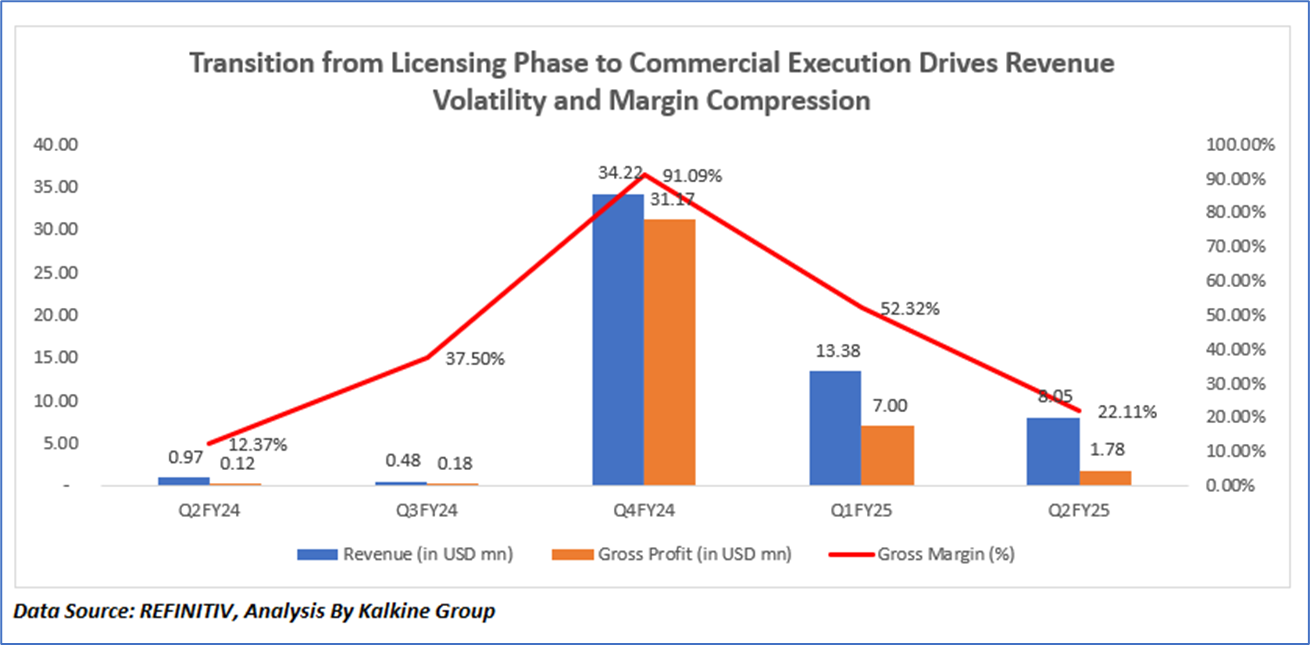
1.4 Key Metrics
The chart reflects NuScale Power Corporation’s transition from a development-focused to a commercialization-driven business model between Q2 FY2024 and Q2 FY2025. Revenue rose sharply from USD 0.97 million in Q2 FY2024 to a peak of USD 34.22 million in Q4 FY2024, primarily due to milestone-based recognition of engineering and licensing revenues from Fluor and RoPower’s Doicești project in Romania. This revenue spike also drove an exceptional gross margin of 91% in Q4 FY2024, reflecting a mix dominated by high-value documentation and design work with minimal associated costs. However, as the company moved into Q1 FY2025, margins normalized to 52%, with revenue at USD 13.38 million, due to a shift toward engineering execution that carried higher labor and material expenses. By Q2 FY2025, revenue moderated to USD 8.05 million and gross margin declined further to 22%, driven by rising project execution costs, long-lead material procurement, and subcontracting activities. Overall, the trend underscores NuScale’s transition from low-cost design phases to cost-intensive implementation, causing margin compression even as operational scale and commercialization efforts expanded.
Section 2: Business Updates and Corporate Business Highlights
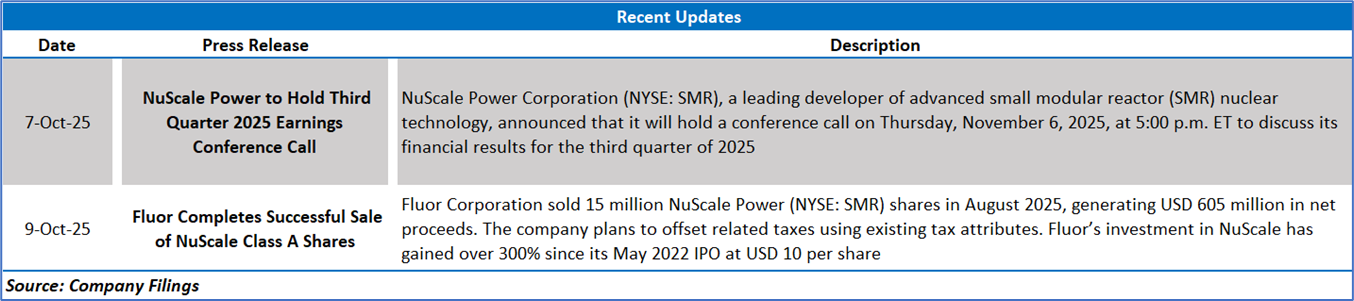
2.1 Key Business Updates:
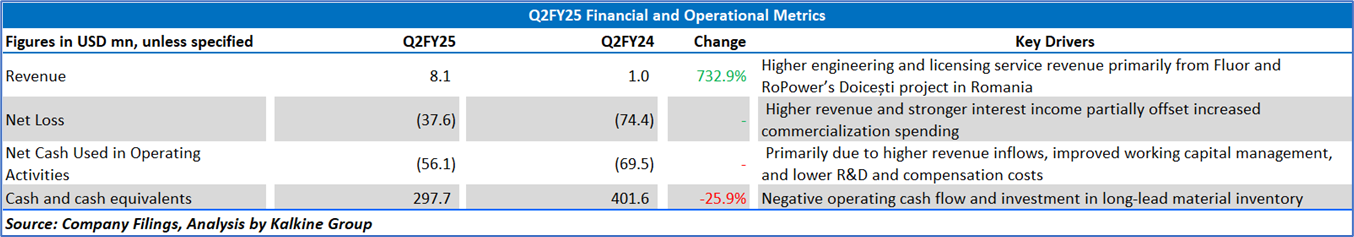
2.2 Insights of Q2 FY25:
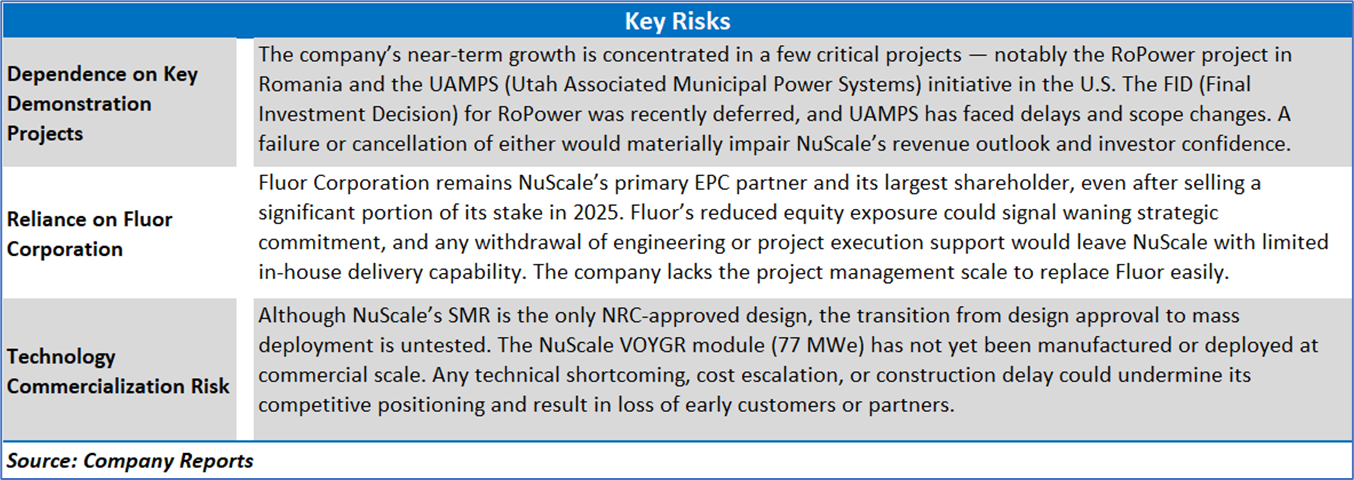
Section 3: Key Risks & Outlook
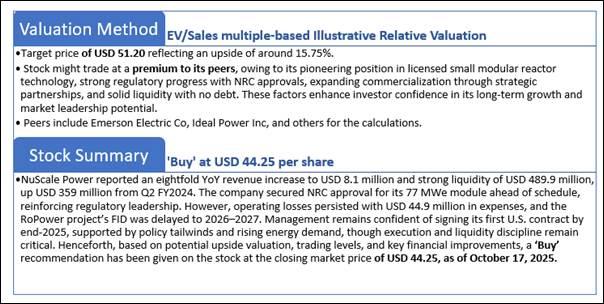
Section 4: Stock Recommendation Summary:
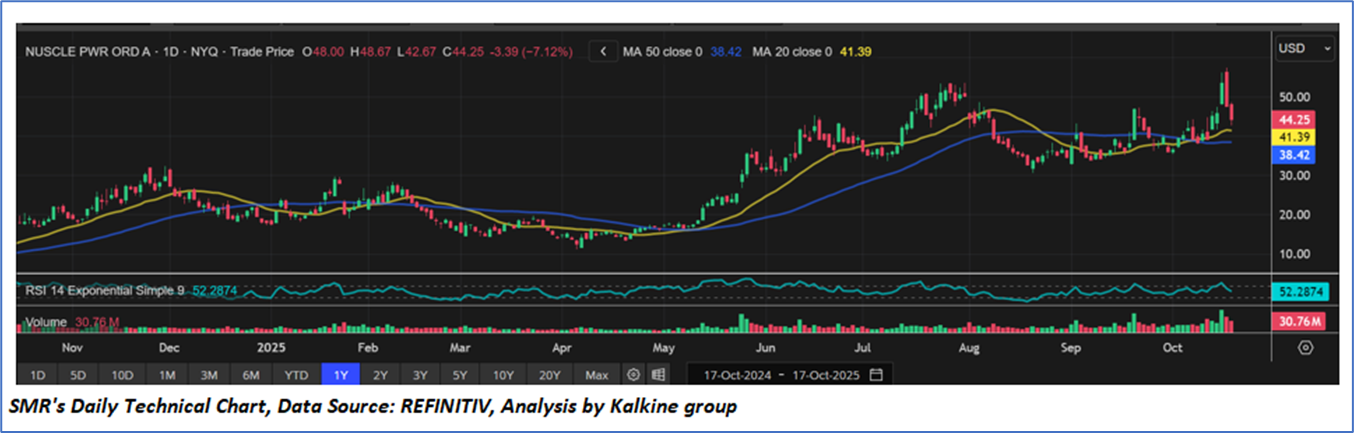
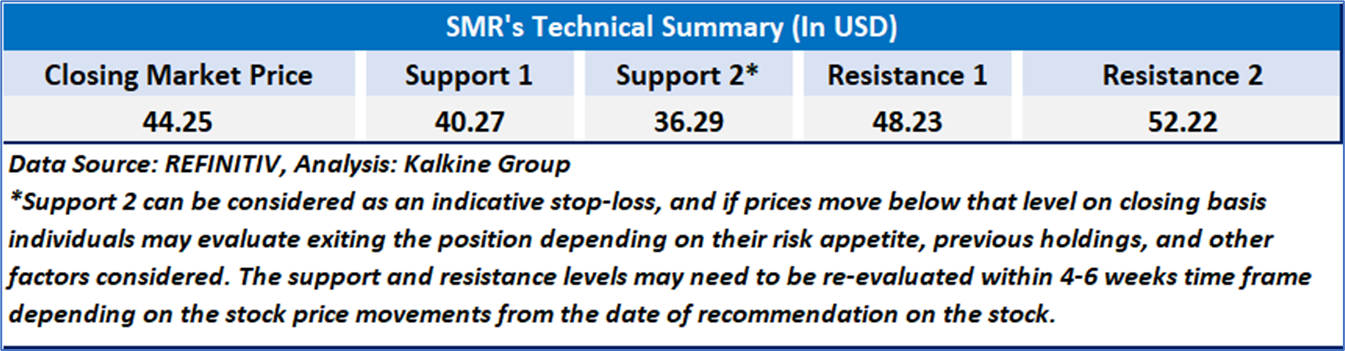
4.1 Price Performance and Technical Summary:
Stock Performance:
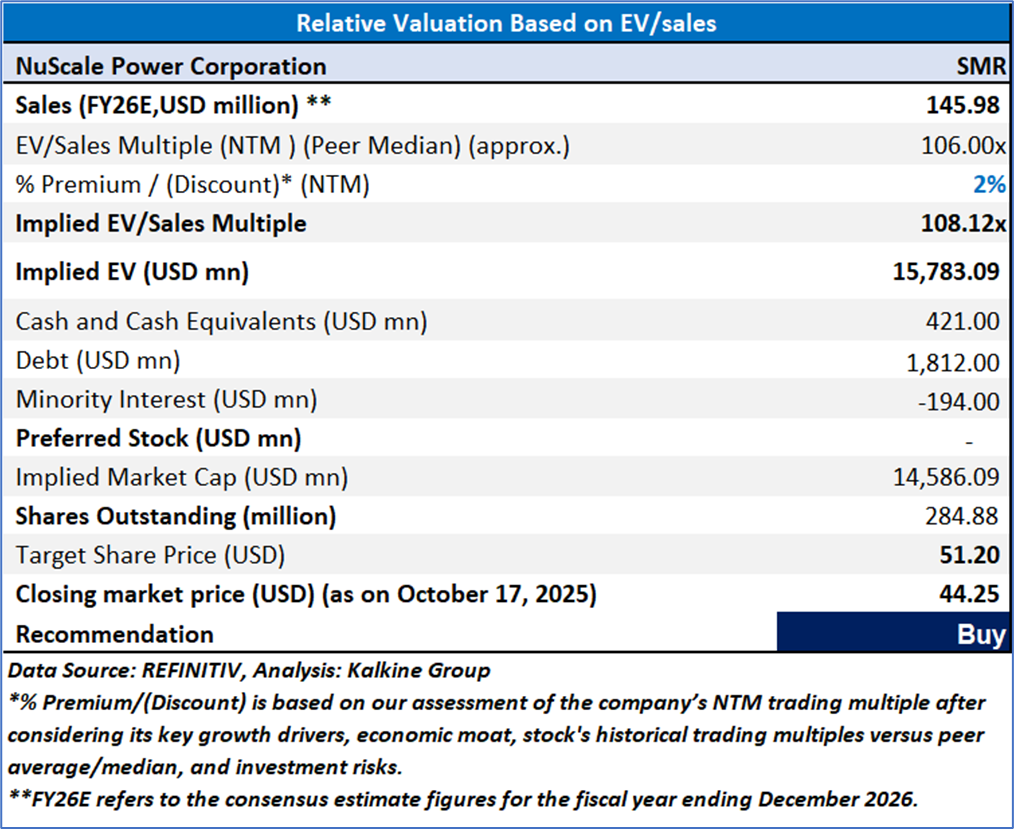
4.2 Fundamental Valuation
Valuation Methodology: EV/Sales Multiple Based Relative Valuation
Markets are trading in a highly volatile zone currently due to certain macroeconomic issues and geopolitical tensions prevailing. Therefore, it is prudent to follow a cautious approach while investing.
Note 1: Past performance is not a reliable indicator of future performance.
Note 2: The reference date for all price data, currency, technical indicators, support, and resistance levels is Oct 17, 2025. The reference data in this report has been partly sourced from REFINITIV.
Note 3: Investment decisions should be made depending on an individual's appetite for upside potential, risks, holding duration, and any previous holdings. An 'Exit' from the stock can be considered if the Target Price mentioned as per the Valuation and or the technical levels provided has been achieved and is subject to the factors discussed above.
Note 4: The report publishing date is as per the Pacific Time Zone.
Technical Indicators Defined: -
Support: A level at which the stock prices tend to find support if they are falling, and a downtrend may take a pause backed by demand or buying interest. Support 1 refers to the nearby support level for the stock and if the price breaches the level, then Support 2 may act as the crucial support level for the stock.
Resistance: A level at which the stock prices tend to find resistance when they are rising, and an uptrend may take a pause due to profit booking or selling interest. Resistance 1 refers to the nearby resistance level for the stock and if the price surpasses the level, then Resistance 2 may act as the crucial resistance level for the stock.
Stop-loss: It is a level to protect against further losses in case of unfavorable movement in the stock prices.
This report (“Report”) has been issued by Kalkine New Zealand Limited (FSP691351) (NZBN:9429047678101) (“Kalkine”). Kalkine is a Financial Advice Provider (“FAP”) and is authorised by a Class 1 Financial Advice Provider Licence issued by Financial Markets Authority (“FMA”) to provide financial advice. Kalkine provides only general financial advice through its research reports following a person becoming a member. The reports contain buy/sell/hold and other recommendations in relation to equity securities, managed funds and other managed investment schemes and other financial advice products. The recommendations and opinions in this Report and on Kalkine website do not take into account any of your investment objectives, financial situation or needs. Before you make a decision about whether to acquire a financial product, you should obtain the Product Disclosure Statement from the product issuer. You should consider the appropriateness of advice taking into account your own objectives, financial situation and needs and seek independent financial advice before making any financial decisions. If you act on the advice in the research reports, you may have to pay fees, expenses or other amounts (but not to Kalkine).
The information in this Report and on the Kalkine website has been prepared from a wide variety of sources, which Kalkine, to the best of its knowledge and belief, considers accurate. Kalkine has made every effort to ensure the reliability of the information contained in its reports (including this Report), newsletters and websites. All information represents our views at the date of publication and may change without notice.
Kalkine does not issue, sell or deal in any financial products. The information in this Report does not constitute an offer to sell securities or other financial products or a solicitation of an offer to buy securities or other financial products. Our reports contain general recommendations to invest in securities and other financial products. Kalkine is not responsible for, and does not guarantee, the performance of, or returns on, any investments mentioned in this Report.
This Report may contain information on past performance of particular investments. Past performance is not a reliable indicator of future performance. Returns stated do not take into account transaction costs and taxes.
Further information about the complaints and dispute resolution process, as well as information about Kalkine’s duties are available on Kalkine’s website. Please read our Financial Advice Provider (FAP) disclosure statement and Complaints Handling Guide, which are available on the website.
Copyright 2025 Krish Capital Pty. Ltd. (ABN 61629651510). All Rights Reserved. No part of this Report, or its content, may be reproduced in any form without our prior consent.
Past performance is not a reliable indicator of future performance.
 Please wait processing your request...