
Company Overview: Southern Cross Electrical Engineering Limited (ASX: SXE) is an electrical and communication service provider that principally offers electrical, instrumentation, communication and maintenance services. Viva Leisure Limited (ASX: VVA) operates ~120 health clubs within the Australian Capital Territory, New South Wales, Queensland and Victoria. The Company manages two distinct health club brands, Club Lime and Club Pink. Kalkine’s Market Event Report covers the Investment Summary, Event Summary, Data Insights & Analysis, Key Financial Metrics, Risks, Outlook, Technical Analysis along with the Valuation, Target Price, and Recommendation on the stock.
Investment Summary
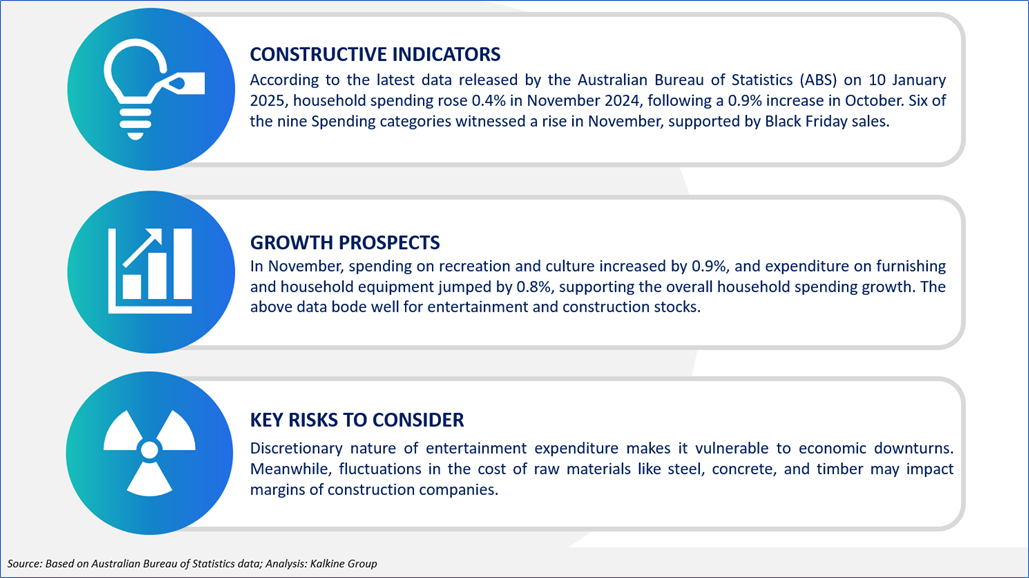
Event Highlights
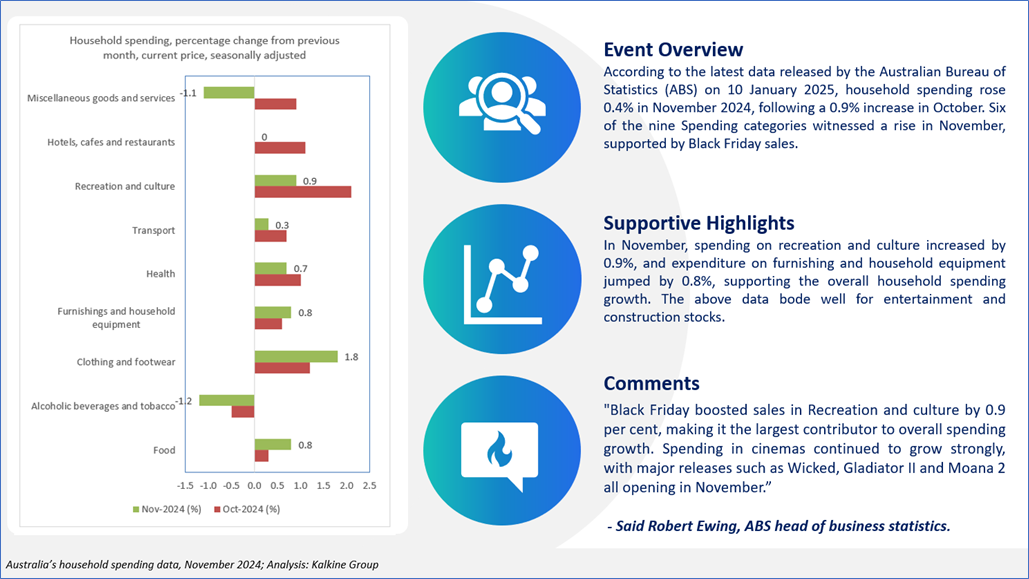
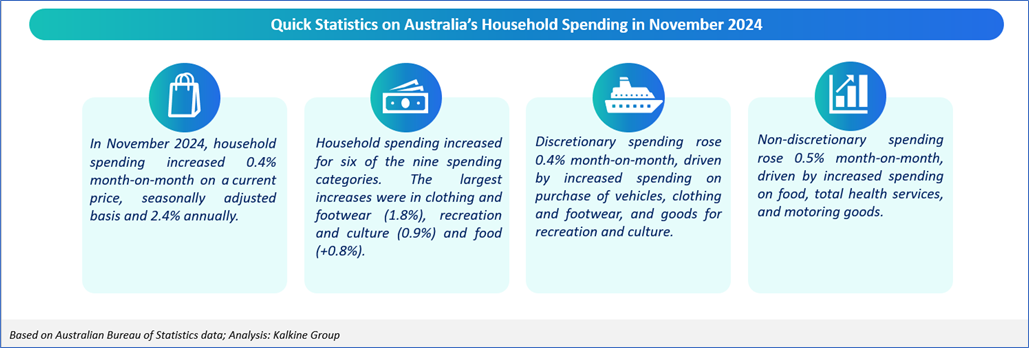
Data Insights and Analysis
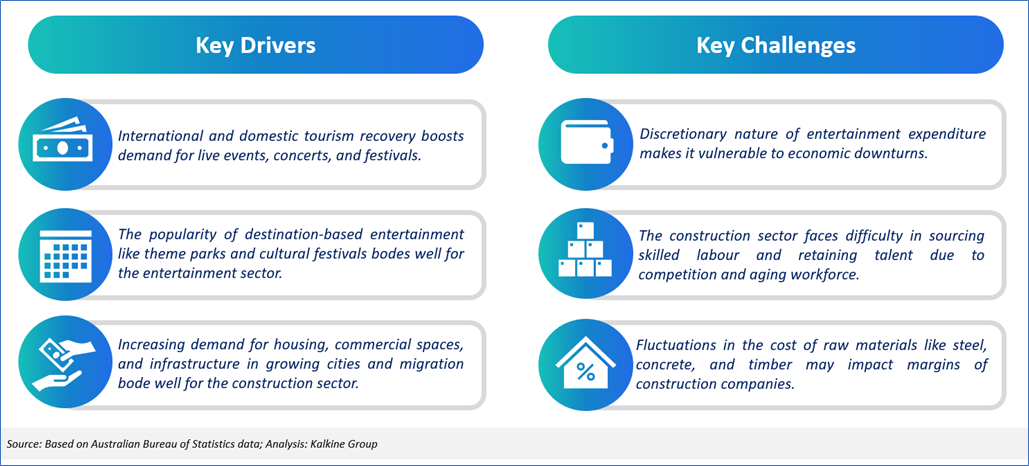
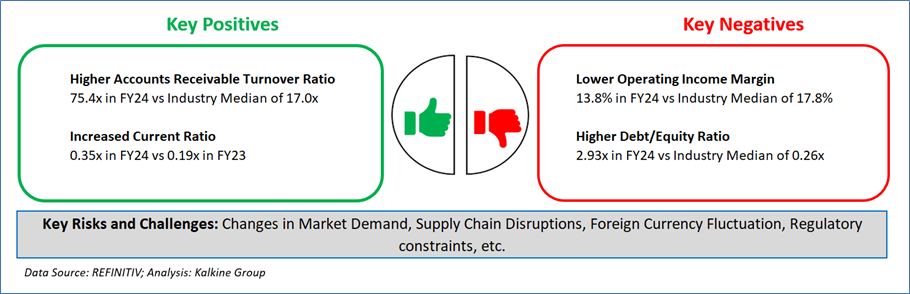
Key Drivers versus Key Challenges
Based on the above data, two ASX stocks have been identified to showcase the momentum.
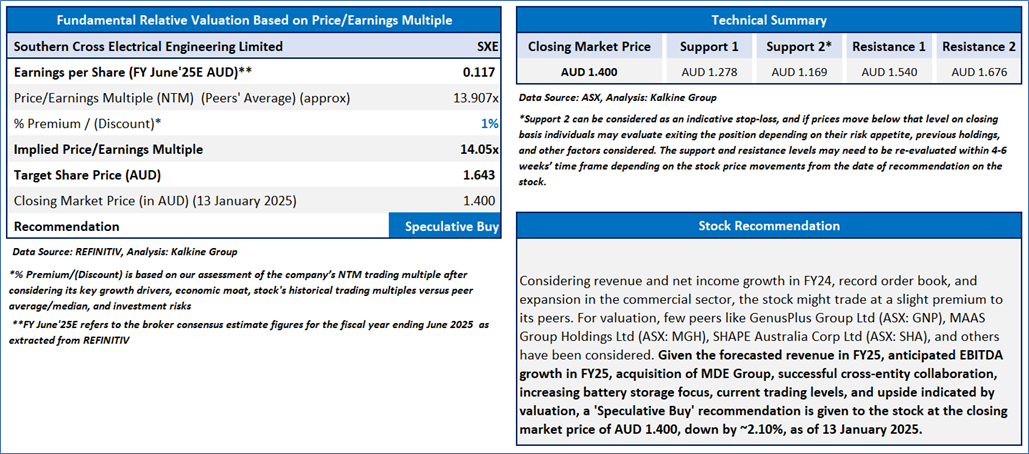
1) Southern Cross Electrical Engineering Limited (ASX: SXE) (Recommendation: ‘Speculative Buy’ at AUD 1.400, Potential Upside: Low Double-Digit) (M-cap: AUD 377.90mn)
Company Overview: SXE is an electrical and communication service provider that principally offers electrical, instrumentation, communication and maintenance services.
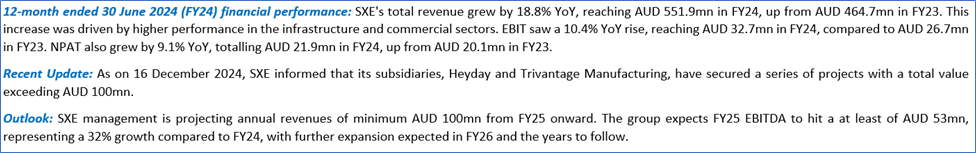
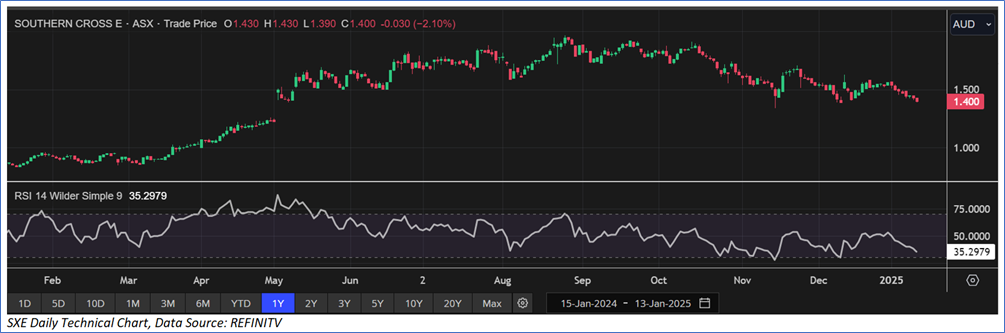
The stock has declined by ~1.06% in last 1 months, and over the last three months, it has decreased by ~24.73%. The stock has a 52-week low and 52-week high of AUD 0.835 and AUD 1.965, respectively and is currently trading above the 52-week high-low average. SXE was last covered in a report dated ‘23 December 2024’.
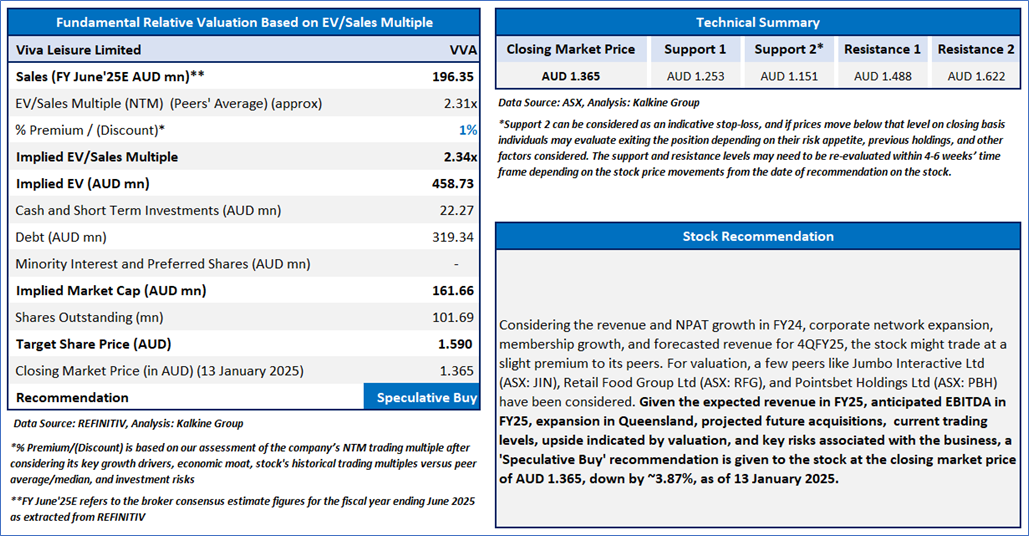
2) Viva Leisure Limited (ASX: VVA) (Recommendation: ‘Speculative Buy’ at AUD 1.365, Potential Upside: Low Double-Digit) (M-cap: AUD 144.39mn)
Company Overview: VVA operates ~120 health clubs within the Australian Capital Territory, New South Wales, Queensland and Victoria. The Company manages two distinct health club brands, Club Lime and Club Pink.
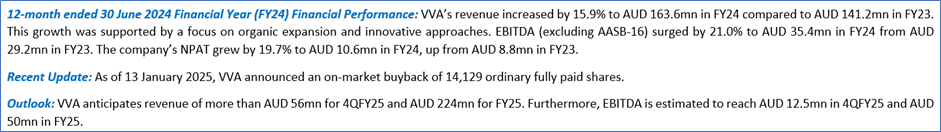
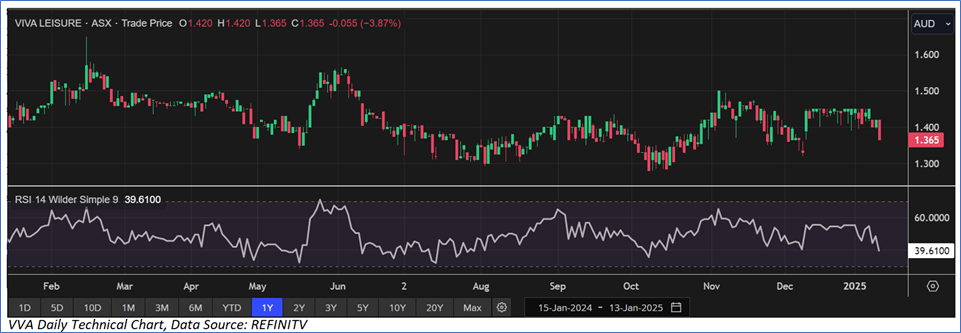
The stock has witnessed a correction of ~7.46% in last nine months, and over the past one year, it declined by ~3.87%. The stock has a 52-week low and 52-week high of AUD 1.280 and AUD 1.650, respectively, and is currently trading below the 52-week high-low average. VVA was last covered in a report dated ‘16 December 2024’.
Markets are trading in a highly volatile zone currently due to certain macro-economic issues and geopolitical tensions prevailing. Therefore, it is prudent to follow a cautious approach while investing.
Note 1: Past performance is neither an Indicator nor a guarantee of future performance.
Note 2: The reference date for all price data, currency, technical indicators, support, and resistance levels is 13 January 2025. The reference data in this report has been partly sourced from REFINITIV.
Note 3: Investment decisions should be made depending on an individual’s appetite for upside potential, risks, holding duration, and any previous holdings. An ‘Exit’ from the stock can be considered if the Target Price mentioned as per the Valuation and or the technical levels provided has been achieved and is subject to the factors discussed above.
Note 4: Kalkine reports are prepared based on the stock prices captured either from REFINITIV or Trading View. Typically, REFINITIV or Trading View may reflect stock prices with a delay which could be a lag of 25-30 minutes. There can be no assurance that future results or events will be consistent with the information provided in the report. The information is subject to change without any prior notice.
Technical Indicators Defined: -
Support: A level at which the stock prices tend to find support if they are falling, and a downtrend may take a pause backed by demand or buying interest. Support 1 refers to the nearby support level for the stock and if the price breaches the level, then Support 2 may act as the crucial support level for the stock.
Resistance: A level at which the stock prices tend to find resistance when they are rising, and an uptrend may take a pause due to profit booking or selling interest. Resistance 1 refers to the nearby resistance level for the stock and if the price surpasses the level, then Resistance 2 may act as the crucial resistance level for the stock.
Stop-loss: It is a level to protect further losses in case of unfavourable movement in the stock prices.
Disclaimer This report has been issued by Kalkine New Zealand Limited (FSP691351) (NZBN:9429047678101) (“Kalkine”). Kalkine is a Financial Advice Provider (“FAP”) and is authorised by a Class 1 Financial Advice Provider Licence issued by Financial Markets Authority (“FMA”) to provide financial advice. Kalkine provides only general financial advice through its research reports following a person becoming a member. The reports contain buy/sell/hold and other recommendations in relation to equity securities, managed funds and other managed investment schemes and other financial advice products. The recommendations and opinions in this report and on Kalkine website do not take into account any of your investment objectives, financial situation or needs. Before you make a decision about whether to acquire a financial product, you should obtain the Product Disclosure Statement from the product issuer. You should consider the appropriateness of advice taking into account your own objectives, financial situation and needs and seek independent financial advice before making any financial decisions. If you act on the advice in the research reports, you may have to pay fees, expenses or other amounts (but not to Kalkine). Further information about the complaints and dispute resolution process, as well as information about Kalkine’s duties are available on Kalkine’s website. Please read our Financial Advice Provider (FAP) disclosure statement and Complaints Handling Guide, which are available on the website.
Past performance is not a reliable indicator of future performance.
 Please wait processing your request...