
Section 1: Company Overview and Fundamentals
1.1 Company Overview:
Norwegian Cruise Line Holdings Ltd (NYSE: NCLH) is an international cruise operator managing three brands: Norwegian Cruise Line, Oceania Cruises, and Regent Seven Seas Cruises. Together, the company operates a fleet of 32 ships with more than 66,500 berths, providing cruise itineraries to over 700 destinations around the globe.
Kalkine’s Diversified Opportunities Report covers the Company Overview, Key positives & negatives, Investment summary, Key investment metrics, Top 10 shareholding, Business updates and insights into company recent financial results, Key Risks & Outlook, Price performance and technical summary, Target Price, and Recommendation on the stock.
Stock Performance:
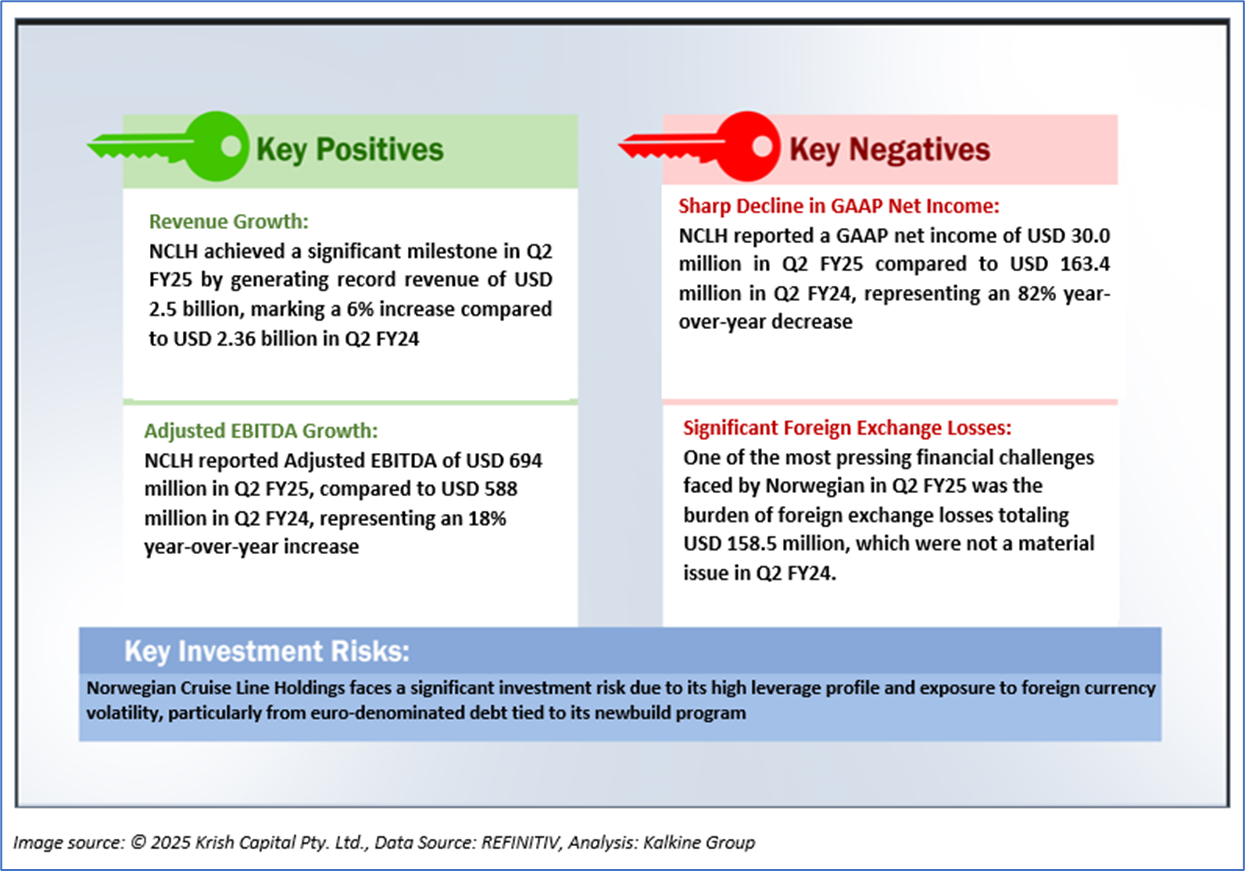
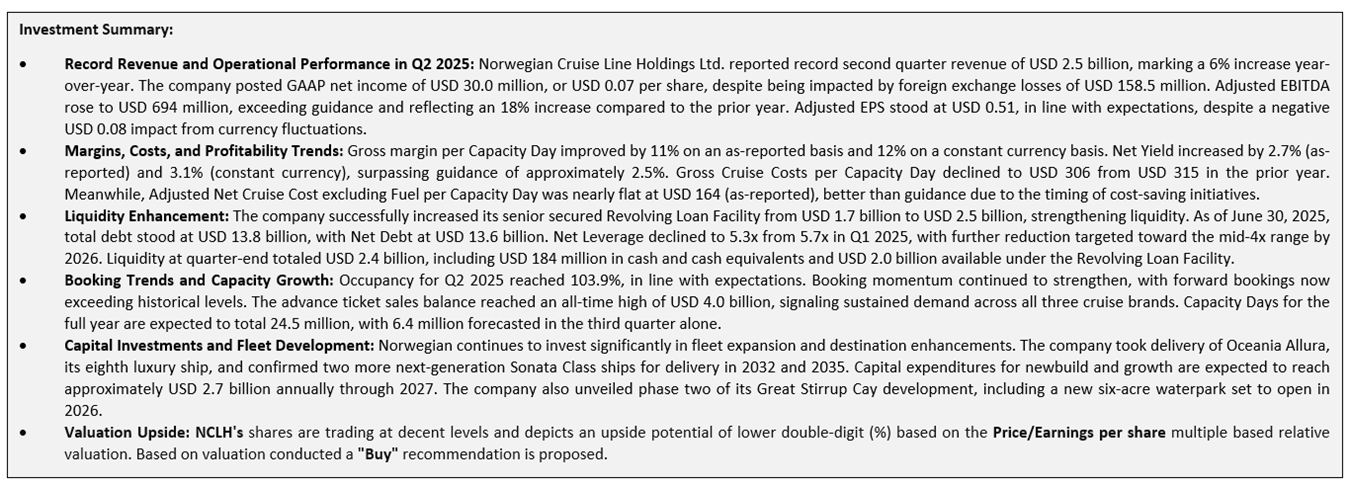
1.2 The Key Positives, Negatives, and Investment summary
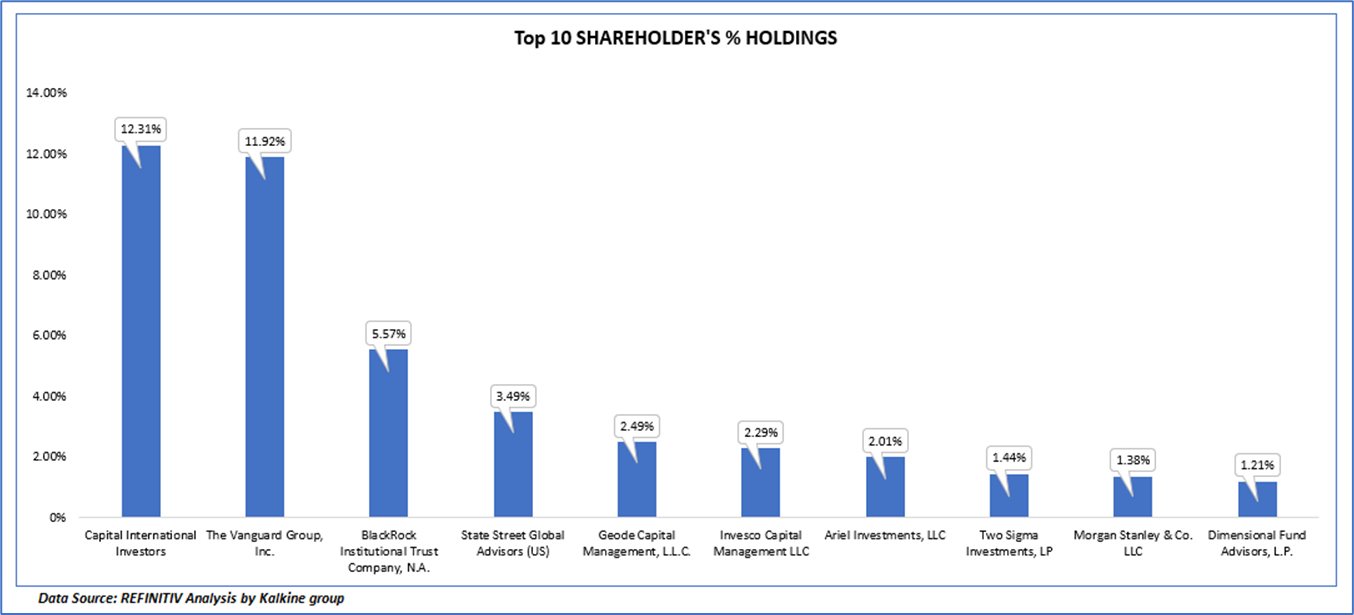
1.3 Top 10 shareholders:
The top 10 shareholders together form ~ 44.10% of the total shareholding, signifying concentrated shareholding. Capital International Investors and The Vanguard Group, Inc. are the biggest shareholders, holding the maximum stake in the company at 12.31% and 11.92%, respectively.
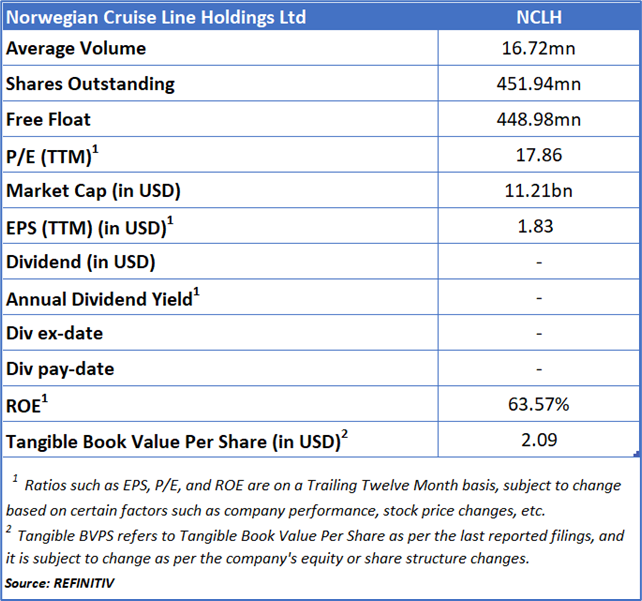
1.4 Key Metrics:
During the period from Q2 FY24 to Q2 FY25, revenue and gross margin fluctuated due to seasonal demand patterns, occupancy rates, and pricing strength. Revenue peaked in Q3 FY24 on the back of robust consumer demand and high onboard spending, driving gross margin to 45.16%. However, revenue and margins declined in Q4 FY24 due to seasonality and lower capacity utilization. While revenue gradually improved in Q1 and Q2 FY25, gross margin also recovered to 42.13% by Q2 FY25, supported by cost efficiencies and strong advance bookings. Net income, however, was volatile, peaking in Q3 FY24 and turning negative in Q1 FY25 due to significant foreign exchange losses and higher depreciation. Despite revenue and margin recovery in Q2 FY25, net income remained low, reflecting ongoing FX headwinds and elevated interest expenses.

Section 2: Business Updates and Corporate Business Highlights
2.1 Recent Business Updates

2.2 Insights of Q2FY25:

Section 3: Key Risks & Outlook

Section 4: Stock Recommendation Summary:
4.1 Price Performance and Technical Summary:
Stock Performance:


4.2 Fundamental Valuation
Valuation Methodology: Price/Earnings per share Multiple Based Relative Valuation


Markets are trading in a highly volatile zone currently due to certain macroeconomic issues and geopolitical tensions prevailing. Therefore, it is prudent to follow a cautious approach while investing.
Note 1: Past performance is not a reliable indicator of future performance.
Note 2: The reference date for all price data, currency, technical indicators, support, and resistance levels is August 07, 2025. The reference data in this report has been partly sourced from REFINITIV.
Note 3: Investment decisions should be made depending on an individual's appetite for upside potential, risks, holding duration, and any previous holdings. An 'Exit' from the stock can be considered if the Target Price mentioned as per the Valuation and or the technical levels provided has been achieved and is subject to the factors discussed above.
Note 4: The report publishing date is as per the Pacific Time Zone.
Technical Indicators Defined: -
Support: A level at which the stock prices tend to find support if they are falling, and a downtrend may take a pause backed by demand or buying interest. Support 1 refers to the nearby support level for the stock and if the price breaches the level, then Support 2 may act as the crucial support level for the stock.
Resistance: A level at which the stock prices tend to find resistance when they are rising, and an uptrend may take a pause due to profit booking or selling interest. Resistance 1 refers to the nearby resistance level for the stock and if the price surpasses the level, then Resistance 2 may act as the crucial resistance level for the stock.
Stop-loss: It is a level to protect against further losses in case of unfavorable movement in the stock prices.
Disclaimer This report has been issued by Kalkine New Zealand Limited (FSP691351) (NZBN:9429047678101) (“Kalkine”). Kalkine is a Financial Advice Provider (“FAP”) and is authorised by a Class 1 Financial Advice Provider Licence issued by Financial Markets Authority (“FMA”) to provide financial advice. Kalkine provides only general financial advice through its research reports following a person becoming a member. The reports contain buy/sell/hold and other recommendations in relation to equity securities, managed funds and other managed investment schemes and other financial advice products. The recommendations and opinions in this report and on Kalkine website do not take into account any of your investment objectives, financial situation or needs. Before you make a decision about whether to acquire a financial product, you should obtain the Product Disclosure Statement from the product issuer. You should consider the appropriateness of advice taking into account your own objectives, financial situation and needs and seek independent financial advice before making any financial decisions. If you act on the advice in the research reports, you may have to pay fees, expenses or other amounts (but not to Kalkine). Further information about the complaints and dispute resolution process, as well as information about Kalkine’s duties are available on Kalkine’s website. Please read our Financial Advice Provider (FAP) disclosure statement and Complaints Handling Guide, which are available on the website.
Past performance is not a reliable indicator of future performance.
 Please wait processing your request...