This report is an updated version of the report published on 3 October 2025 at 11:21 AM AEST.
Section 1: Company Overview, Low Carbon Emission Initiatives and Fundamentals
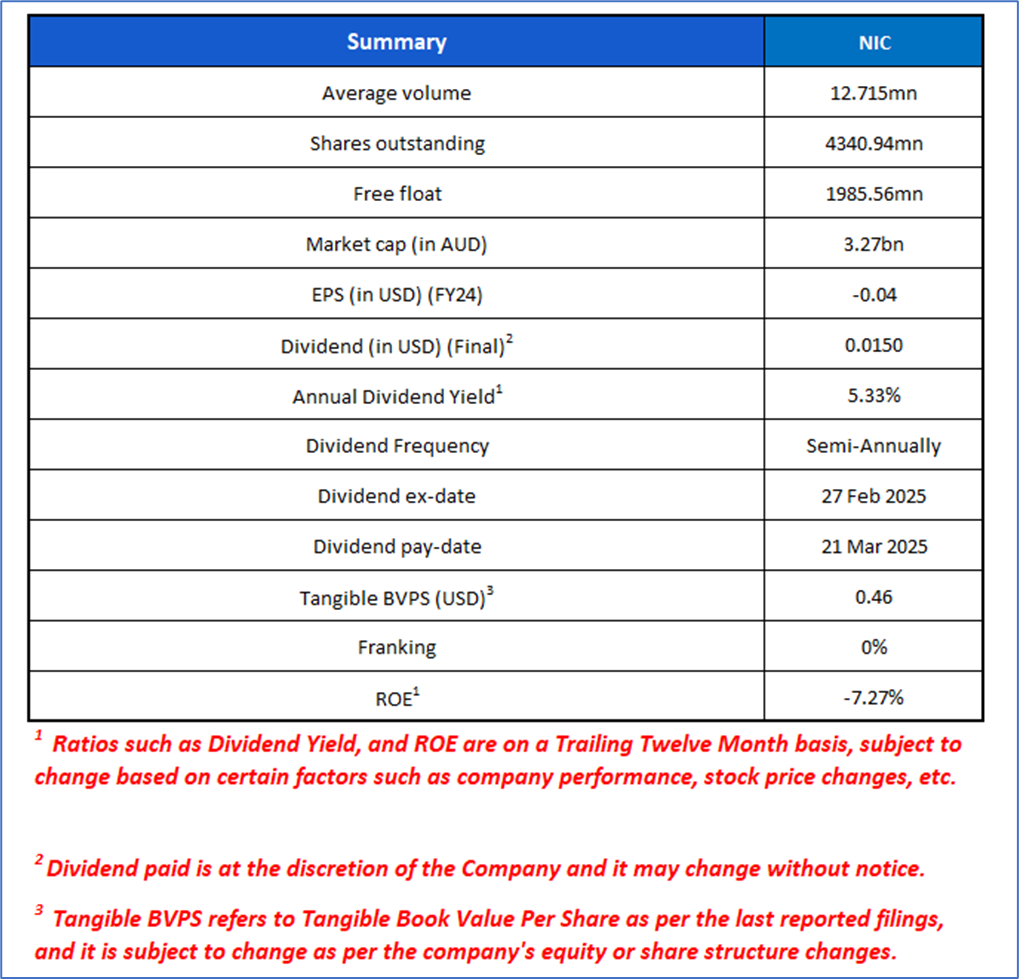
Section 1.1: Nickel Industries Limited (ASX: NIC) is an ASX-listed nickel ore mining and nickel pig iron production company with operations in Singapore and Indonesia. It holds an 80% stake in the Hengjaya Mine, Ranger Nickel project and in the Angel Nickel project. Kalkine’s Low Carbon Research Report covers the Investment Highlights, Low Carbon Emission Initiatives, Key Financial Metrics, Risks, and Technical Analysis along with the Valuation, Target Price, and Recommendation on the stock.
Section 1.2: Why Low Carbon Emission Matters?
The shift toward a low-carbon economy is one of the most significant challenges of current time, spurred by the urgent need to combat climate change and reduce the environmental impact of corporate activities. This report covers the ASX-listed low-carbon emission company, Nickel Industries Ltd (ASX: NIC), that is committed to sustainability and responsible environmental practices.
Source: Company Filings; Analysis by Kalkine Group
Carbon and Waste Management - Key Metrics
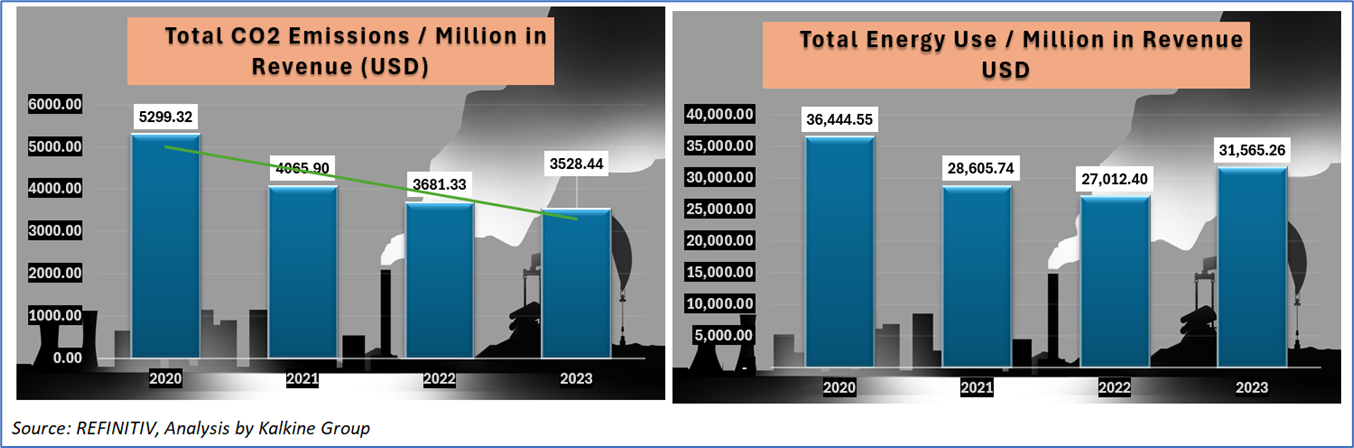
The image below highlights that between 2020 and 2023, Nickel Industries achieved a steady decline in CO₂ emissions per million dollars of revenue, falling from 5,299 to 3,528, reflecting the company’s successful shift towards cleaner operations through renewable energy adoption (solar installations), the substitution of coal with recycled furnace gas, and the electrification of mining equipment. Over the same period, total energy use per million dollars of revenue initially decreased significantly from 36,444 in 2020 to 27,012 in 2022, driven by operational efficiency measures and higher output, but rebounded to 31,565 in 2023 as new processing facilities and energy-intensive HPAL technology came online. Overall, while energy intensity rose slightly in the latest year due to expansion, the consistent reduction in emissions intensity highlights that Nickel Industries is effectively decoupling its growth from carbon emissions through sustainability initiatives.
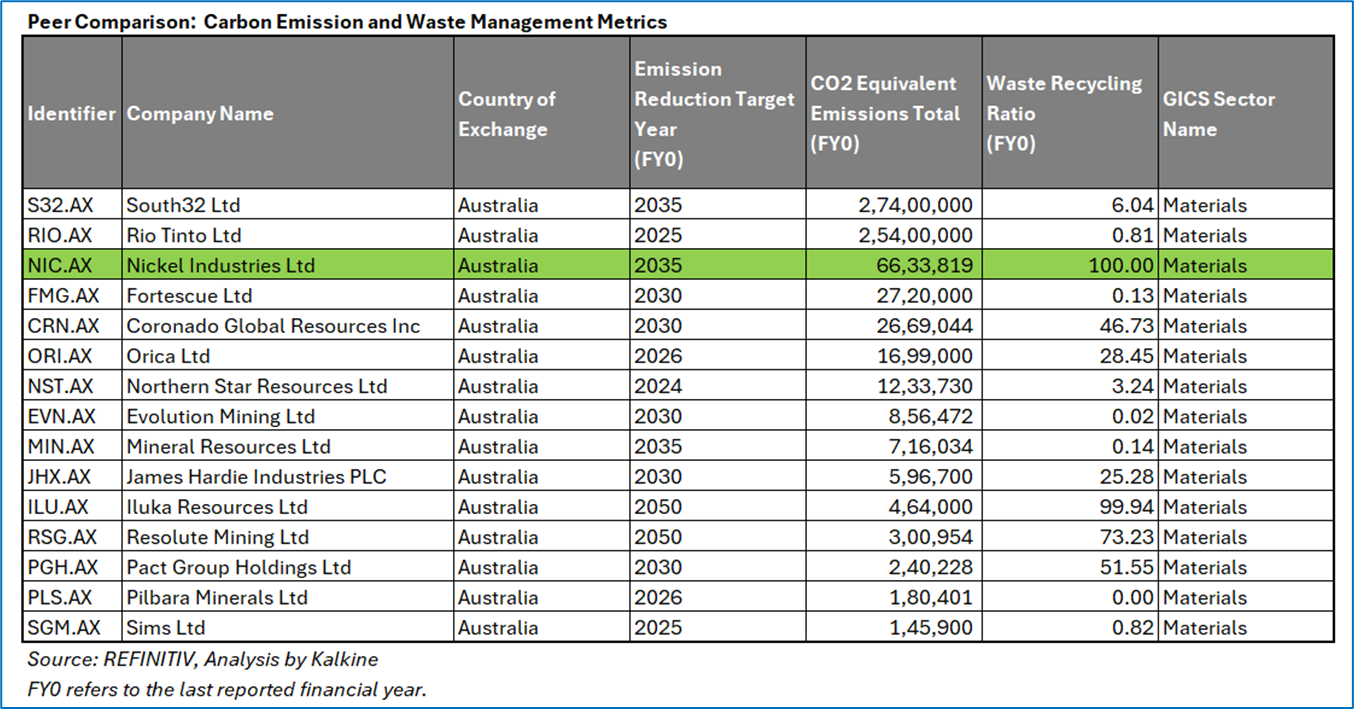
Peer Comparison: Carbon Emission and Waste Management Metrics
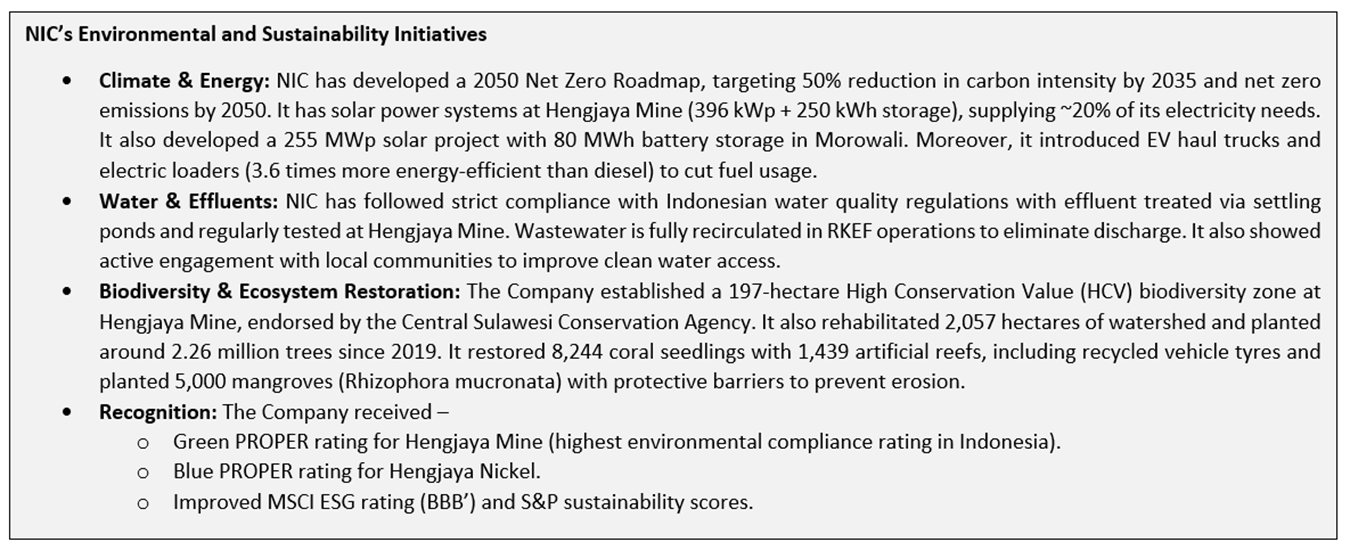
The peer comparison chart below highlighted how Nickel Industries (NIC) performs on carbon emissions and waste management relative to its Australian mining and materials sector peers. According to the 2024 Sustainability Report, NIC has set a 2035 emission reduction target, aligning with its Net Zero Roadmap to cut carbon intensity by 50% by 2035 and achieve net zero by 2050. Its reported total CO₂ equivalent emissions (~66.3 million tonnes) are higher than some peers due to the energy-intensive nature of nickel processing and expansion of smelting capacity, but the company is actively mitigating this through renewable energy projects, electrification of mining equipment, and substitution of coal with recycled furnace gas. Importantly, NIC stands out with a 100% waste recycling ratio, the highest among peers, reflecting its investment in Domestic Material Recovery Facilities, the adoption of the 4R principles (Reduce, Reuse, Recycle, Recover), and integration of byproducts into land rehabilitation and industrial reuse. This places NIC ahead of industry giants like Rio Tinto and South32 in waste circularity, underscoring its strategy to reduce environmental impact even as production scales up.
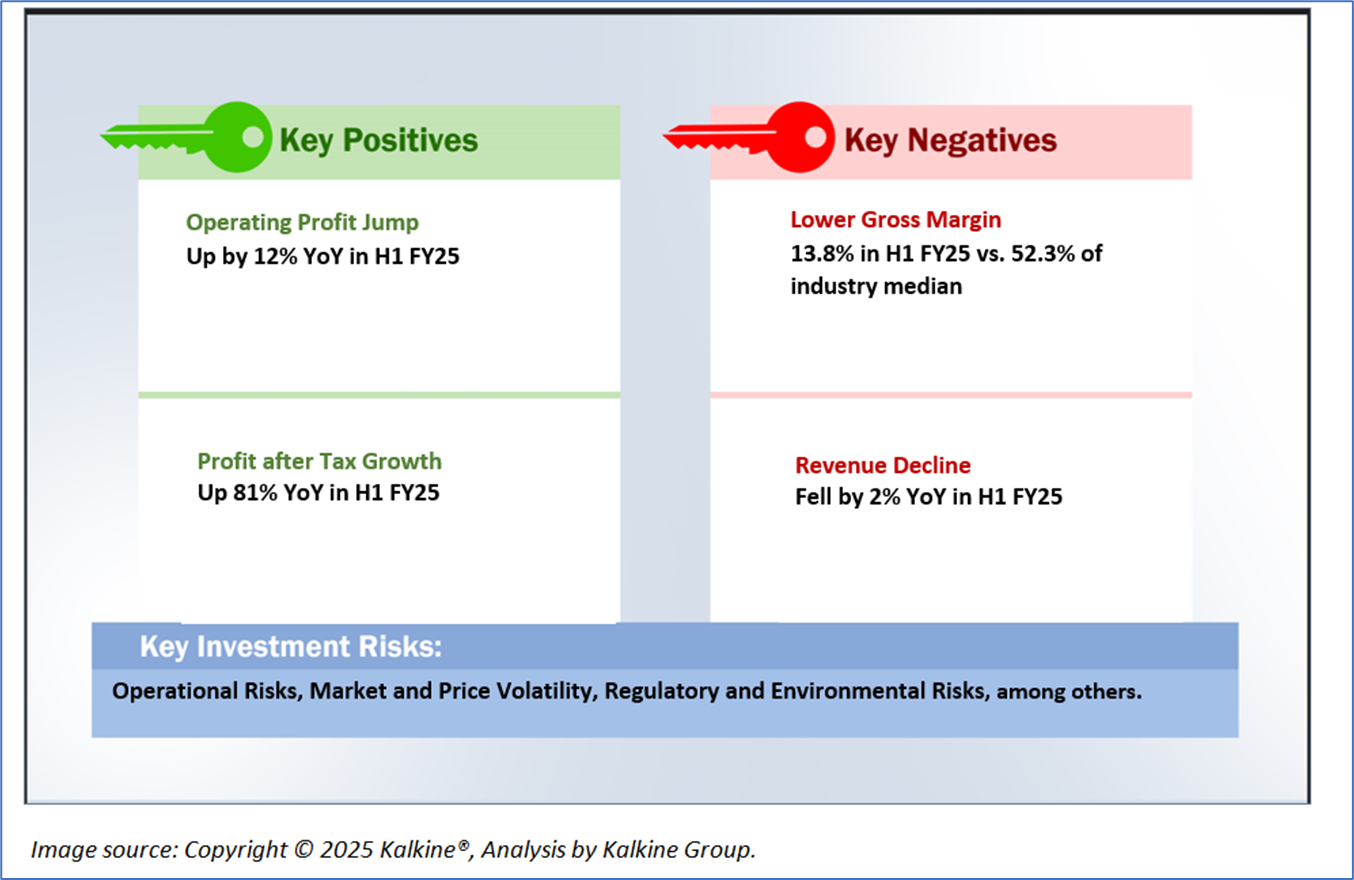
1.3 The Key Positives, Negatives, Investment Highlights, and Risks
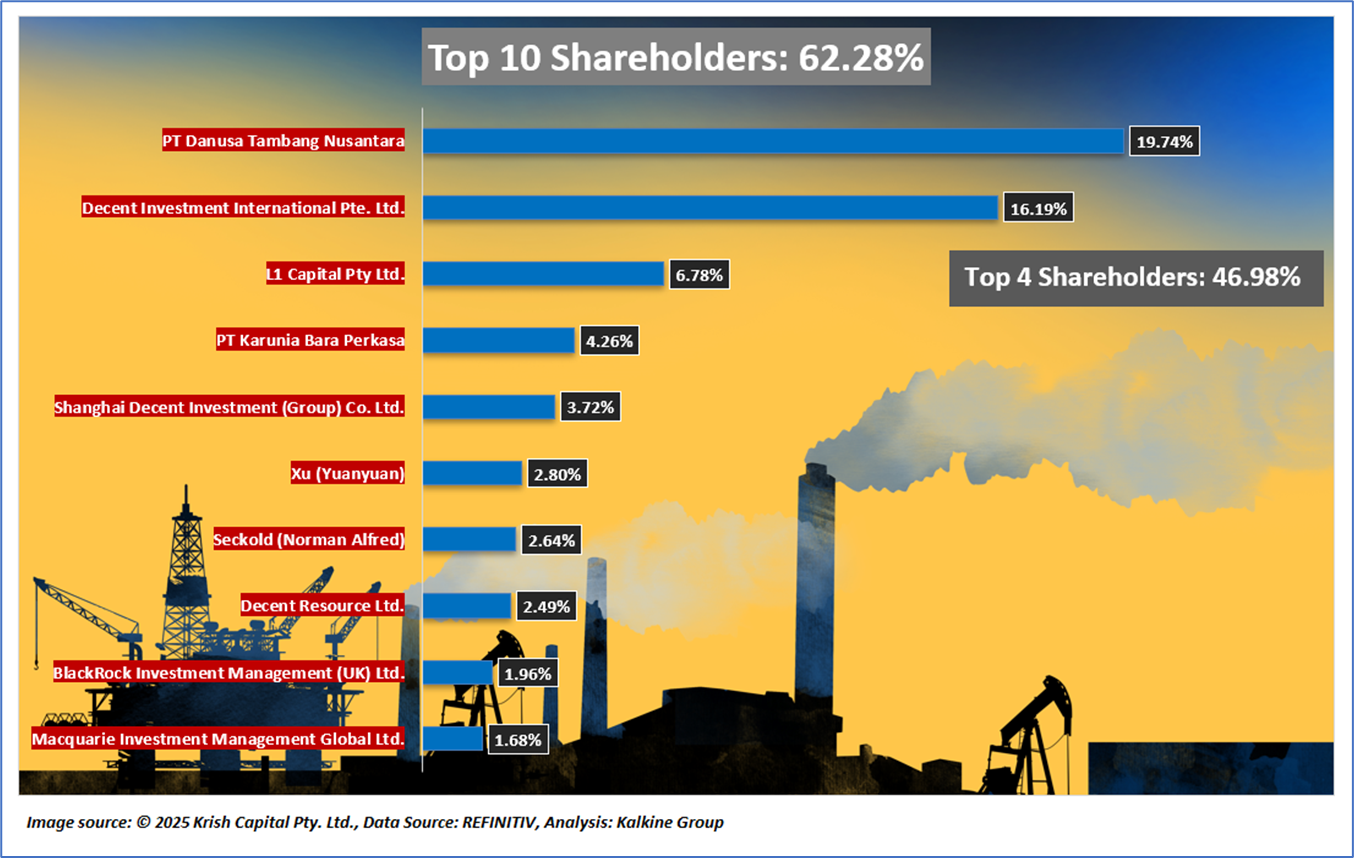
1.4 Top 10 Shareholders:
The top 10 shareholders together form ~62.28% of the total shareholding. PT Danusa Tambang Nusantara and Decent Investment International Pte. Ltd. hold maximum stakes in the company at ~19.74% and ~16.19%, respectively.
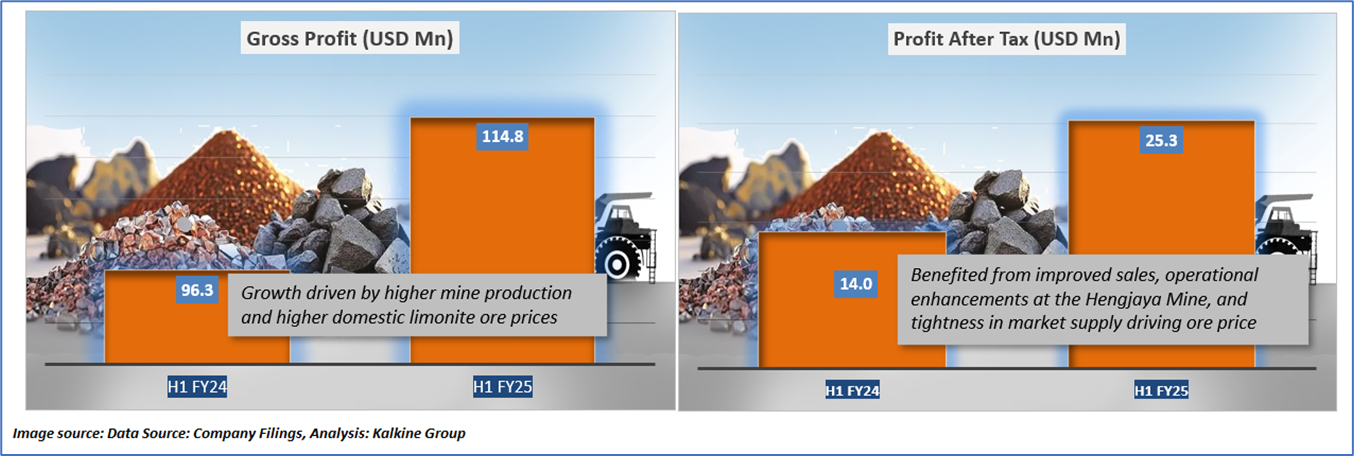
1.5 Key Metrics: The image below highlights that profitability for Nickel Industries Limited increased in H1 FY25 because of higher production and sales at the Hengjaya Mine, especially of limonite ore, which saw prices rise due to market tightness and domestic supply shortages. The cost of sales decreased faster than the slight reduction in revenue, as improved operational efficiencies and a larger volume of high-margin ore offset higher input costs from elevated nickel ore prices. Additionally, the impact of higher interest expenses was less significant compared to the scale of profit growth delivered by improved mine operations, greater EBITDA contribution from the HPAL segment, and improved pricing environment for mixed hydroxide precipitate (MHP) sales.
Section 2: Business Updates, Financial and Operational Highlights
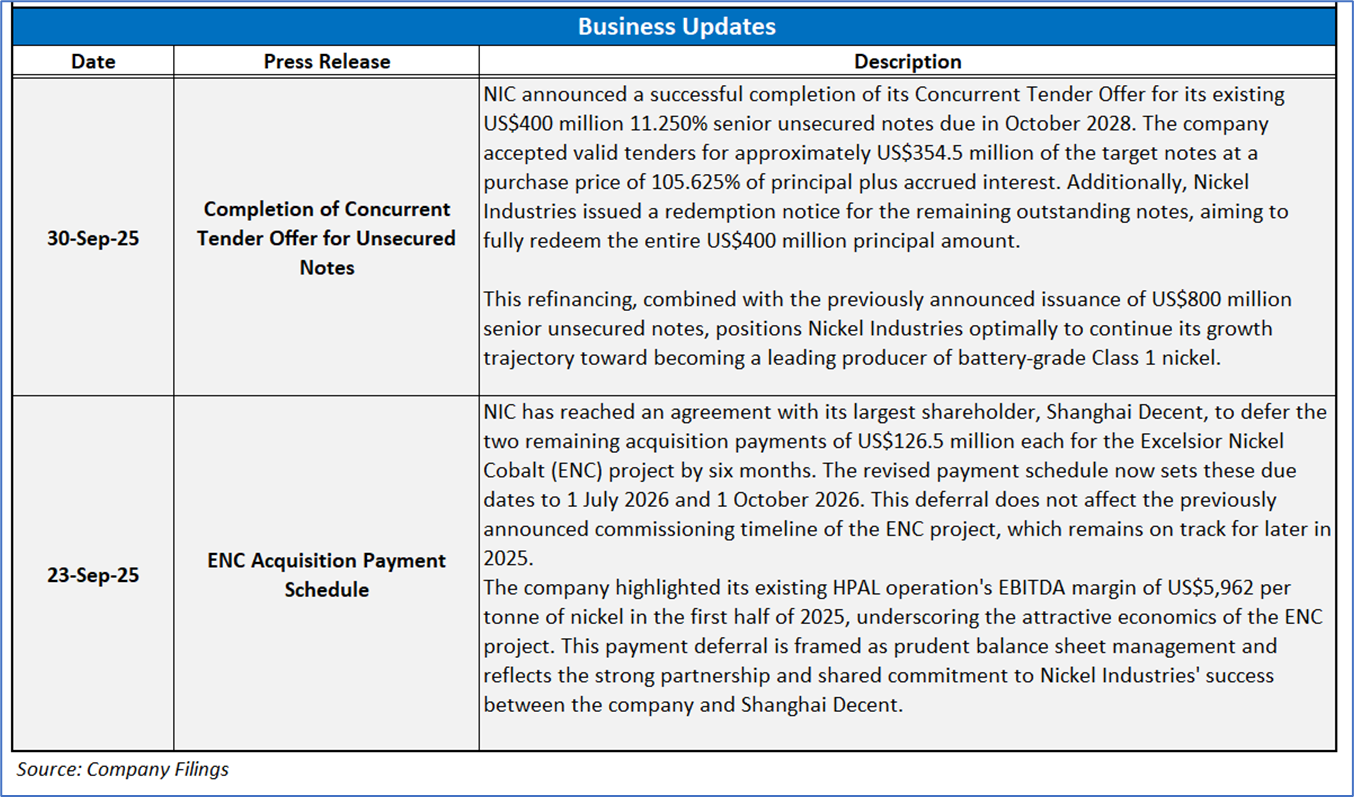
2.1 Recent Business Updates:
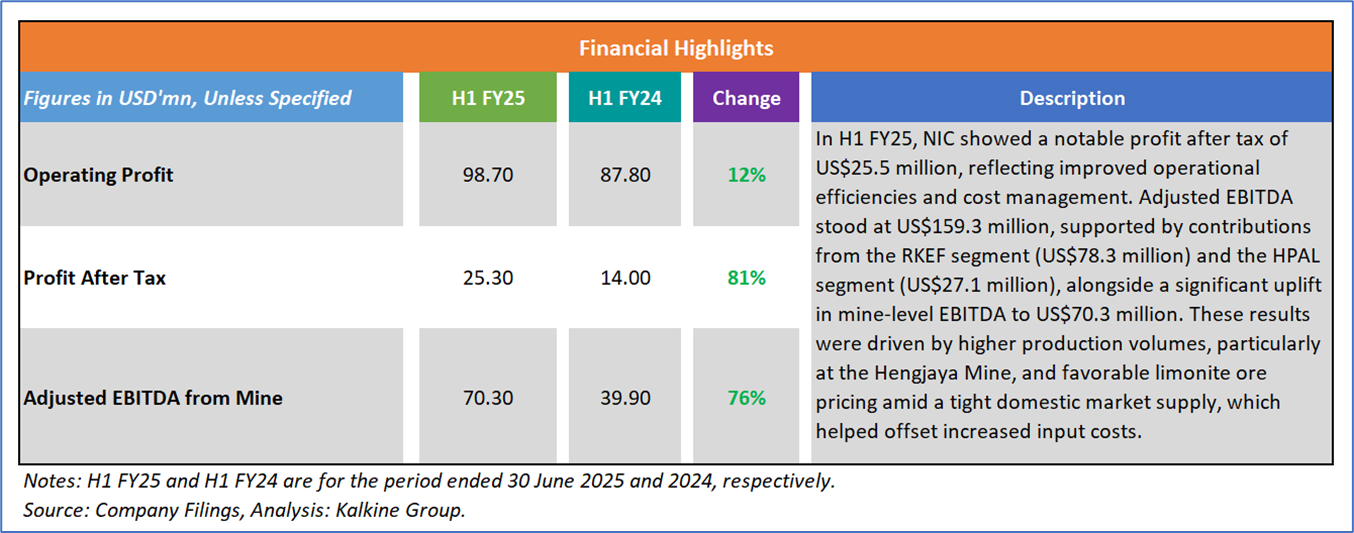
2.2 Results Highlights
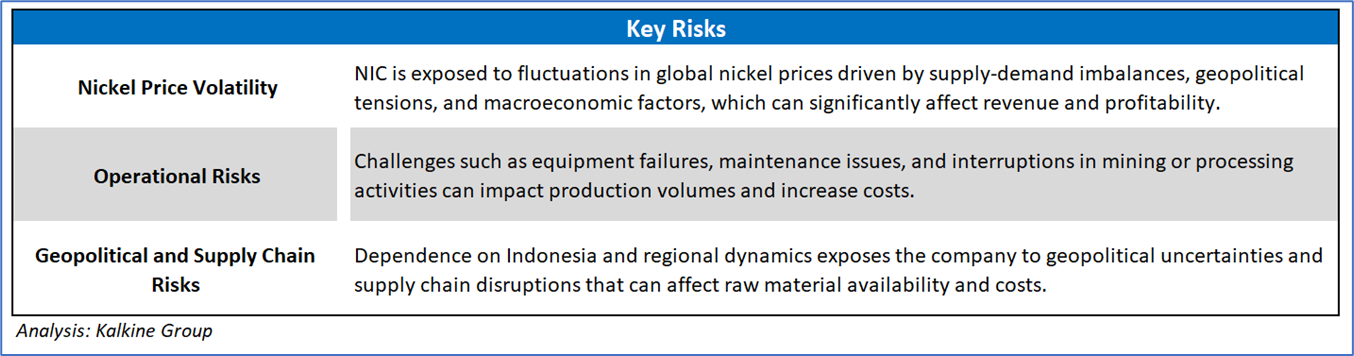
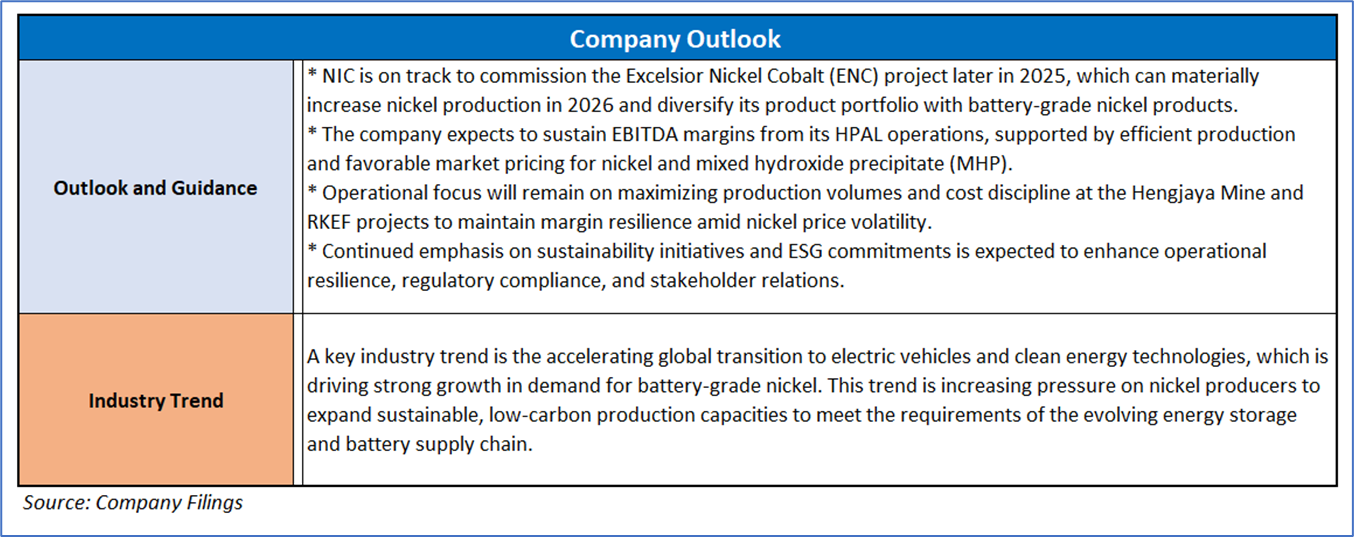
Section 3: Key Risks and Outlook:
Section 4: Stock Recommendation Summary
4.1 Price Performance and Technical Summary
The stock price has increased by ~7.14% in the last one month, whereas over the last 1-year, it has corrected by ~18.48%. The stock has a 52-week low and 52-week high of AUD 0.420 and AUD 0.995, respectively, and is currently trading around the midpoints of its 52-week low and 52-week high. NIC was previously covered in a report dated ’11 July 2025’.
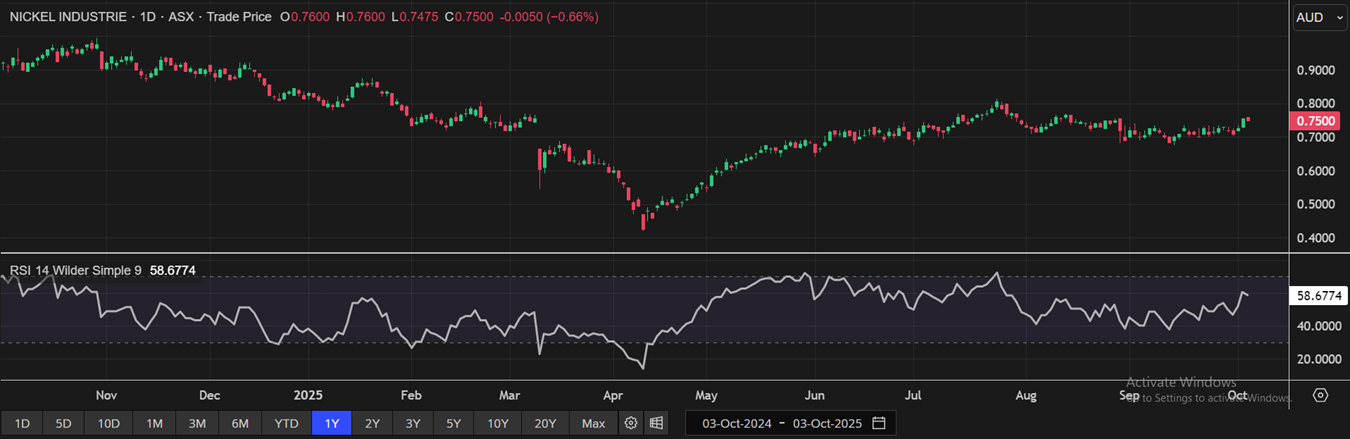
(Source: REFINITIV, Analysis by Kalkine Group)
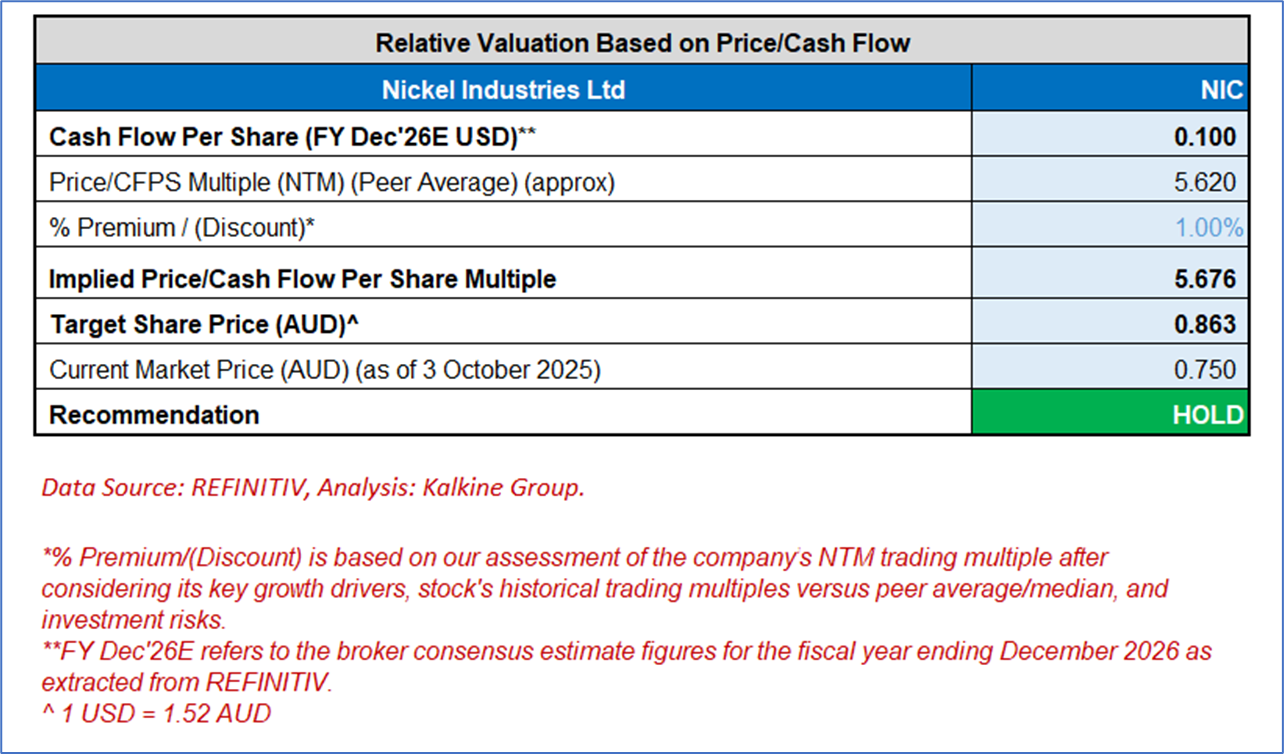
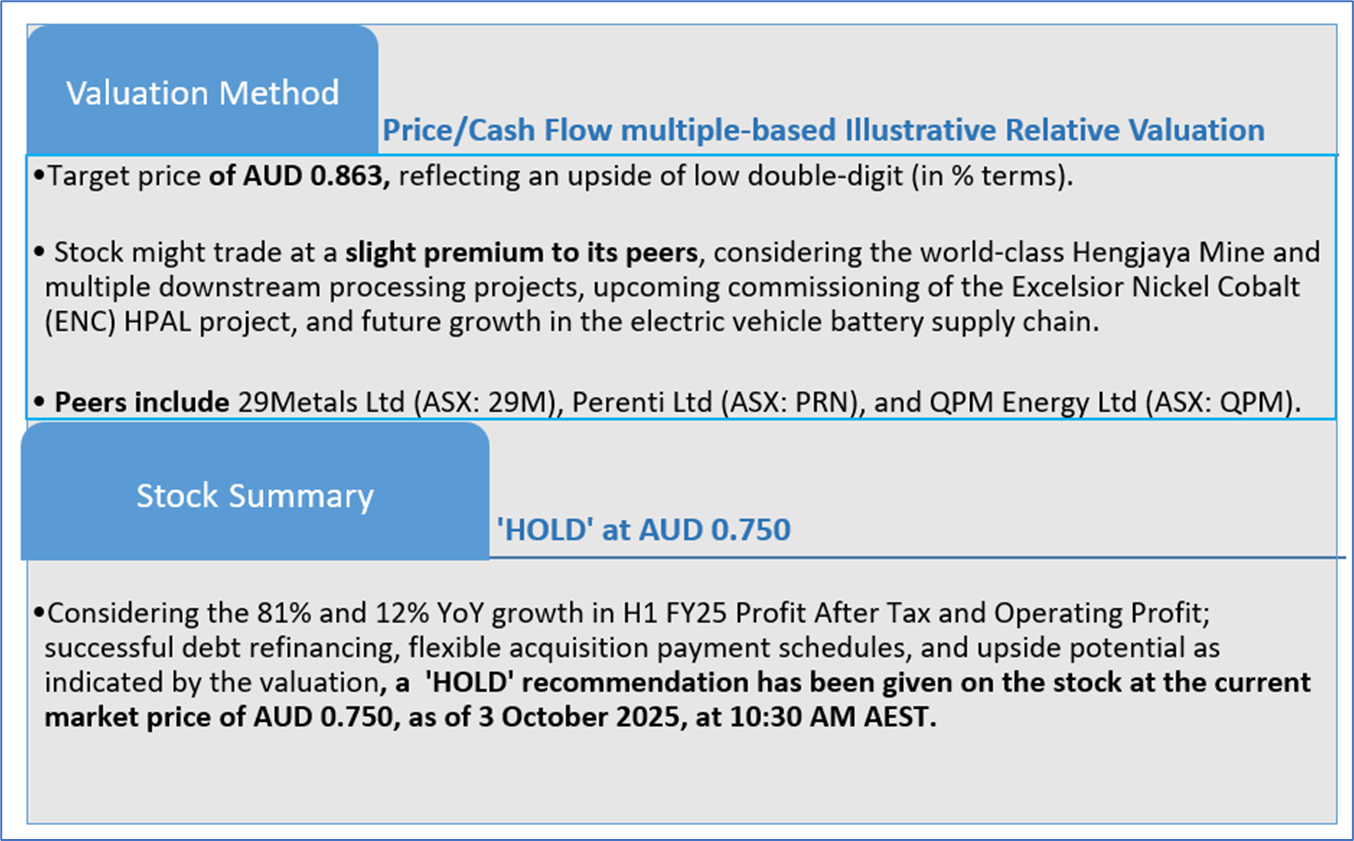
4.2 Fundamental Valuation
Valuation Methodology: Price/Cash Flow Multiple Based Relative Valuation (Illustrative)
Markets are trading in a highly volatile zone currently due to certain macro-economic issues and geopolitical tensions prevailing. Therefore, it is prudent to follow a cautious approach while investing.
Note 1: Past performance is neither an indicator nor a guarantee of future performance.
Note 2: The reference date for all price data, currency, technical indicators, support, and resistance levels is 3 October 2025. The reference data in this report has been partly sourced from REFINITIV.
Note 3: Investment decisions should be made depending on an individual's appetite for upside potential, risks, holding duration, and any previous holdings. An 'Exit' from the stock can be considered if the Target Price mentioned as per the Valuation and or the technical levels provided has been achieved and is subject to the factors discussed above.
Note 4: Dividend Yield may vary as per the stock price movement.
Note 5: Kalkine reports are prepared based on the stock prices captured either from REFINITIV or Trading View. Typically, REFINITIV or Trading View may reflect stock prices with a delay which could be a lag of 25-30 minutes. There can be no assurance that future results or events will be consistent with the information provided in the report. The information is subject to change without any prior notice.
Technical Indicators Defined: -
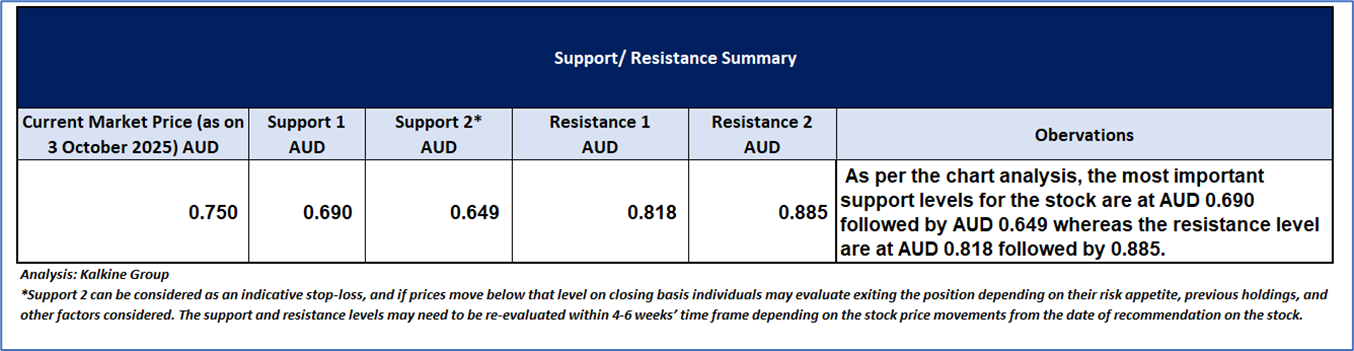
Support: A level at which the stock prices tend to find support if they are falling, and a downtrend may take a pause backed by demand or buying interest. Support 1 refers to the nearby support level for the stock and if the price breaches the level, then Support 2 may act as the crucial support level for the stock.
Resistance: A level at which the stock prices tend to find resistance when they are rising, and an uptrend may take a pause due to profit booking or selling interest. Resistance 1 refers to the nearby resistance level for the stock and if the price surpasses the level, then Resistance 2 may act as the crucial resistance level for the stock.
Stop-loss: It is a level to protect further losses in case of unfavourable movement in the stock prices.
Disclaimer This report has been issued by Kalkine New Zealand Limited (FSP691351) (NZBN:9429047678101) (“Kalkine”). Kalkine is a Financial Advice Provider (“FAP”) and is authorised by a Class 1 Financial Advice Provider Licence issued by Financial Markets Authority (“FMA”) to provide financial advice. Kalkine provides only general financial advice through its research reports following a person becoming a member. The reports contain buy/sell/hold and other recommendations in relation to equity securities, managed funds and other managed investment schemes and other financial advice products. The recommendations and opinions in this report and on Kalkine website do not take into account any of your investment objectives, financial situation or needs. Before you make a decision about whether to acquire a financial product, you should obtain the Product Disclosure Statement from the product issuer. You should consider the appropriateness of advice taking into account your own objectives, financial situation and needs and seek independent financial advice before making any financial decisions. If you act on the advice in the research reports, you may have to pay fees, expenses or other amounts (but not to Kalkine). Further information about the complaints and dispute resolution process, as well as information about Kalkine’s duties are available on Kalkine’s website. Please read our Financial Advice Provider (FAP) disclosure statement and Complaints Handling Guide, which are available on the website.
Past performance is not a reliable indicator of future performance.
 Please wait processing your request...