This report is an updated version of the report published on 11 July 2025 at 11:17 AM AEST
Section 1: Company Overview, Low Carbon Emission Initiatives and Fundamentals
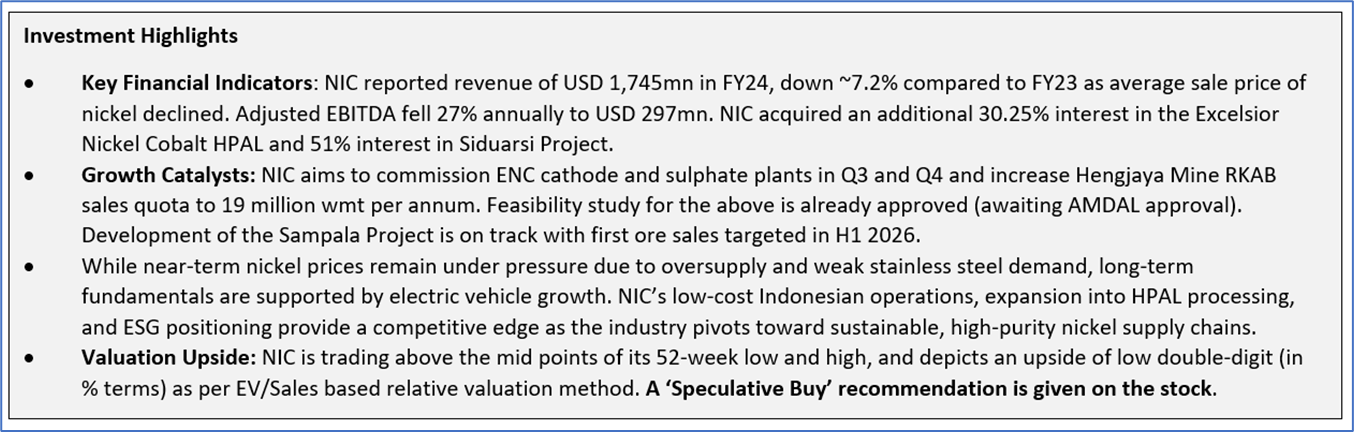
Section 1.1: Nickel Industries Limited (ASX: NIC) is an ASX-listed nickel ore mining and nickel pig iron production company with operations in Singapore and Indonesia. It holds an 80% stake in the Hengjaya Mine, Ranger Nickel project and in the Angel Nickel project. Kalkine’s Low Carbon Research Report covers the Investment Highlights, Low Carbon Emission Initiatives, Key Financial Metrics, Risks, and Technical Analysis along with the Valuation, Target Price, and Recommendation on the stock.
Section 1.2: Why Low Carbon Emission Matters?
The shift toward a low-carbon economy is one of the most significant challenges of current time, spurred by the urgent need to combat climate change and reduce the environmental impact of corporate activities. This report covers the ASX-listed low-carbon emission company, Nickel Industries Ltd (ASX: NIC), that is committed to sustainability and responsible environmental practices.
Source: Company Filings; Analysis by Kalkine Group
Carbon and Waste Management - Key Metrics
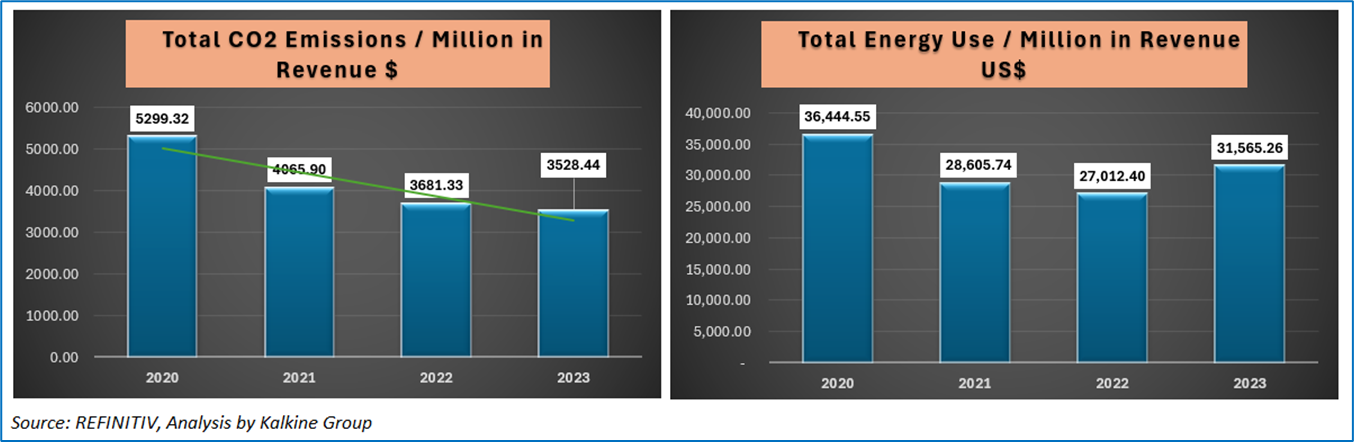
The image below highlights Nickel Industries' environmental performance from 2020 to 2023. The company reduced its CO₂ emissions intensity, dropping from 5,299.32 to 3,528.44 tonnes per million dollars of revenue, showing strong progress in lowering its carbon footprint. In contrast, while energy use per revenue initially fell from 36,444.55 to 27,012.40 units by 2022, it rose again to 31,565.26 in 2023, indicating some operational or project-related challenges (arising from increased energy demand from new projects such as HPAL plant construction, and changes in energy sources). Overall, the data reflects meaningful gains in carbon efficiency, though energy efficiency improvements require renewed focus. This improvement highlights the company's focused efforts toward cleaner operations, likely supported by initiatives such as adopting renewable energy, introducing electric vehicle fleets, and enhancing operational efficiency.
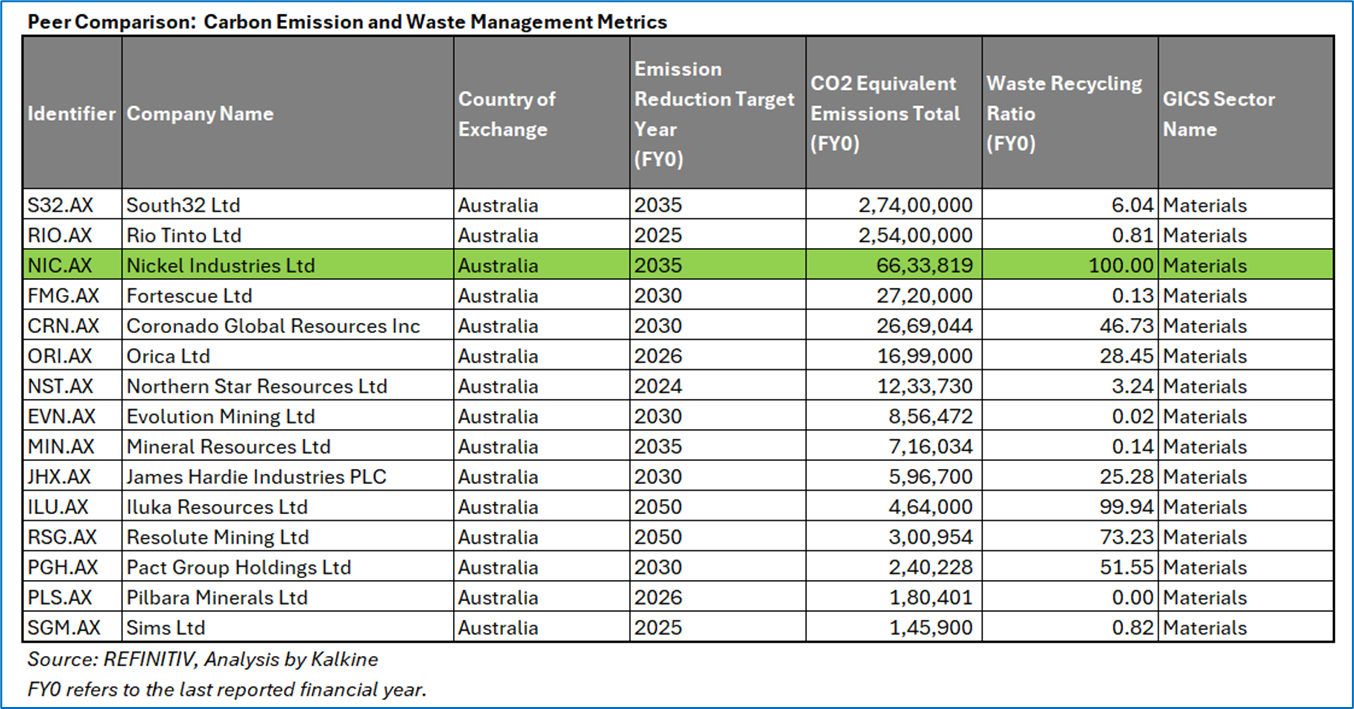
Peer Comparison: Carbon Emission and Waste Management Metrics
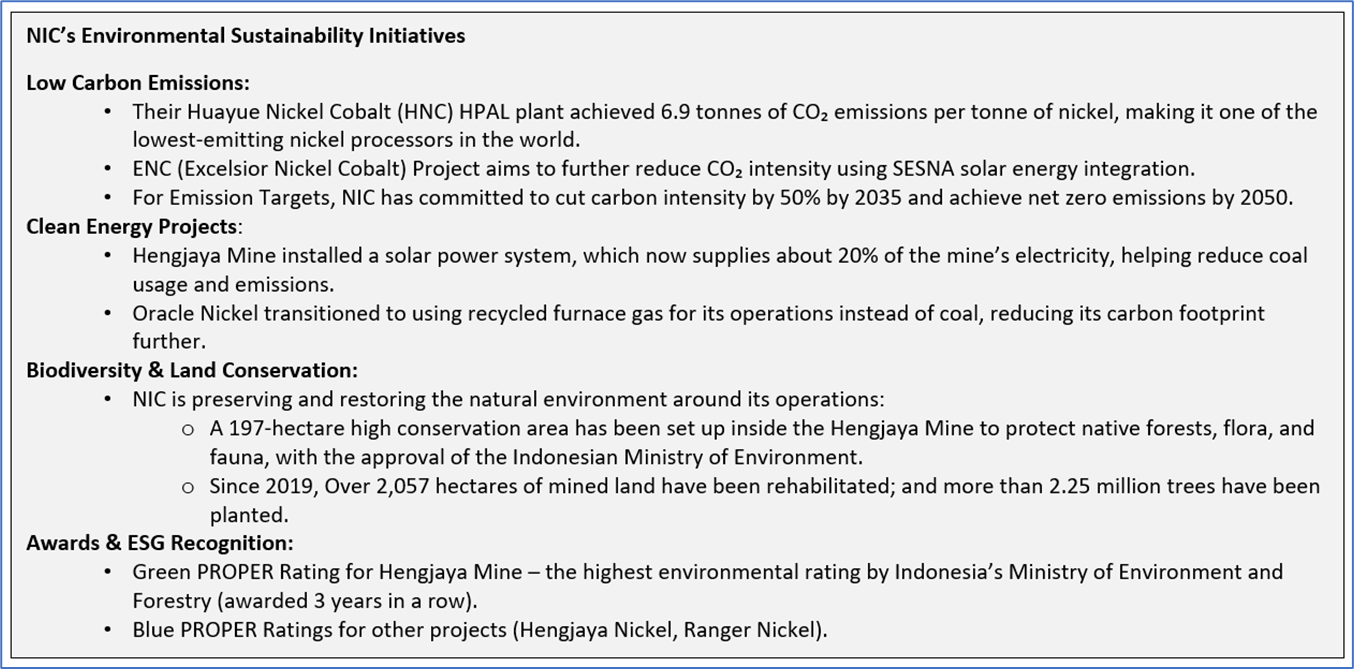
The peer comparison chart below highlighted Nickel Industries Ltd as a top performer in environmental sustainability among Australian materials companies. NIC reported comparatively low CO₂ emissions of 6.63 million tonnes, reflecting its strong focus on low-emission nickel production, as detailed in its recent sustainability reports. Notably, it achieved a 100% waste recycling ratio, the highest among all peers, indicating that no operational waste is sent to landfill. This aligns with NIC’s initiatives like solar energy adoption, electric haul trucks, and biodiversity conservation. With a 2035 emissions reduction target, NIC demonstrates a strong long-term commitment to sustainability while outperforming many industry giants in both carbon and waste management efficiency.
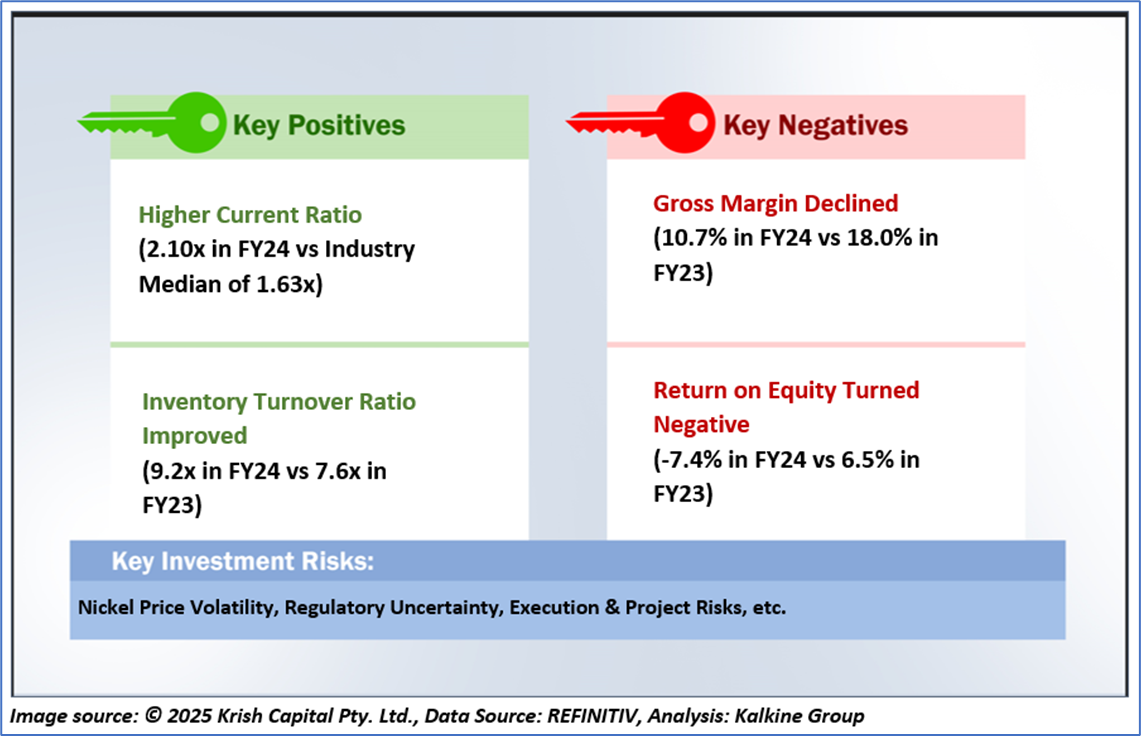
1.3 The Key Positives, Negatives, Investment Highlights, and Risks
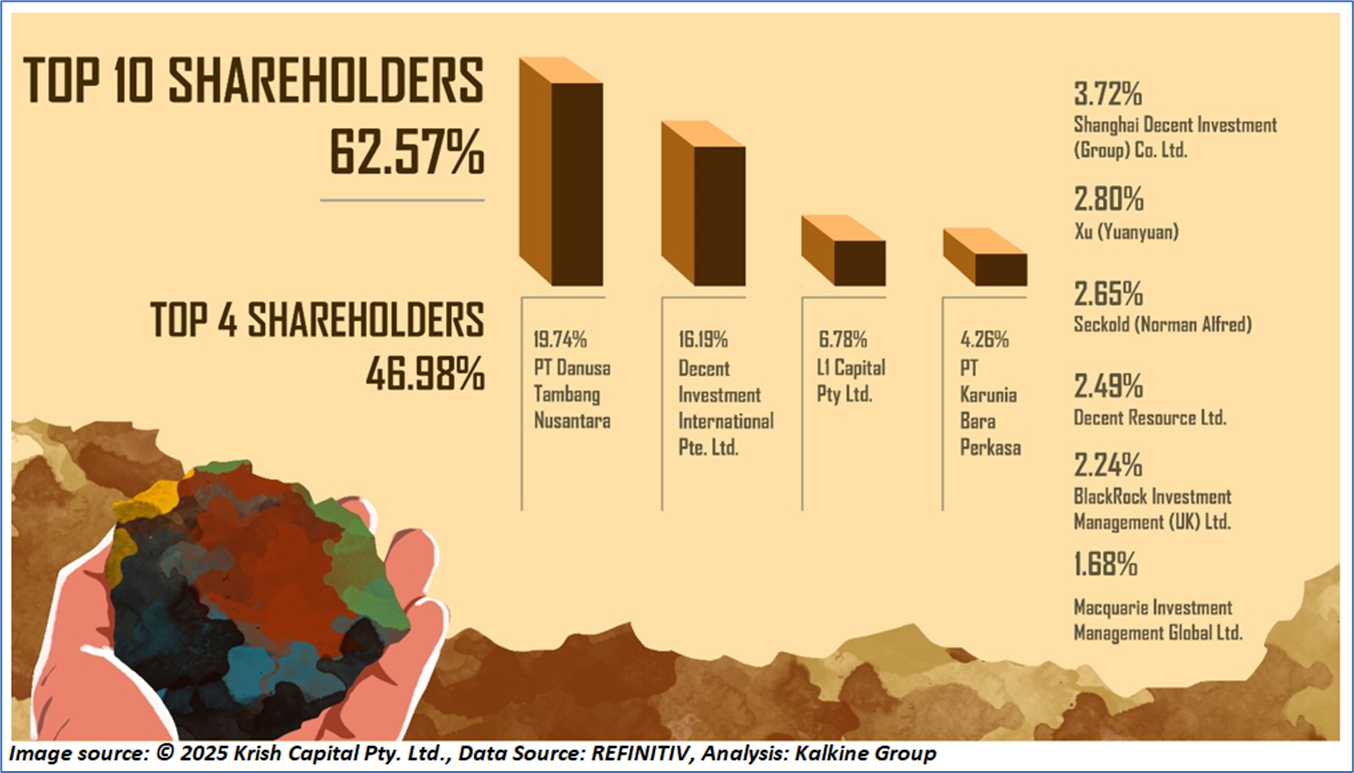
1.4 Top 10 Shareholders:
The top 10 shareholders together form ~62.57% of the total shareholding. PT Danusa Tambang Nusantara and Decent Investment International Pte. Ltd., hold maximum stakes in the company at ~19.74% and ~16.19%, respectively.
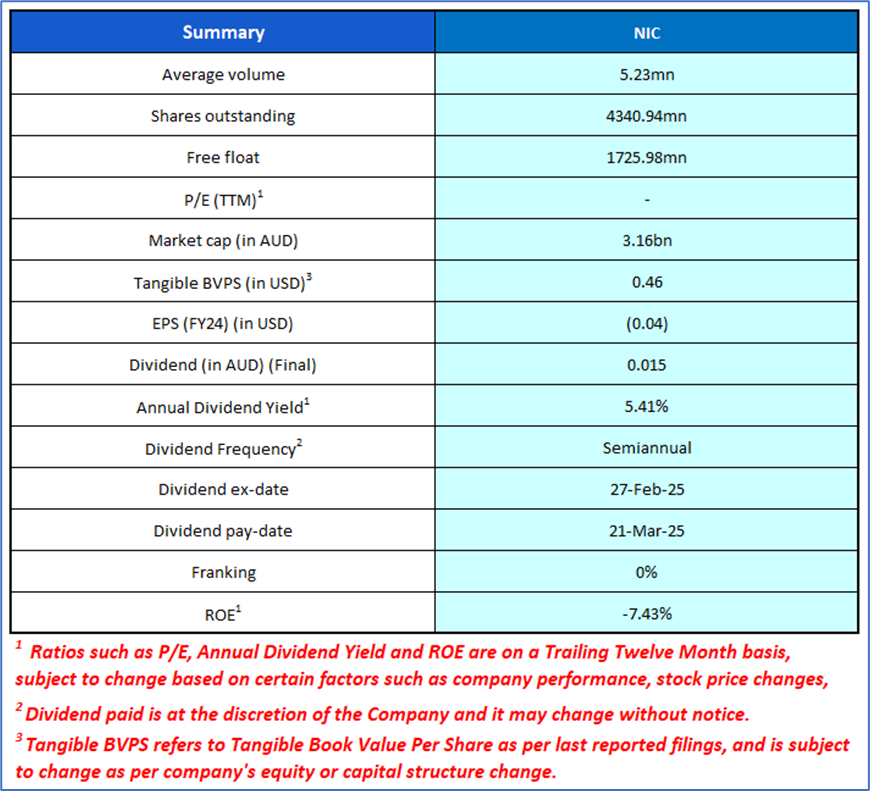
1.5 Key Metrics: In FY24, NIC's quick ratio was 1.70x compared to industry median of 1.13x. Below are captured other metrics:
Section 2: Business Updates, Financial and Operational Highlights
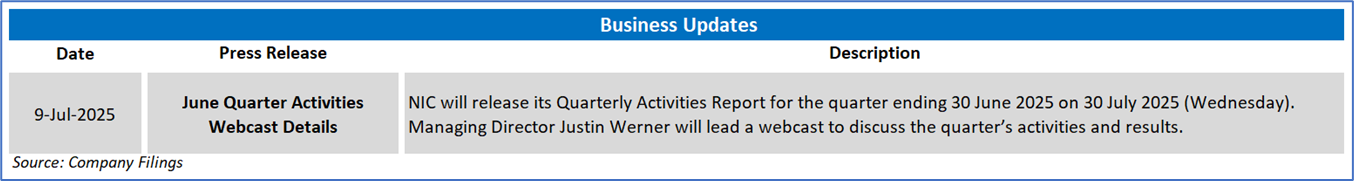
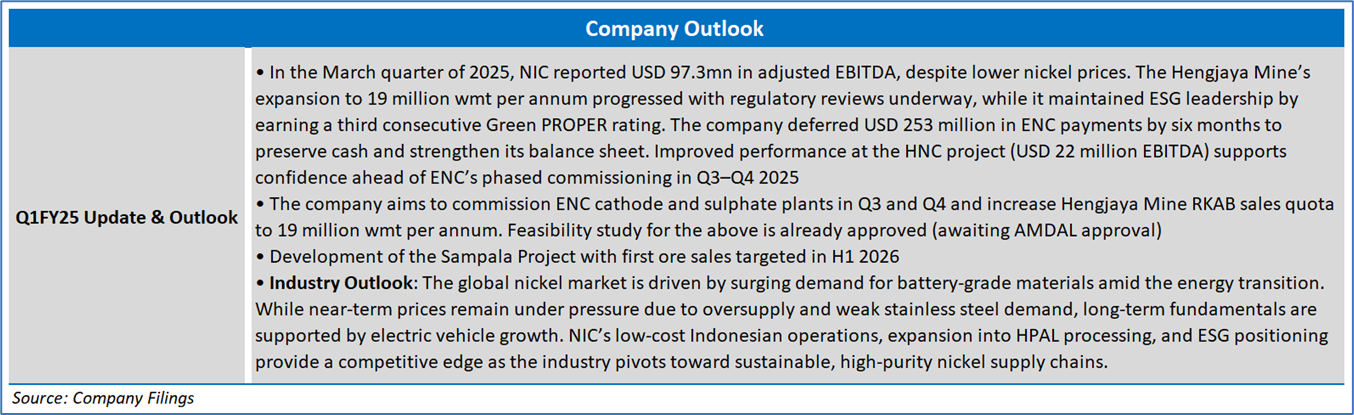
2.1 Recent Business Updates:
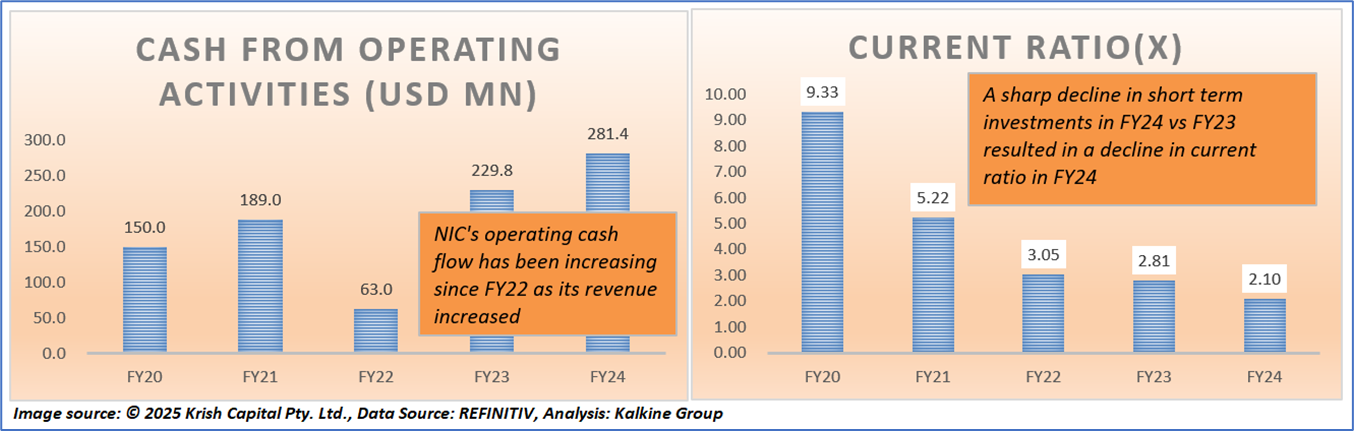
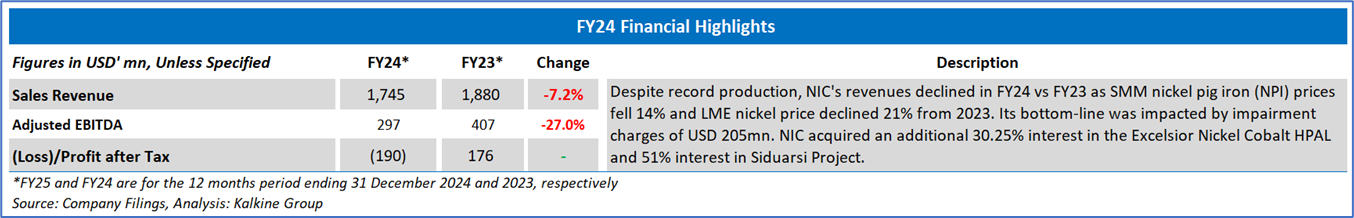
2.2 FY24 Results Highlights
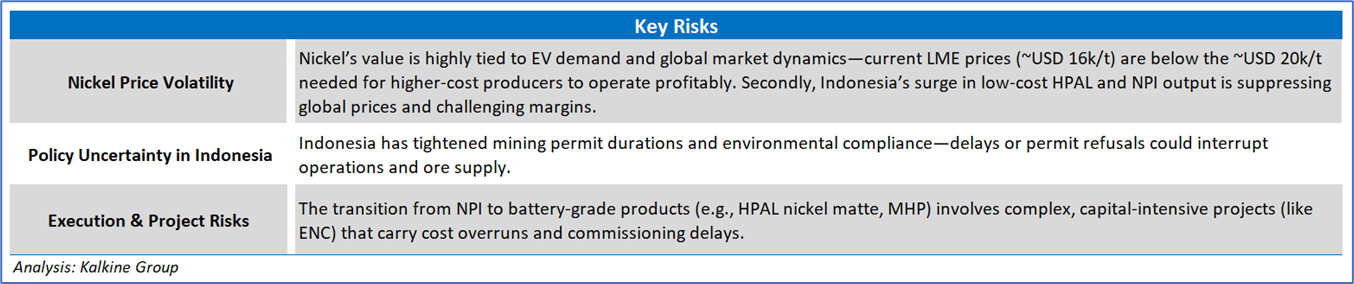
Section 3: Key Risks and Outlook:
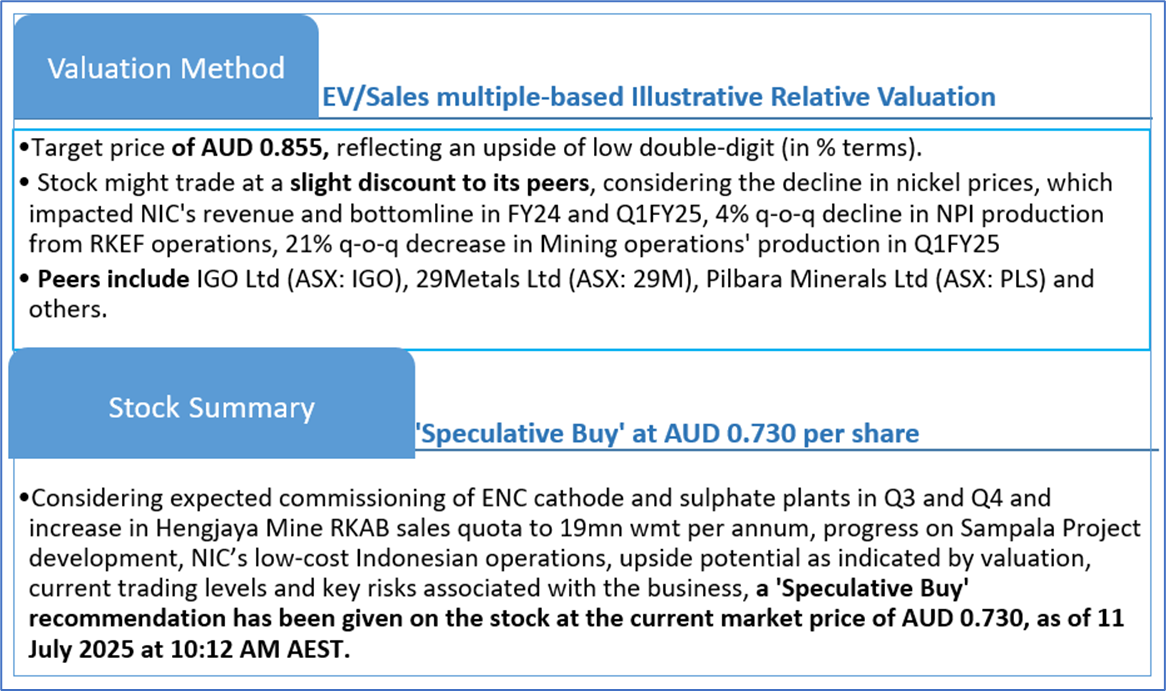
Section 4: Stock Recommendation Summary
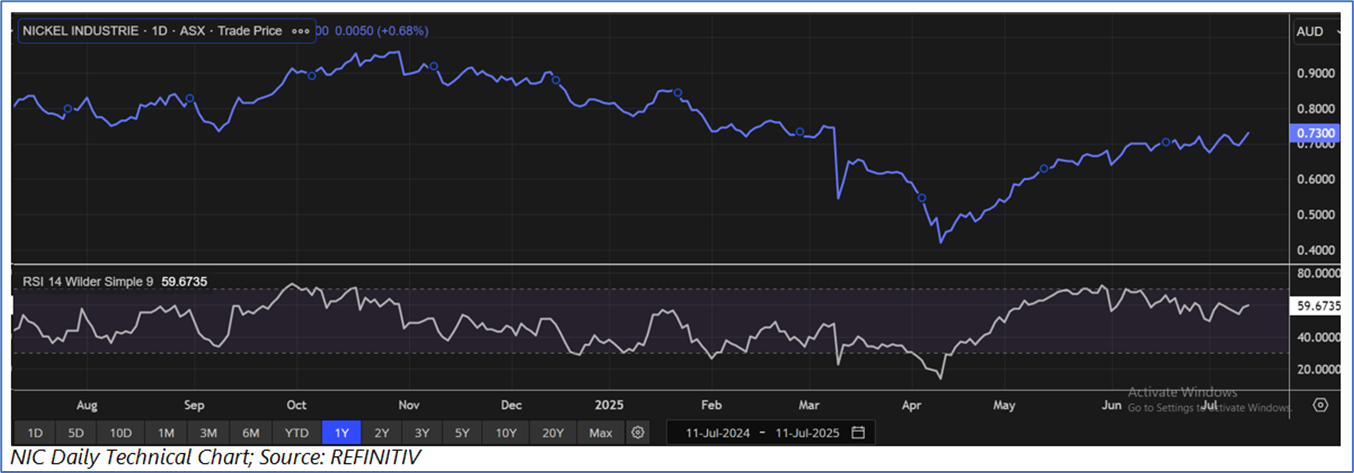
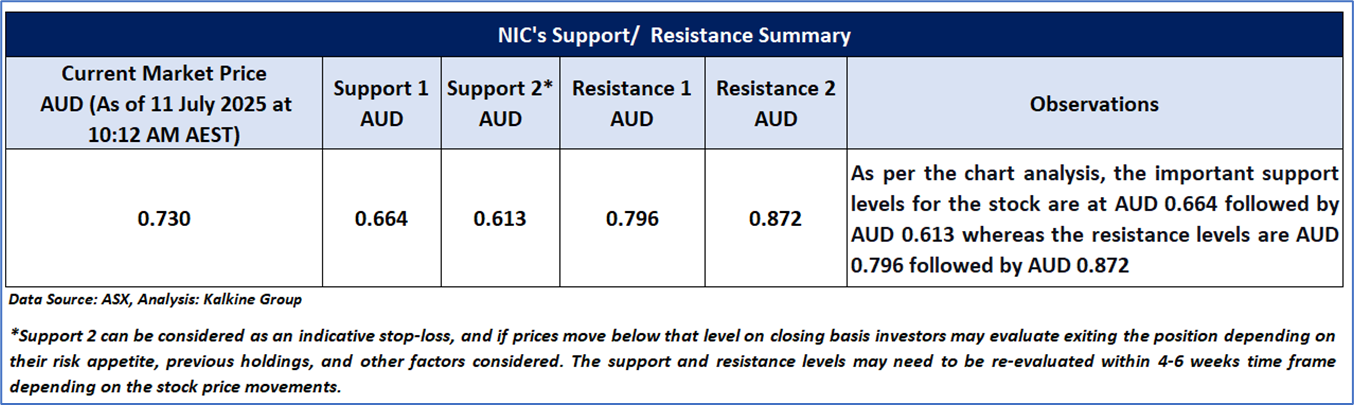
4.1 Price Performance and Technical Summary
The stock price has increased by ~2.77% in the last one month, whereas over the last six months, it has declined by ~7.47%. The stock has a 52-week low and 52-week high of AUD 0.420 and AUD 0.995, respectively, and is currently trading above the midpoints of its 52-week low and 52-week high. NIC was last covered in a report dated ‘20 May 2025’.
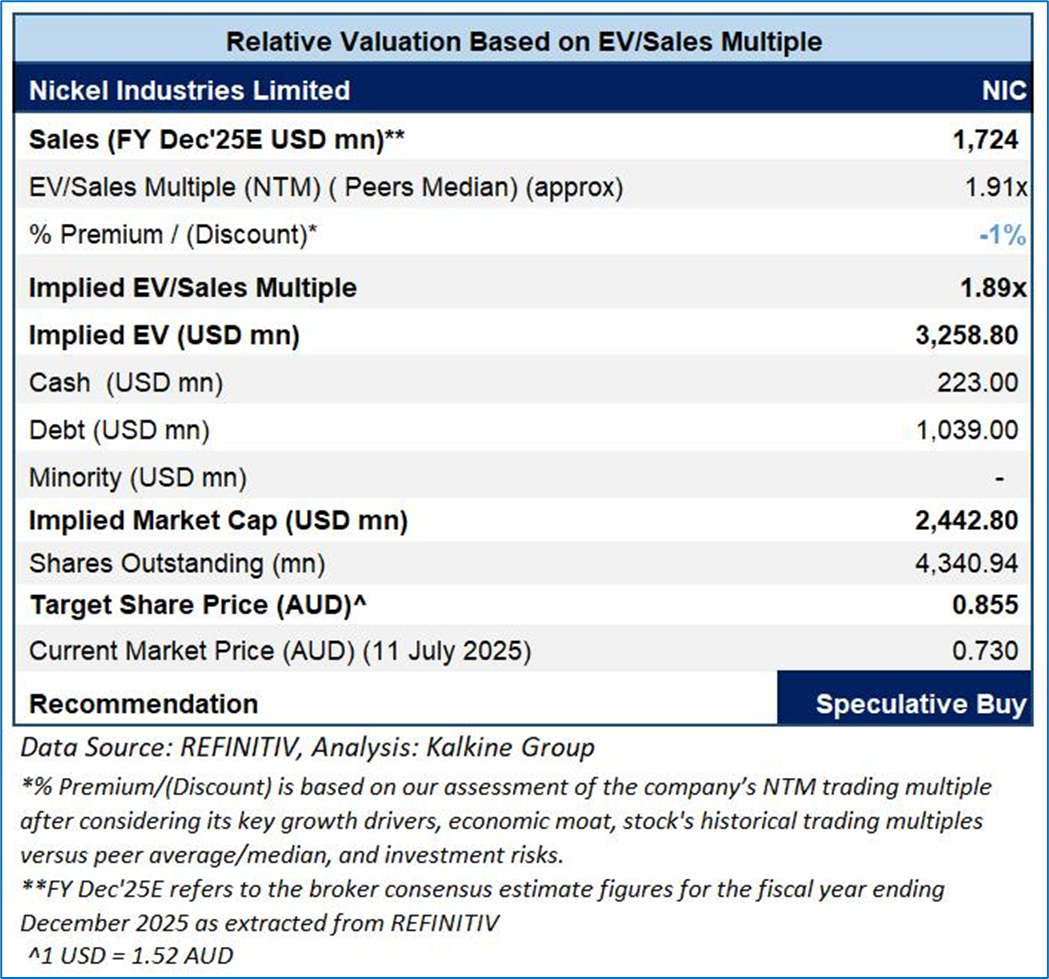
4.2 Fundamental Valuation
Valuation Methodology: EV/Sales Multiple Based Relative Valuation (Illustrative)
Markets are trading in a highly volatile zone currently due to certain macro-economic issues and geopolitical tensions prevailing. Therefore, it is prudent to follow a cautious approach while investing.
Note 1: Past performance is neither an indicator nor a guarantee of future performance.
Note 2: The reference date for all price data, currency, technical indicators, support, and resistance levels is 11 July 2025. The reference data in this report has been partly sourced from REFINITIV.
Note 3: Investment decisions should be made depending on an individual's appetite for upside potential, risks, holding duration, and any previous holdings. An 'Exit' from the stock can be considered if the Target Price mentioned as per the Valuation and or the technical levels provided has been achieved and is subject to the factors discussed above.
Note 4: Dividend Yield may vary as per the stock price movement.
Note 5: Kalkine reports are prepared based on the stock prices captured either from REFINITIV or Trading View. Typically, REFINITIV or Trading View may reflect stock prices with a delay which could be a lag of 25-30 minutes. There can be no assurance that future results or events will be consistent with the information provided in the report. The information is subject to change without any prior notice.
Technical Indicators Defined: -
Support: A level at which the stock prices tend to find support if they are falling, and a downtrend may take a pause backed by demand or buying interest. Support 1 refers to the nearby support level for the stock and if the price breaches the level, then Support 2 may act as the crucial support level for the stock.
Resistance: A level at which the stock prices tend to find resistance when they are rising, and an uptrend may take a pause due to profit booking or selling interest. Resistance 1 refers to the nearby resistance level for the stock and if the price surpasses the level, then Resistance 2 may act as the crucial resistance level for the stock.
Stop-loss: It is a level to protect further losses in case of unfavourable movement in the stock prices.
Disclaimer This report has been issued by Kalkine New Zealand Limited (FSP691351) (NZBN:9429047678101) (“Kalkine”). Kalkine is a Financial Advice Provider (“FAP”) and is authorised by a Class 1 Financial Advice Provider Licence issued by Financial Markets Authority (“FMA”) to provide financial advice. Kalkine provides only general financial advice through its research reports following a person becoming a member. The reports contain buy/sell/hold and other recommendations in relation to equity securities, managed funds and other managed investment schemes and other financial advice products. The recommendations and opinions in this report and on Kalkine website do not take into account any of your investment objectives, financial situation or needs. Before you make a decision about whether to acquire a financial product, you should obtain the Product Disclosure Statement from the product issuer. You should consider the appropriateness of advice taking into account your own objectives, financial situation and needs and seek independent financial advice before making any financial decisions. If you act on the advice in the research reports, you may have to pay fees, expenses or other amounts (but not to Kalkine). Further information about the complaints and dispute resolution process, as well as information about Kalkine’s duties are available on Kalkine’s website. Please read our Financial Advice Provider (FAP) disclosure statement and Complaints Handling Guide, which are available on the website.
Past performance is not a reliable indicator of future performance.
 Please wait processing your request...