
Company Overview: New Zealand Oil & Gas Limited is an oil and gas company. The Company's segments include Tui area oil field, which is engaged in the developing, producing and selling of crude oil in the petroleum mining permit area of PMP 38158 located in the offshore Taranaki basin, New Zealand; Kupe oil and gas field, which is engaged in developing, producing and selling of natural gas, liquefied petroleum gas (LPG) and condensate (light oil) in the petroleum mining permit area of PML 38146 located in the offshore Taranaki basin, New Zealand; Oil & gas exploration, which is engaged in the exploration and evaluation of hydrocarbons in the offshore Taranaki basin and offshore Canterbury basin, New Zealand and in Indonesia; Cue Energy Resources Limited (Cue), and Other & unallocated. Cue focuses on exploration in West Australia and in Indonesia. The Company has interests in The Kupe gas and light oil field and the Tui oil fields.
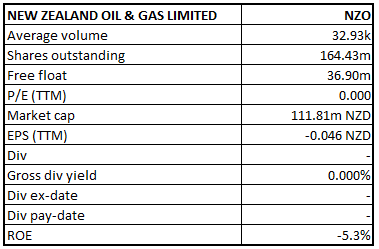
NZO Details
Decent Top-line Growth at CAGR of ~8.1% for FY17-19: New Zealand Oil & Gas Limited (NZX: NZO) has subsurface expertise, exploration interests in New Zealand, Australia and Indonesia, and a controlling interest in ASX-listed Cue Energy. Its operating segment includes Kupe oil and gas field (Kupe), oil & gas exploration and Cue Energy Resources Limited (Cue). The company witnessed a compound annual growth rate of ~8.1% in revenue over the period covering FY17-FY19. Recently, the company reported September quarter activity and cashflow reports, wherein net production revenue for the quarter came in at $5.7 million. The company ended September quarter with decent cash position at $110,561,000.
It posted a decent top-line growth for FY19 as compared to the previous year. Its ongoing projects across several geographies, strong balance sheet along with current oil price rise and promising natural gas outlook are expected to help the company in delivering sustainable results for its shareholders in the coming times.
The Company’s growth strategy includes strategic acquisition and optimization of its operational expenses. It has put its emphasis to grow through transformational Deepwater exploration and revive its operation where the company made heavy investments in the oil and gas field in New Zealand in the last few years, where new offshore exploration permits were halted by New Zealand government.
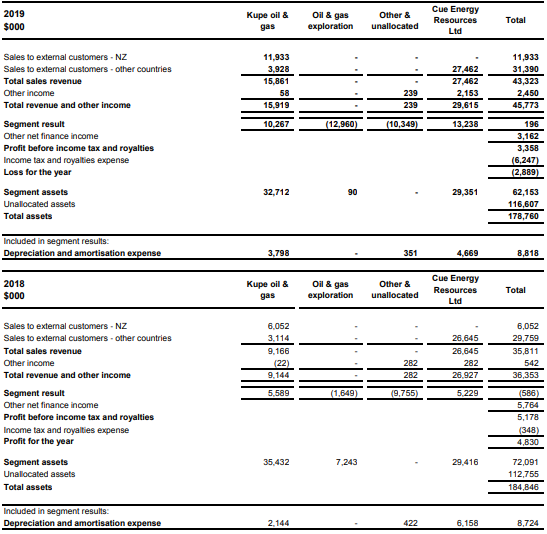
Segment Information (Source: Company Reports)
September’19 Quarter Key Highlights: Net production revenue for the quarter was reported at $5.7 million, inclusive of a six-monthly royalty payment of $1 million, offset by expenses including seasonal payments, project costs, exploration expenditure of $0.9 million and an income tax payment of $1.3 million.
Net cash inflow from operating activities for the period was reported at $24,000. Net cash outflow from investing activities for the period was reported at $4,000. Net cash outflow from financing activities for the period was reported at $30,000. Cash balance at the end of the quarter was reported at $110,561,000 comprising cash on hand and bank at $17,452,000; deposits at call, term and bank bills at $92,922,000; and cash related to other joint venture at $187,000. The cash balance increased from $105.6 million in the June quarter to $110.6 million in September quarter, mainly due to foreign exchange gains of $5 million resulting from a weaker NZD against foreign currency-denominated balances.
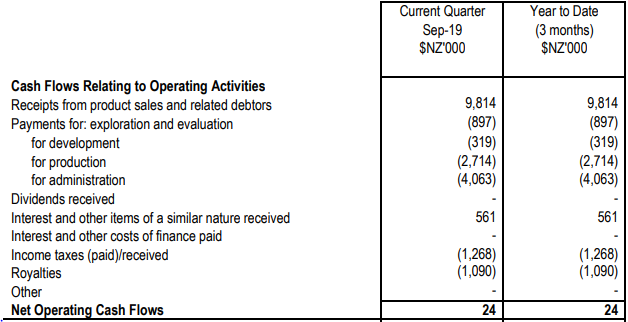
September’19 Quarter Operating Cash Flow Statement (Source: Company Reports)
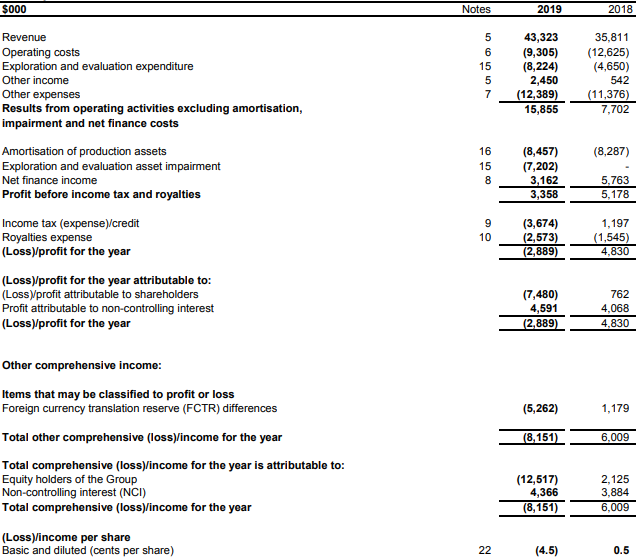
FY19 Key Highlights for the period ended on June 30, 2019: Revenue for the full year period was reported at $43.3 million, as compared to $35.8 million in the previous period. This can be attributed to increase in revenue from both Kupe and Cue Energy, where Kupe contributed revenue of $15.9 million as compared to $9.2 million in the prior year, and Cue Energy contributed revenue of $27.4 million, as compared to $26.6 million in the previous year. NZO reported a net loss of $2.9 million for the period, as compared to a net profit of $4.8 million in the previous year.
As per company’s balance sheet, trade receivables and prepayments for the period were reported at $7,996,000, as compared to $11,772,000 in the previous year. Inventories for the period were reported at $2,595,000, flat as the previous year. Trade payables for the period were reported at $5,975,000, as compared to $8,546,000 in the previous period.
Cash balance at the end of the period was reported at $105.6 million, as compared to $98.0 million in the previous year. Out of this balance, $23.5 million were committed for the New Zealand Oil & Gas share (including its carry of Cue Energy’s share) of the Ironbark well, due to be drilled in Western Australia in late 2020, and $12.0 million were committed for Cue Energy’s share after carry. The Board of Directors declared no dividend for the year.
During the period, the company entered into a scheme implementation agreement with O.G. Oil & Gas (Singapore) Pte. Ltd. (OGOG) which advises that OGOG will acquire all of the fully paid ordinary shares of NZO that it does not already own for NZ$0.62 per share, subject to unanimous shareholders vote in favor of the transaction.
Operational development of the company witnessed onshore drilling of the Kohatukai well in Taranaki. The company exited from its Indonesian exploration and development project and farmed into the Ironbark joint venture.
Recent Updates:
Recently, the company’s director and audit committee Chair Rebecca DeLaet stepped down from the Board for personal reasons, effective from December 20, 2019. The Board has appointed Alastair McGregor as the new Audit Committee Chair.
In another update, NZO’s subsidiary (50.04% interest) Cue Energy Resources (ASX: CUE) provided an update on the Mahato exploration well. Cue Energy holds a stake of 12.5% in the Mahato PSC. CUE advised that it has paid claimed cash call to the operator of the Mahato PSC, Texcal Mahato EP Ltd, which was earlier on a moratorium due to some deficiencies. The company is expected to provide an update to the market about any material developments in this matter.
On December 12, 2019, the company announced about the voting results in its annual general meeting, where six resolutions were passed with majority votes of the shareholders.
Top 10 Shareholders: The top 10 shareholders have been highlighted in the table, which together form around 76.49% of the total shareholding. O.G. Oil & Gas (Singapore) Pte. Ltd. and Accident Compensation Corporation hold maximum interests in the company at 69.86% and 1.82%, respectively.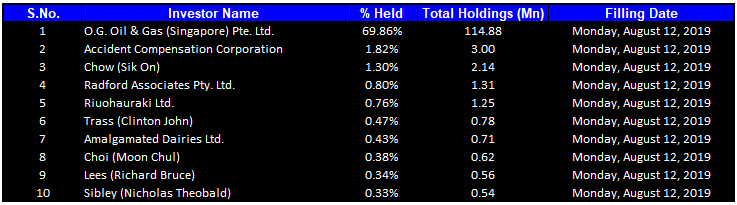
Top 10 Shareholders (Source: Thomson Reuters)
A Quick Look at Key Metrics: Its gross margin and EBITDA margin for FY19 stood at 59.0% and 39.5%, better than the industry median of 44.3% and 32.2%, respectively, implying decent fundamentals for the company. Current ratio for FY19 stood at 11.29x, higher than the industry median of 1.21x, implying a decent liquidity position for the company.
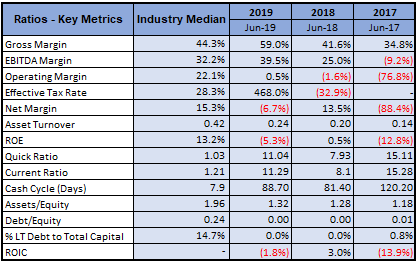
Key Metrics (Source: Thomson Reuters)
Key Risks: The company is susceptible to certain risks such as actions by governments, political events or tax authorities; global economic uncertainty and liquidity; natural catastrophes; climate change; etc.
Oil Outlook: Crude Oil WTI Futures (CFD) at the time of writing traded at US$59.36 (16:37 (UTC+11)). A sharp rise in oil price was seen following a recent escalation of tension between US-Iran which is not expected to be settled down shortly, leading to the rise of supply concerns, globally. Moreover, recent statements from Iraqi ministers asking the US to withdraw their troops from their land, has led to rise of economic sanctions over Iraq which may lead to further supply disruptions globally leading to further oil price rise. This would be beneficial for oil explorers and producers worldwide.
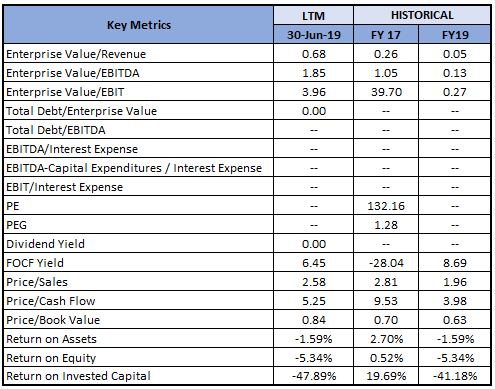
Key Valuation Metrics (Source: Thomson Reuters)
Technical Analysis:
Weekly Candle Stick Chart:
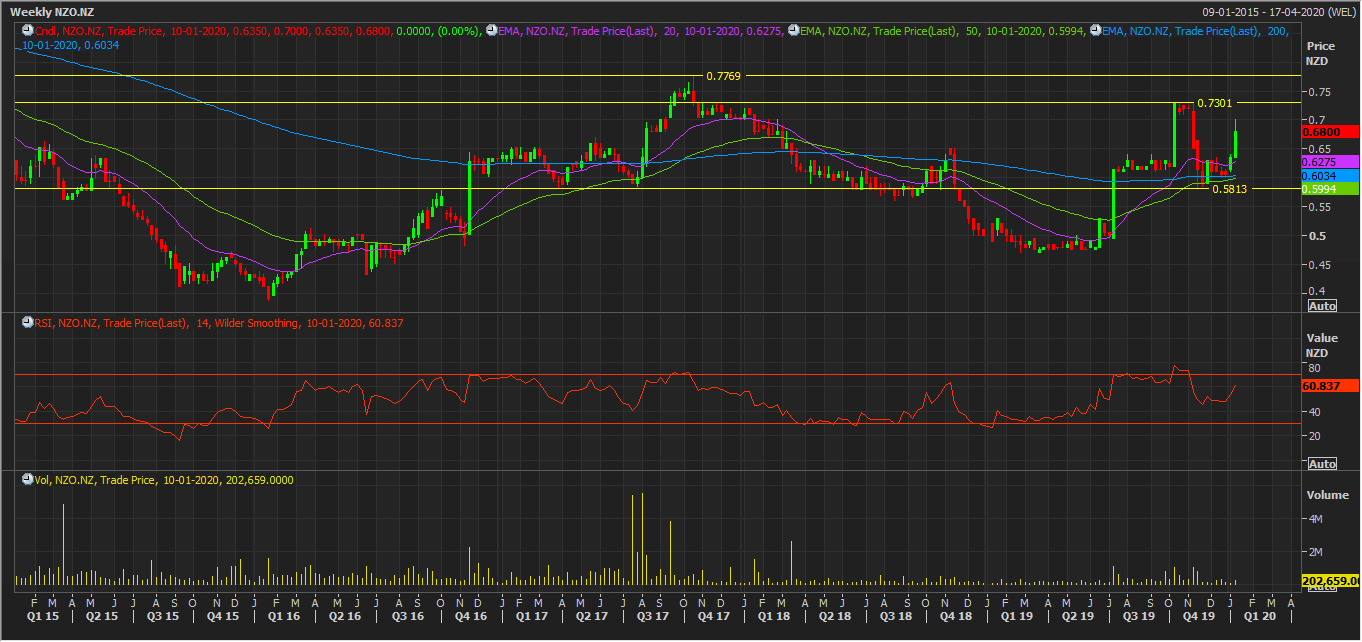
Weekly Candle Stick Chart (Source: Thomson Reuters)
The stock is trading above 200 EMA and recently crossed 20 EMA from below, indicating a bullish uptrend. Few weeks earlier, the stock made a bullish engulfing pattern near 200 EMA, which increases the probability for upward swing. 50 EMA looks to cross 200 EMA from below forming a famous “Golden Cross over”, which might lead to further upside movement.
Monthly Candle Stick Chart:
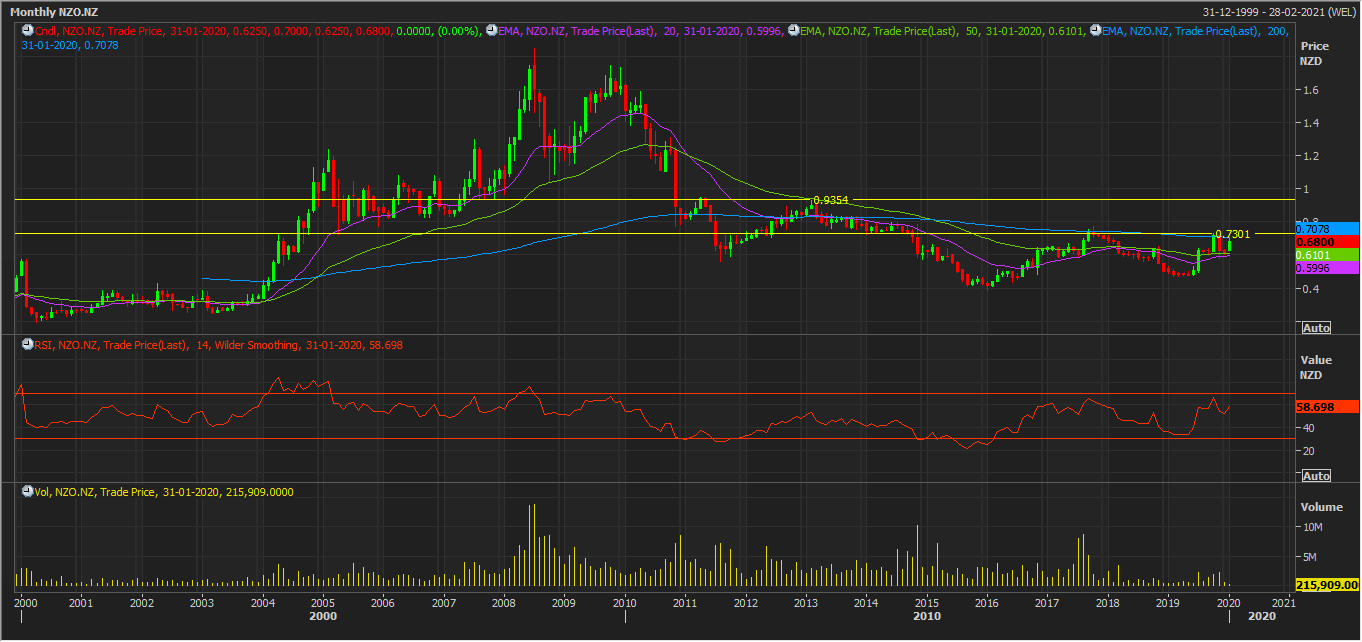
Monthly Candle Stick Chart (Source: Thomson Reuters)
The stock is trading close to the 200 EMA, which will act as a strong resistance, but with 20 EMA crossing 50 EMA from below, it may lead to an increase in probability for a possible breakout, causing the stock to rise further.
Stock Recommendation: NZO’s stock posted a return of 38.78% in one-year period. Company’s important projects include Kupe oil and gas field, Maari and Manaia oil field and Kohatukai in Taranaki production; Sampang PSC, Mahato PSC and Mahakam Hilir PSC (100% basis) in Indonesia; Clipper and Toroa (100% basis) in New Zealand; WA-359-P, WA-389-P and WA-409-P in Australia. These developments are expected to help the company in enhancing its earnings and deliver sustainable value to its shareholders. Considering the September quarter performance, profitability margins, oil outlook, and current trading levels, we give a “Speculative Buy” recommendation on the stock at the current market price of $0.680.
.png)
NZO Daily Technical Chart (Source: Thomson Reuters)
Disclaimer
Kalkine New Zealand Limited is authorised to provide class advice only. The information on this site does not take into account any of your investment objectives, financial situation or needs. Before you make a decision about whether to acquire a financial product, you should obtain the Product Disclosure Statement from the product issuer. You should consider the appropriateness of advice taking into account your own objectives, financial situation and needs and seek independent financial advice before making any financial decisions.
Past performance is not a reliable indicator of future performance.
 Please wait processing your request...