
This report is an updated version of the report published on 2 July 2025 at 1:07 PM AEST.
Section 1: Company Overview and Fundamental Insights
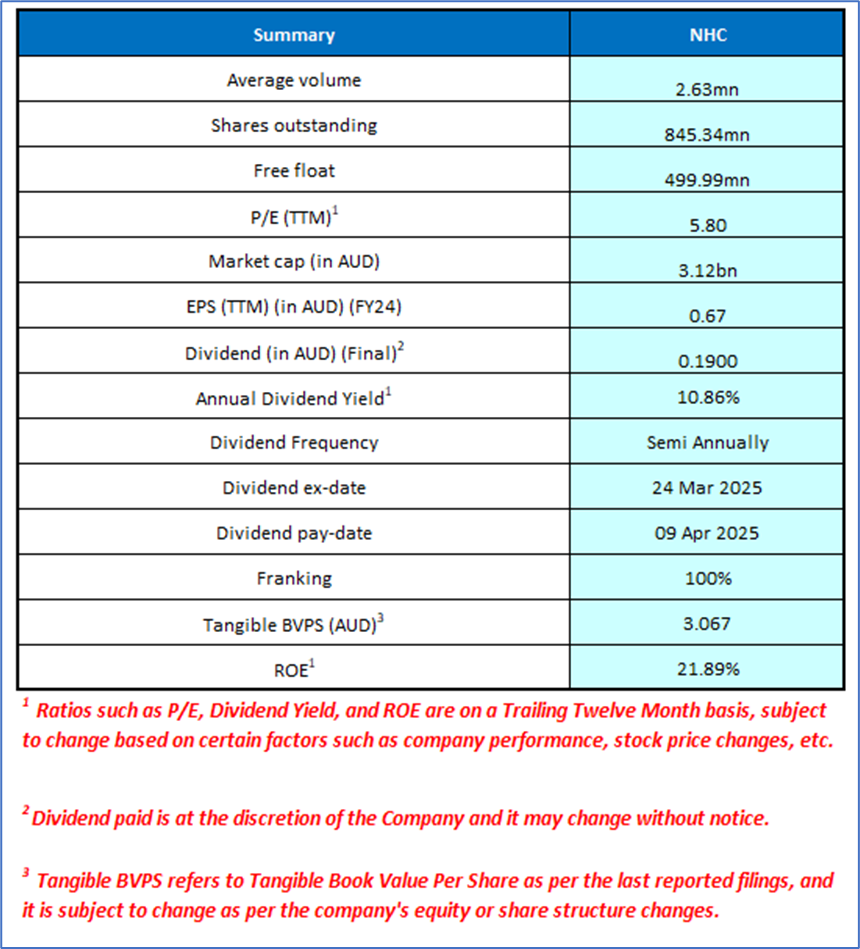
1.1 Company Overview: New Hope Corporation Limited (NHC) is an Australian diversified energy company primarily engaged in the exploration, development, production, and processing of coal and oil and gas properties. It operates mainly through three segments: Coal Mining in Queensland, Coal Mining in New South Wales, and other activities. The company owns and operates two major open-cut thermal coal mines—the New Acland project in Oakey, Queensland, and the Bengalla mine in the Hunter Valley, New South Wales. Kalkine’s Resources Report covers the Investment Highlights, Management Insights, Key Financial Metrics, Risks, Technical Analysis along with the Valuation, Target Price, and Recommendation on the stock.
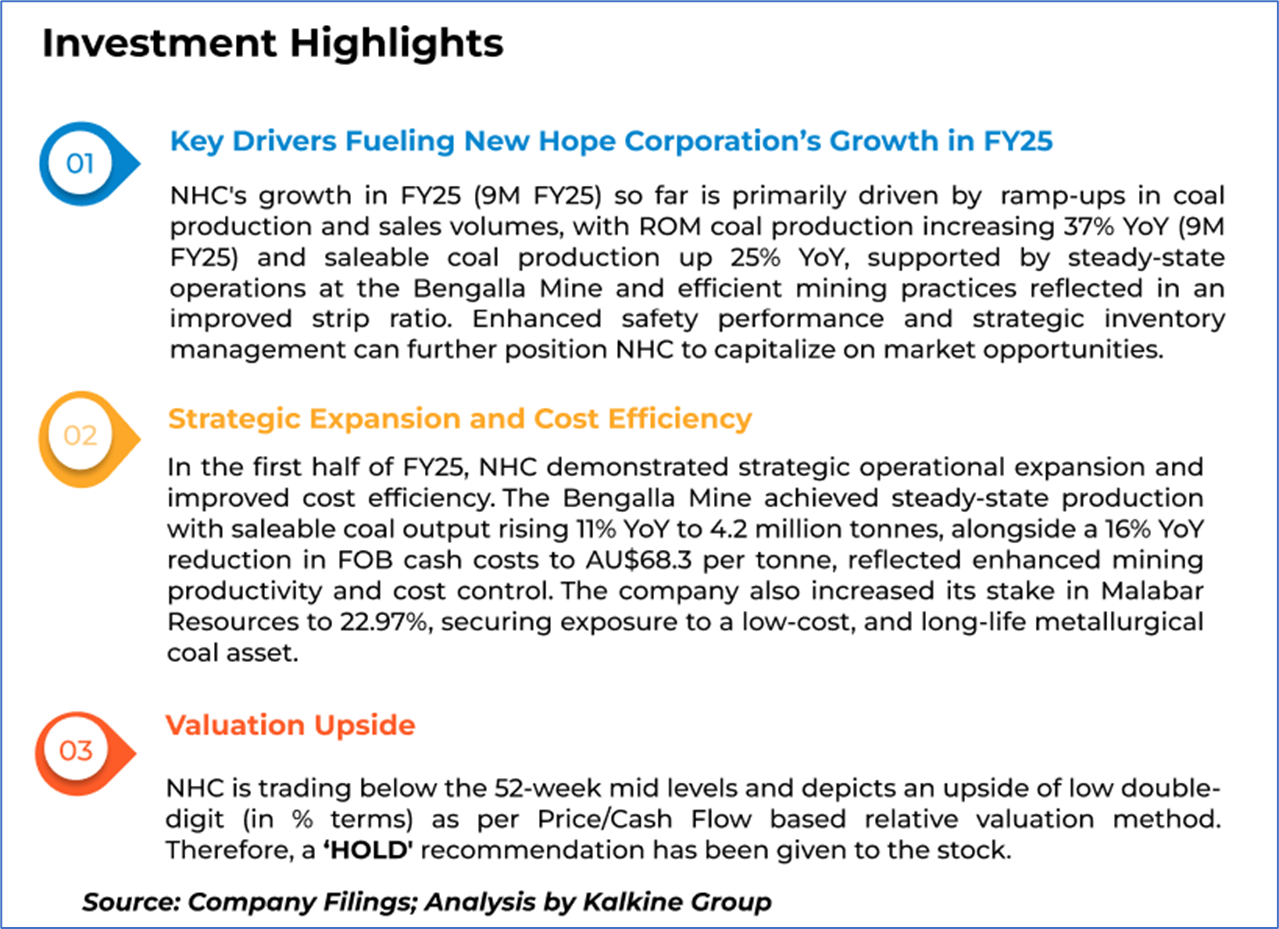
1.2 The Key Positives, Negatives, Investment Highlights, and Management Insights

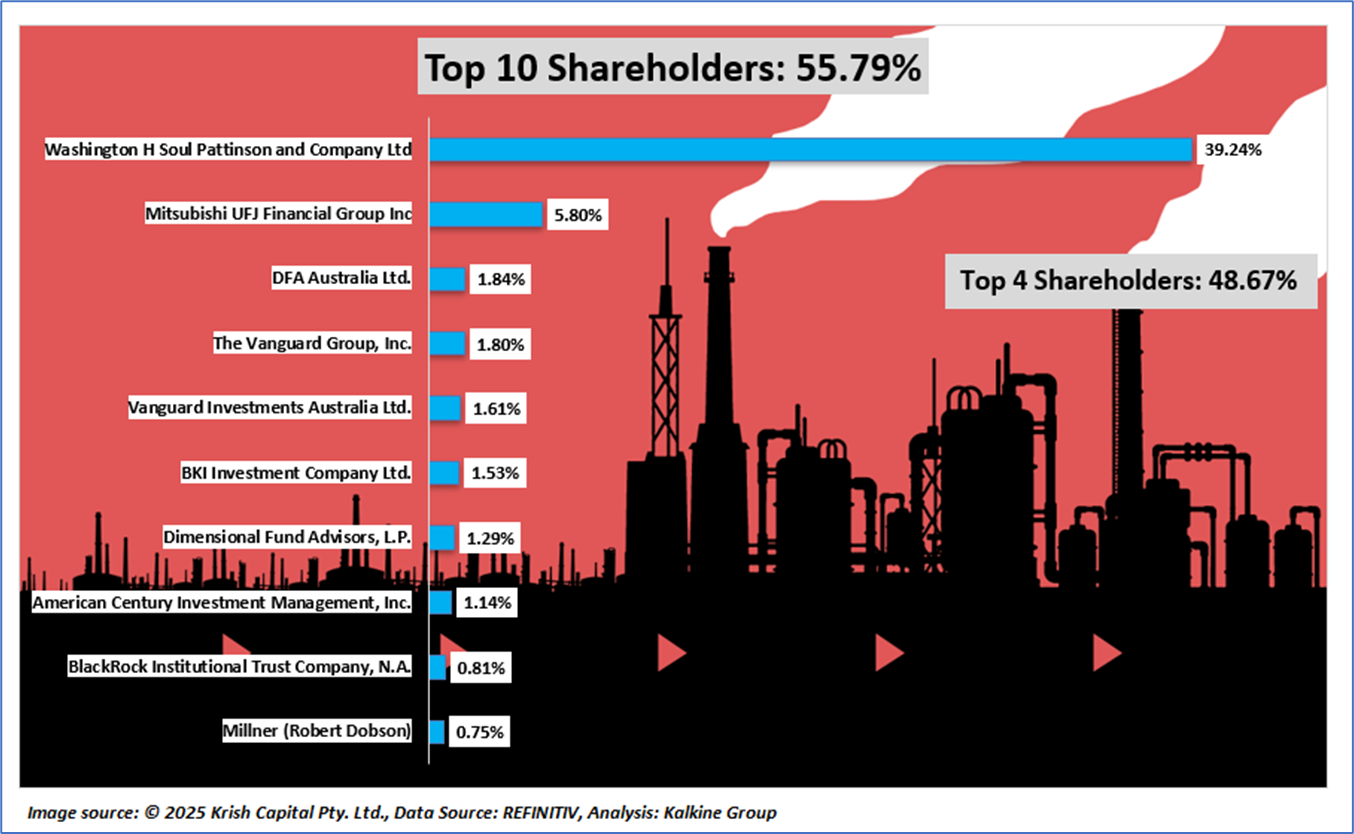
1.3 Top 10 Shareholders:
The top 10 shareholders together form 55.79% of the total shareholding. Washington H Soul Pattinson and Company Ltd and Mitsubishi UFJ Financial Group Inc hold maximum stakes in the company at 39.24% and 5.80%, respectively.
1.4 Key Metrics: From FY21 to FY24, New Hope Corporation’s net margin and dividend yield trends were primarily influenced by a combination of operational growth and market pricing dynamics. During this period, the company increased coal production—supported by the ramp-up of the Bengalla Mine and the restart of New Acland Mine—leading to higher sales volumes. However, despite these volume gains, net margins compressed notably due to a sharp decline in coal prices and rising costs, including higher rail cancellations, labour, fuel, and consumables expenses. The company’s disciplined cost control and focus on low-unit-cost assets helped sustain profitability and cash flow, supporting a relatively consistent dividend yield despite the payout cut. Below are captured some key metrics:

Section 2: Business Updates, Financial and Operational Highlights
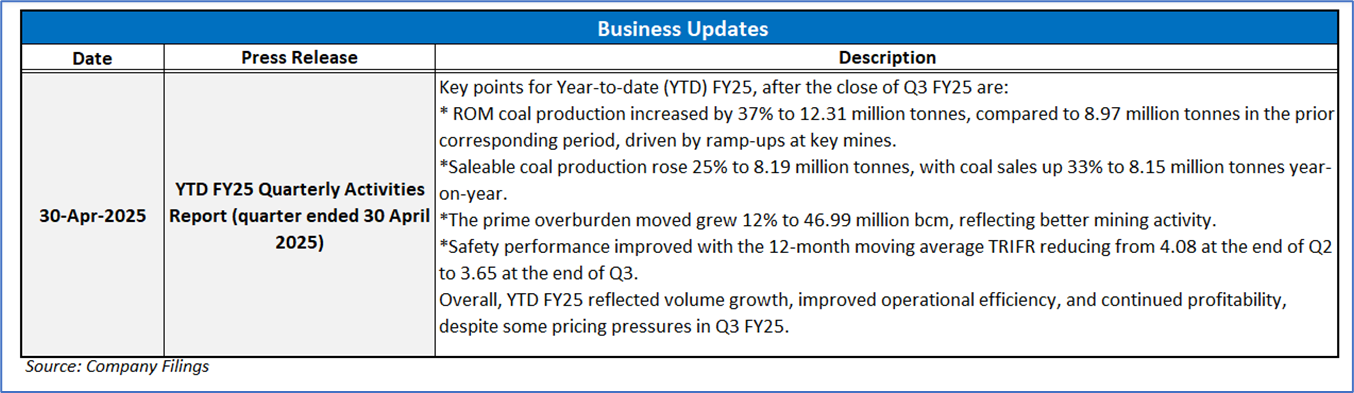
2.1 Recent Business Updates:
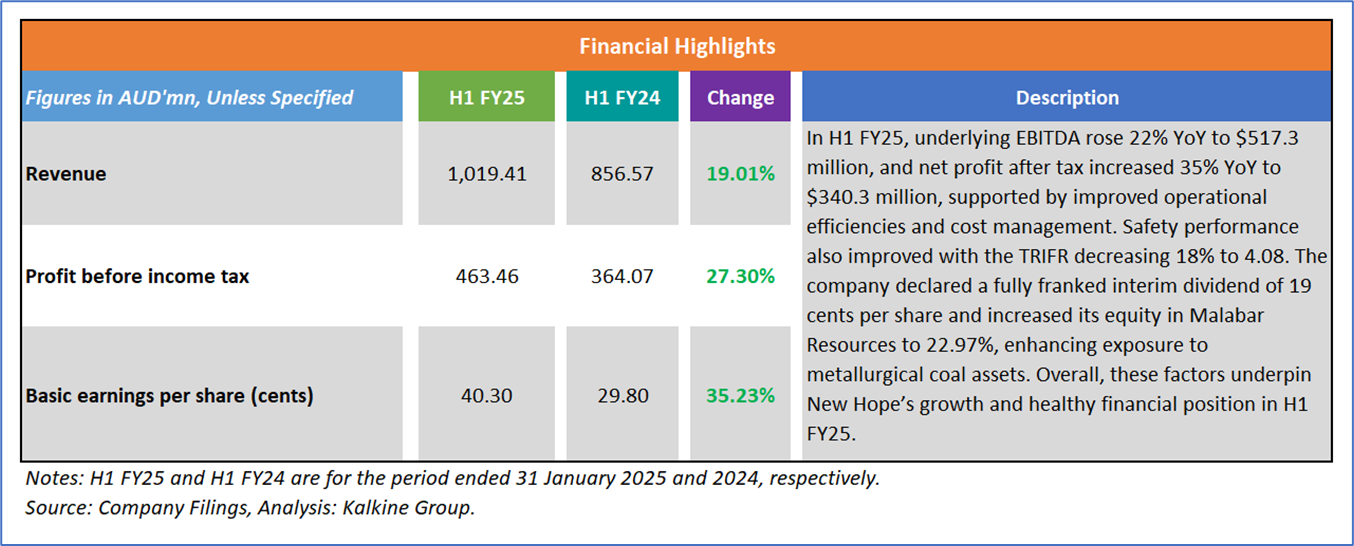
2.2 Financial Highlights: Below mentioned are some key financial highlights:
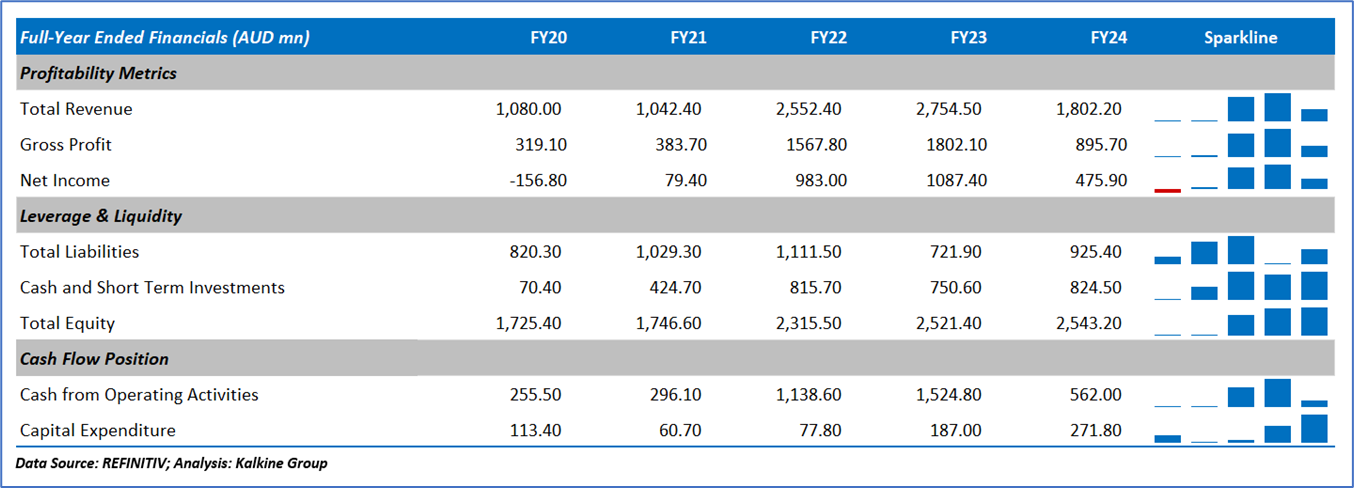
2.3 Historical Financial Trend
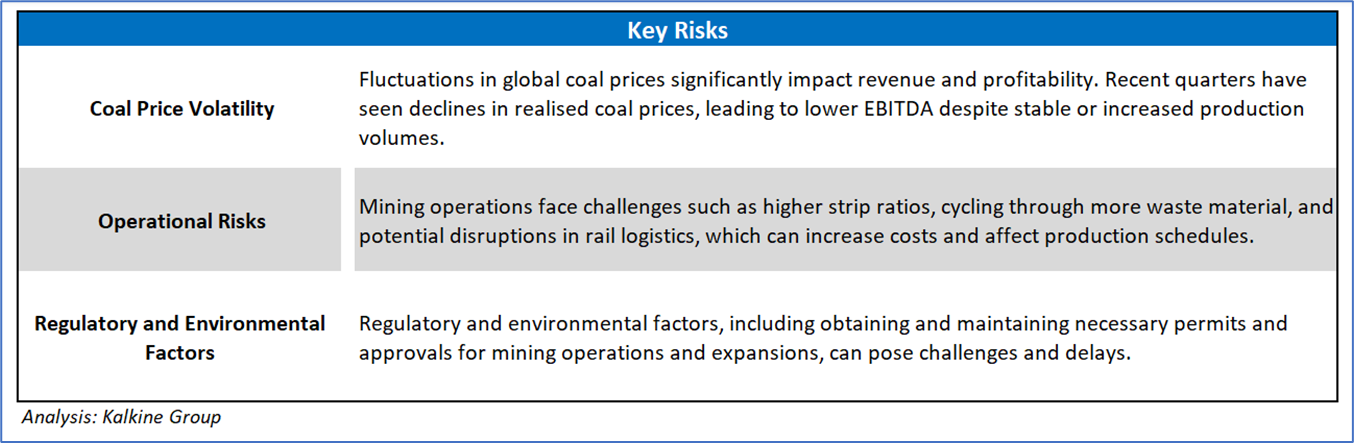
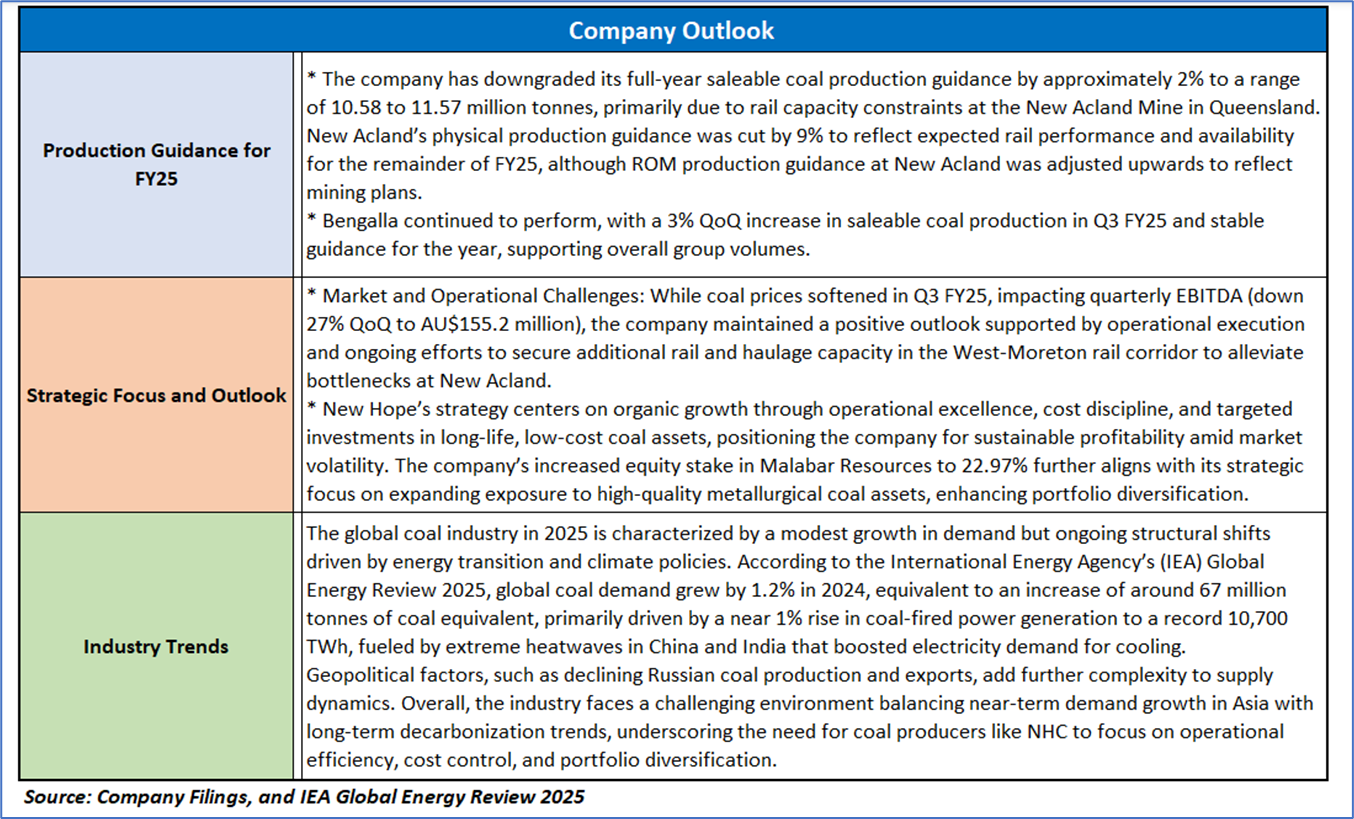
Section 3: Key Risks and Outlook:
Section 4: Stock Recommendation Summary
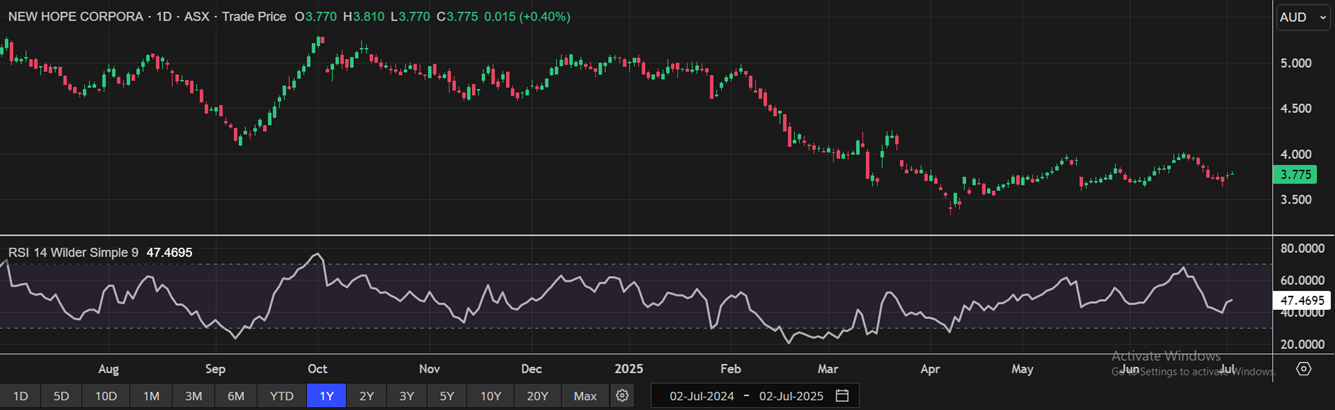
4.1 Price Performance and Technical Summary
The stock price has gained around 2.30% in the last 1 month; however, the stock price has corrected by around 24.65% in the past 6 months. The stock has a 52-week low and 52-week high of AUD 3.330 and AUD 5.300, respectively, and is currently trading below its 52-week mid level. NHC was previously covered in a report dated ’28 May 2025’.
(Source: REFINITIV; Analysis by Kalkine Group)
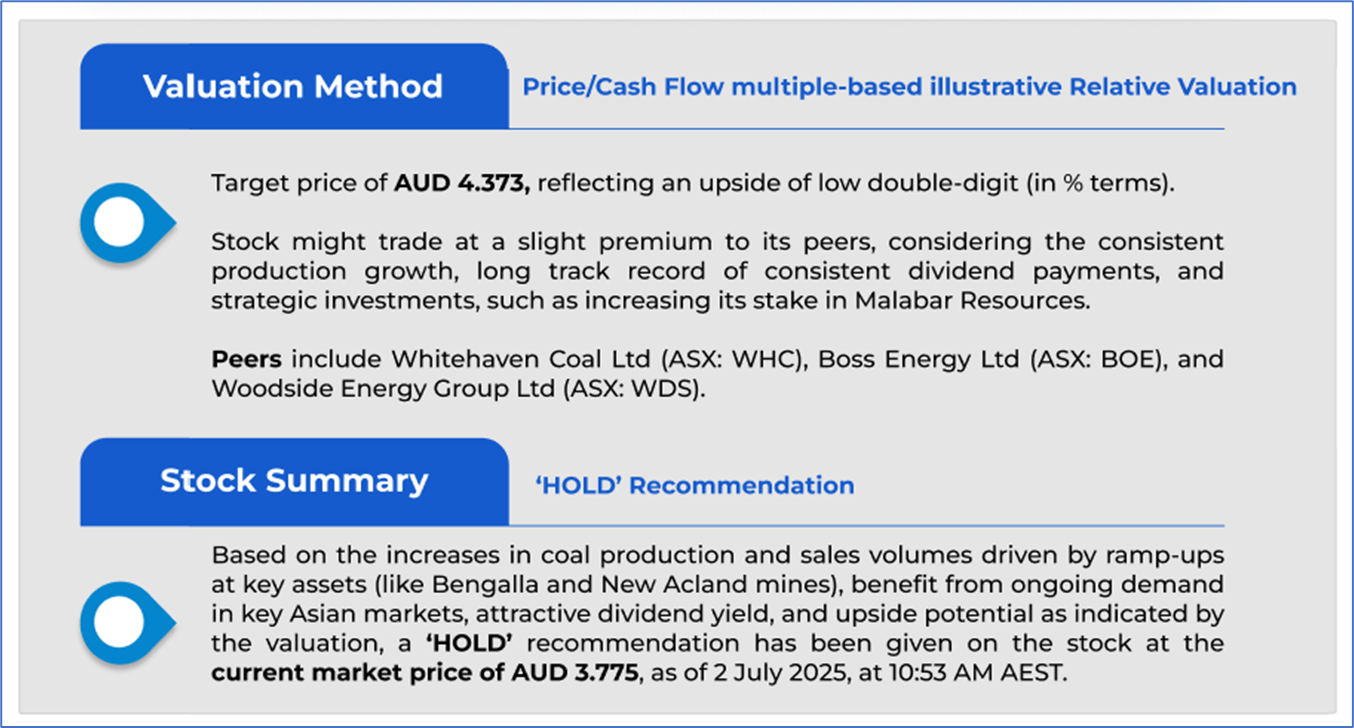
4.2 Fundamental Valuation
Valuation Methodology: Price/Cash Flow Multiple Based Relative Valuation (Illustrative)

Markets are trading in a highly volatile zone currently due to certain macro-economic issues and geopolitical tensions prevailing. Therefore, it is prudent to follow a cautious approach while investing.
Note 1: Past performance is neither an indicator nor a guarantee of future performance.
Note 2: The reference date for all price data, currency, technical indicators, support, and resistance levels is 2 July 2025. The reference data in this report has been partly sourced from REFINITIV.
Note 3: Investment decisions should be made depending on an individual's appetite for upside potential, risks, holding duration, and any previous holdings. An 'Exit' from the stock can be considered if the Target Price mentioned as per the Valuation and or the technical levels provided has been achieved and is subject to the factors discussed above.
Note 4: Dividend Yield may vary as per the stock price movement.
Note 5: Kalkine reports are prepared based on the stock prices captured either from REFINITIV or Trading View. Typically, REFINITIV or Trading View may reflect stock prices with a delay which could be a lag of 25-30 minutes. There can be no assurance that future results or events will be consistent with the information provided in the report. The information is subject to change without any prior notice.
Technical Indicators Defined: -
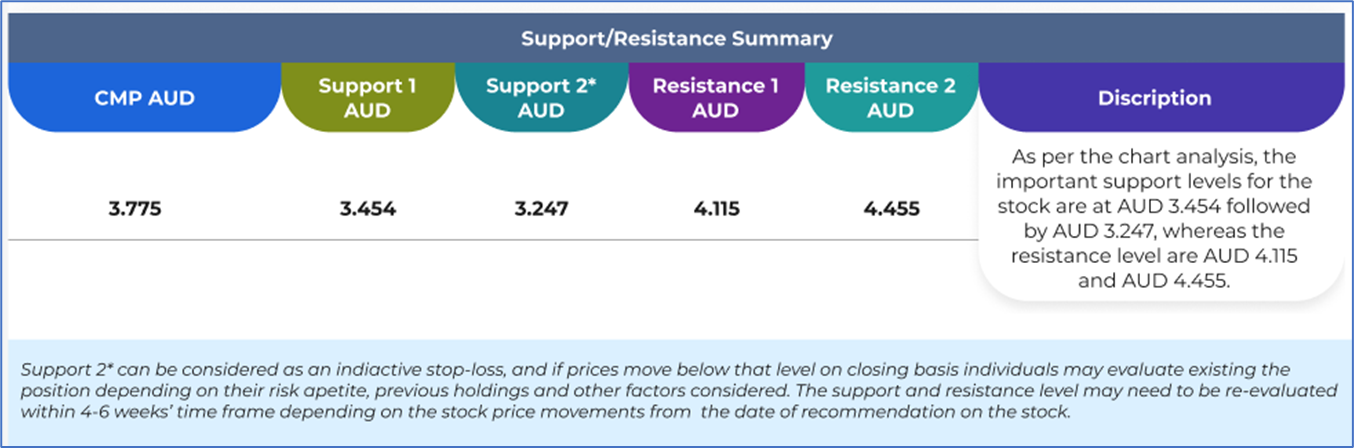
Support: A level at which the stock prices tend to find support if they are falling, and a downtrend may take a pause backed by demand or buying interest. Support 1 refers to the nearby support level for the stock and if the price breaches the level, then Support 2 may act as the crucial support level for the stock.
Resistance: A level at which the stock prices tend to find resistance when they are rising, and an uptrend my take a pause due to profit booking or selling interest. Resistance 1 refers to the nearby resistance level for the stock and if the price surpasses the level, then Resistance 2 may act as the crucial resistance level for the stock.
Stop-loss: It is a level to protect further losses in case of unfavourable movement in the stock prices.
Disclaimer This report has been issued by Kalkine New Zealand Limited (FSP691351) (NZBN:9429047678101) (“Kalkine”). Kalkine is a Financial Advice Provider (“FAP”) and is authorised by a Class 1 Financial Advice Provider Licence issued by Financial Markets Authority (“FMA”) to provide financial advice. Kalkine provides only general financial advice through its research reports following a person becoming a member. The reports contain buy/sell/hold and other recommendations in relation to equity securities, managed funds and other managed investment schemes and other financial advice products. The recommendations and opinions in this report and on Kalkine website do not take into account any of your investment objectives, financial situation or needs. Before you make a decision about whether to acquire a financial product, you should obtain the Product Disclosure Statement from the product issuer. You should consider the appropriateness of advice taking into account your own objectives, financial situation and needs and seek independent financial advice before making any financial decisions. If you act on the advice in the research reports, you may have to pay fees, expenses or other amounts (but not to Kalkine). Further information about the complaints and dispute resolution process, as well as information about Kalkine’s duties are available on Kalkine’s website. Please read our Financial Advice Provider (FAP) disclosure statement and Complaints Handling Guide, which are available on the website.
Past performance is not a reliable indicator of future performance.
 Please wait processing your request...