
This report is an updated version of the report published on 19 May 2025 at 11:29 am AEST.
Amid ongoing global trade tensions that continue to unsettle markets, Kalkine’s Global Tariff Report offers an in-depth evaluation of the key sectors most affected by shifts in tariffs. The report delivers independent, data-driven insights into the risks facing stocks within these trade-sensitive industries, analyzing core fundamentals and valuation metrics. It also provides both macroeconomic and microeconomic perspectives to help investors navigate uncertainty with greater clarity.
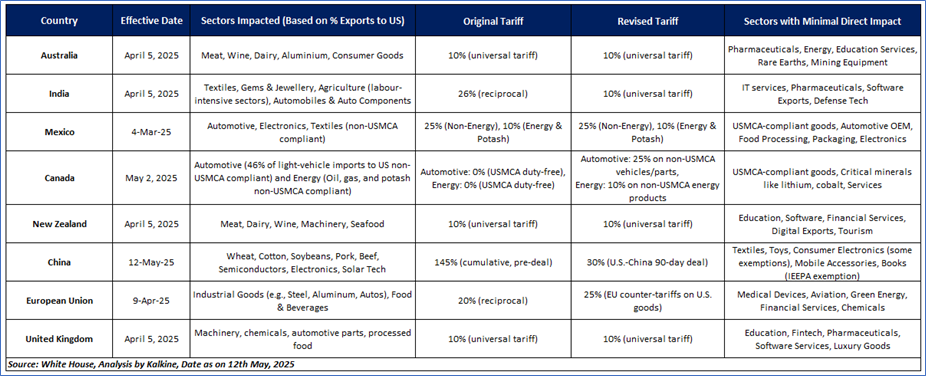
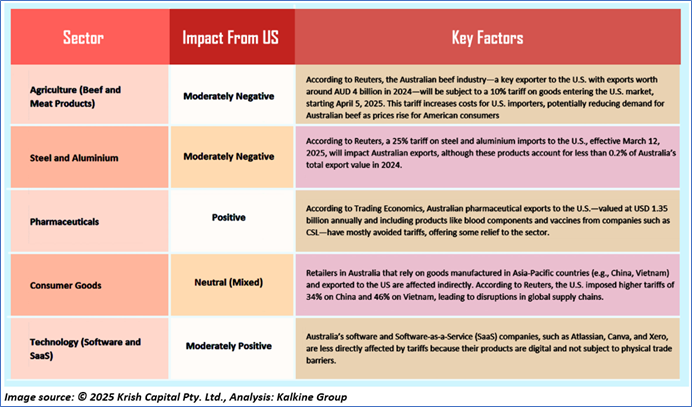
As illustrated in the table below, several key sectors in different countries are directly impacted by the recent tariff announcement from President Trump.
Latest Updates on Global Tariffs by Trump’s Administration
1. 10% Baseline Tariff & Temporary Suspension: A 10% tariff on all imports remains in effect under the IEEPA (effective April 5, 2025), while additional country-specific levies (11%–50%) for 57 nations are suspended from April 9 to July 9, 2025.
2. Sectoral Exemptions: Critical sectors like energy (oil, gas, copper, potash), pharmaceuticals, and electronics are excluded from the baseline tariff, though some face alternative duties (e.g., Section 232 on Canadian crude); a potential 25% tariff on pharma imports remains under review.
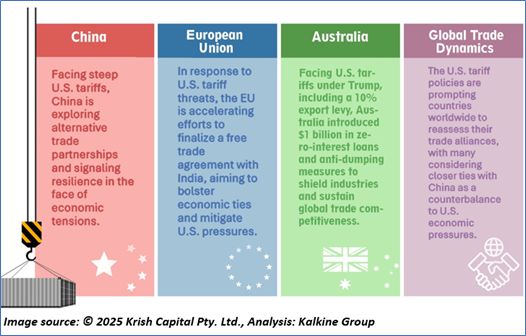
3. S.-China Tariff Adjustment: After a sharp escalation (U.S. tariffs at 145%, China at 125%), both sides agreed to temporarily reduce tariffs to 30% and 10% respectively for 90 days starting May 12, 2025.
4. Canada & Mexico Trade Measures: A 25% tariff remains on non-USMCA vehicles and parts, with Canada imposing reciprocal duties on $107 billion of U.S. goods; energy imports also face a 10% tariff outside USMCA terms.
5. EU Tariff Pause: The EU has paused its planned 20% retaliatory tariffs on U.S. goods until July 9, 2025, pending the outcome of ongoing trade negotiations.
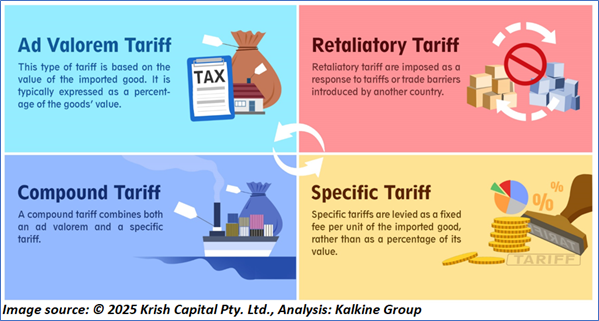
What are the different types of Tariffs?
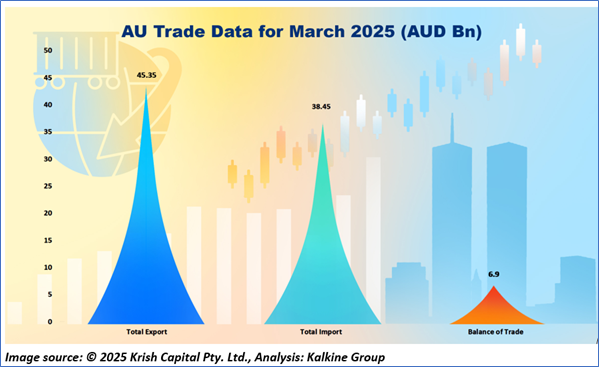
A Snapshot of Australia’s Trade Size
As of March 2025, Australia’s trade performance showed a notable surplus, with the balance of trade rising to AUD 6.9 billion—its highest level since the previous reading of AUD 2.85 billion—driven by exports totaling AUD 45.3 billion. Imports slightly declined to AUD 38.4 billion. Despite this, the current account remained in deficit at AUD 12.5 billion in December 2024, though it showed improvement from the previous AUD 13.9 billion shortfall. The current account deficit stood at -1.8% of GDP. External debt surged to a record AUD 2.65 trillion, while capital flows and foreign direct investment showed robust inflows of AUD 14.2 billion and AUD 81 billion, respectively. The terms of trade held steady at 119 points.
Impact of U.S. Tariffs on Various Australian Sectors
U.S. tariffs directly affect Australia’s beef, wine, steel, aluminium, and manufacturing sectors by raising costs and reducing U.S. market competitiveness. Indirectly, a potential Chinese economic slowdown impacts mining and related industries. Exemptions for pharmaceuticals, combined with Australia’s diverse export markets, help cushion the economic impact. Strategic measures like market diversification, government aid, and dispute resolution are designed to counter these effects and seize new opportunities, especially in Asia and Europe.
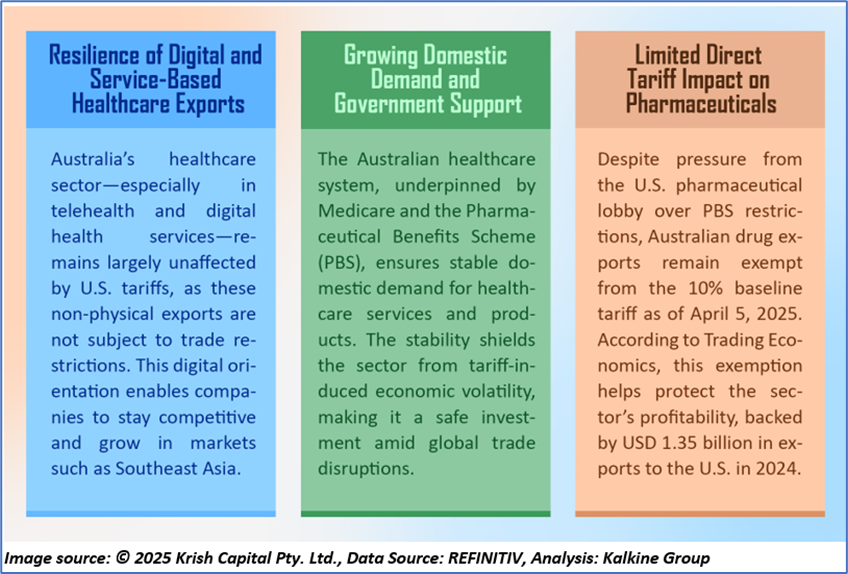
Why does the AU Healthcare Sector look Attractive Amid Tariff Concerns?
Amid U.S. tariff concerns in 2025, Australia’s healthcare sector stands out as a resilient and attractive investment option. Backed by government demand, digital infrastructure, tariff exemptions on pharmaceuticals, and adaptable supply chains, the sector is well-insulated from trade disruptions. Its growth potential in the Asia-Pacific region further enhances its appeal for investors seeking stability in uncertain global conditions.
Amid elevated Market Volatility and Tariff pressures, Nanosonics Limited (ASX: NAN) stands out as a defensive pick within the Healthcare sector, supported by rigorous fundamental and technical research
Kalkine’s Global Tariff Report covers the Investment Highlights, Key Financial Metrics, Risks, Technical Analysis along with the Valuation, Target Price, and Recommendation on the Nanosonics Limited (ASX: NAN).
Section 1: Company Overview and Fundamentals Insights
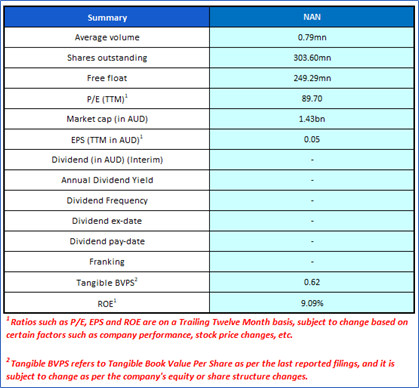
Company Overview: Nanosonics Limited (ASX: NAN) is an Australian infection prevention company engaged in the manufacturing and distribution of trophon® ultrasound probe disinfector and its associated consumables and accessories. The company is focused on the research, development and commercialization of infection control and decontamination products and related technologies. Noted below are the key price indicators for stock. Kalkine’s Global Tariff Report covers the Investment Highlights, Key Financial Metrics, Risks, and Technical Analysis along with the Valuation, Target Price, and Recommendation on the stock.
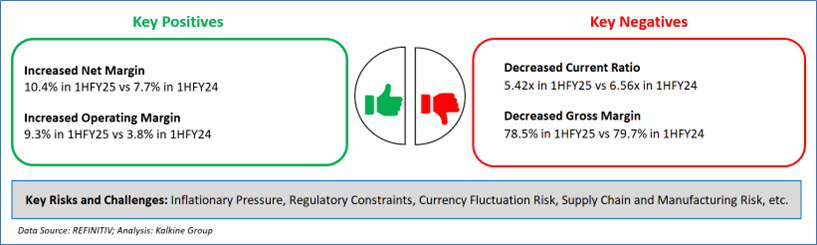
1.2 The Key Positives, Negatives, Investment Highlights, and Risks
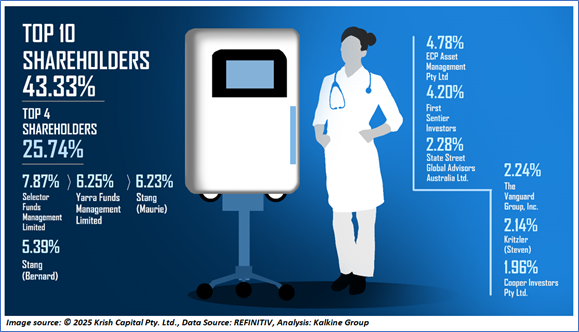
1.3 Top 10 Shareholders:
The top 10 shareholders together form ~43.33% of the total shareholding. Selector Funds Management Limited and Yarra Funds Management Limited hold maximum stakes of 7.87% and 6.25%, respectively.
1.4 Key Metrics: NAN’s return on equity ratio increased to 5.3% in 1HFY25 compared to 3.6% in 1HFY24. Below is captured other metrics:
Section 2: Business Updates, Financial and Operational Highlights
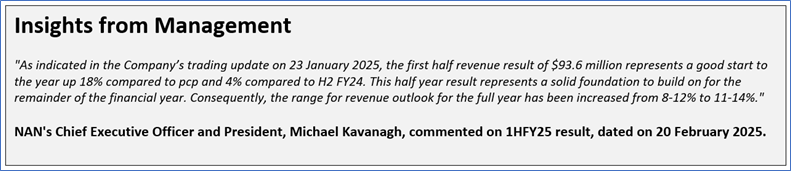
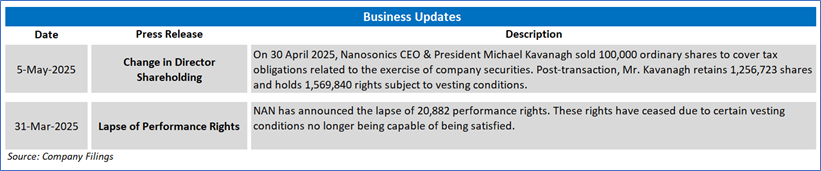
2.1 Recent Business Updates:
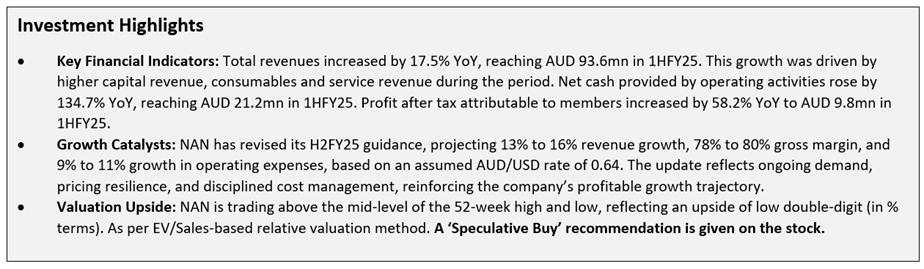
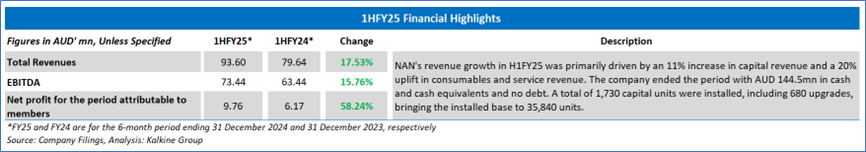
2.2 1HFY25 Results Highlights (for the 6 months ended 31 December 2024): Below mentioned are some key financial highlights:
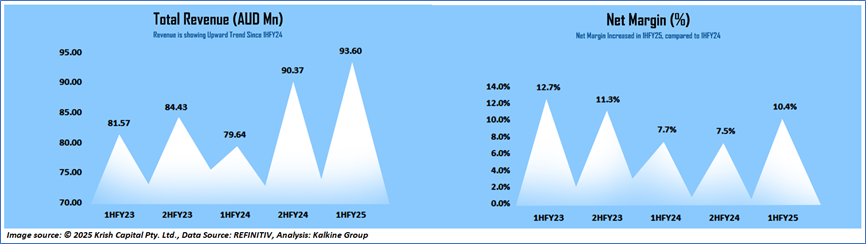
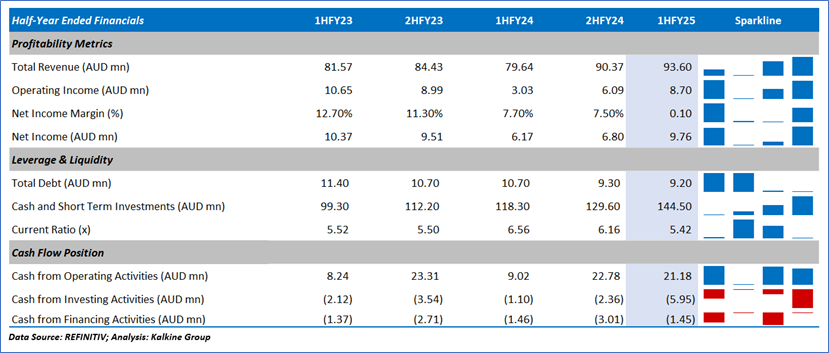
2.3 Historical Financial Trend
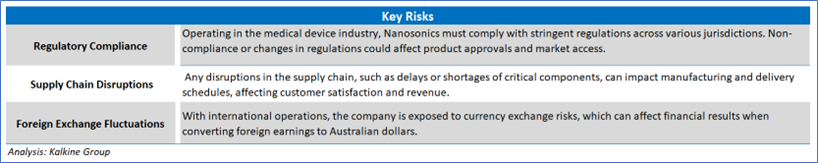
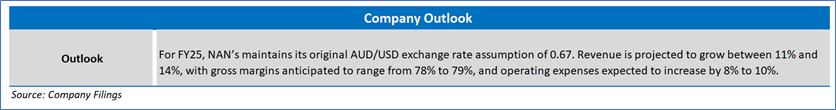
Section 3: Key Risks and Outlook:
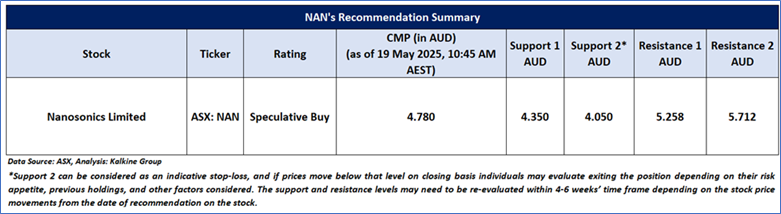
Section 4: Stock Recommendation Summary
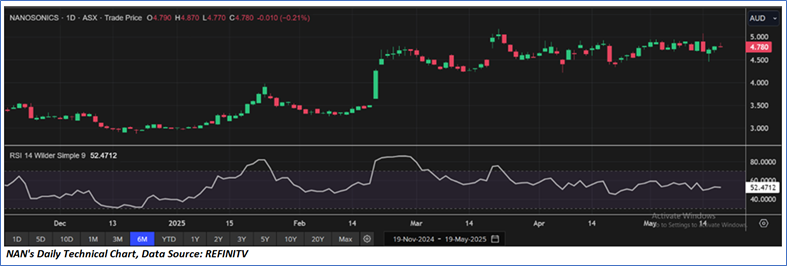
4.1 Price Performance and Technical Summary
The stock has increased by ~39.19% in the last three months, and over the past one year, stock has increased by ~71.28%. The stock has a 52-week low and 52-week high of AUD 2.640 and AUD 5.180, respectively, and is currently trading above the 52-week high-low average. NAN was last covered in a report dated ‘15 July 2024’.
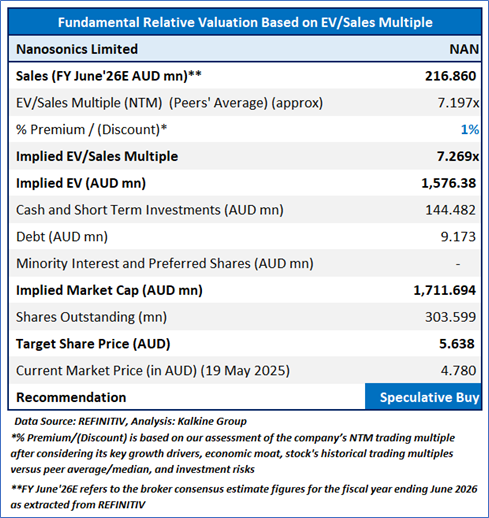
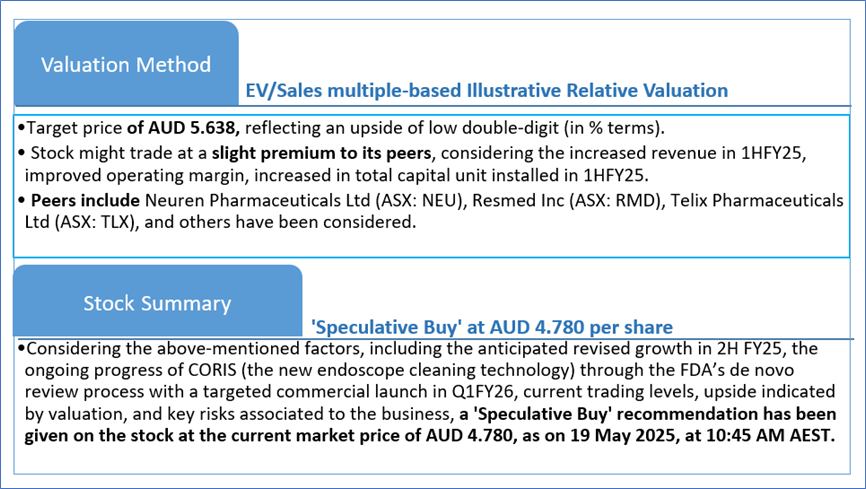
4.2 Fundamental Valuation
Valuation Methodology: EV/Sales Multiple Based Relative Valuation (Illustrative)
Markets are trading in a highly volatile zone currently due to certain macro-economic issues and geopolitical tensions prevailing. Therefore, it is prudent to follow a cautious approach while investing.
Note 1: Past performance is neither an indicator nor a guarantee of future performance.
Note 2: The reference date for all price data, currency, technical indicators, support, and resistance levels is 19 May 2025. The reference data in this report has been partly sourced from REFINITIV.
Note 3: Investment decisions should be made depending on an individual's appetite for upside potential, risks, holding duration, and any previous holdings. An 'Exit' from the stock can be considered if the Target Price mentioned as per the Valuation and or the technical levels provided has been achieved and is subject to the factors discussed above.
Note 4: Kalkine reports are prepared based on the stock prices captured either from REFINITIV or Trading View. Typically, REFINITIV or Trading View may reflect stock prices with a delay which could be a lag of 25-30 minutes. There can be no assurance that future results or events will be consistent with the information provided in the report. The information is subject to change without any prior notice.
Technical Indicators Defined: -
Support: A level at which the stock prices tend to find support if they are falling, and a downtrend may take a pause backed by demand or buying interest. Support 1 refers to the nearby support level for the stock and if the price breaches the level, then Support 2 may act as the crucial support level for the stock.
Resistance: A level at which the stock prices tend to find resistance when they are rising, and an uptrend may take a pause due to profit booking or selling interest. Resistance 1 refers to the nearby resistance level for the stock and if the price surpasses the level, then Resistance 2 may act as the crucial resistance level for the stock.
Stop-loss: It is a level to protect further losses in case of unfavourable movement in the stock prices.
Disclaimer This report has been issued by Kalkine New Zealand Limited (FSP691351) (NZBN:9429047678101) (“Kalkine”). Kalkine is a Financial Advice Provider (“FAP”) and is authorised by a Class 1 Financial Advice Provider Licence issued by Financial Markets Authority (“FMA”) to provide financial advice. Kalkine provides only general financial advice through its research reports following a person becoming a member. The reports contain buy/sell/hold and other recommendations in relation to equity securities, managed funds and other managed investment schemes and other financial advice products. The recommendations and opinions in this report and on Kalkine website do not take into account any of your investment objectives, financial situation or needs. Before you make a decision about whether to acquire a financial product, you should obtain the Product Disclosure Statement from the product issuer. You should consider the appropriateness of advice taking into account your own objectives, financial situation and needs and seek independent financial advice before making any financial decisions. If you act on the advice in the research reports, you may have to pay fees, expenses or other amounts (but not to Kalkine). Further information about the complaints and dispute resolution process, as well as information about Kalkine’s duties are available on Kalkine’s website. Please read our Financial Advice Provider (FAP) disclosure statement and Complaints Handling Guide, which are available on the website.
Past performance is not a reliable indicator of future performance.
 Please wait processing your request...