
Section 1: Company Overview and Fundamentals
1.1 Company Overview:
Meta Platforms, Inc (NASDAQ: META) develops technologies that facilitate social connection, community building, and business growth. Its products allow users to interact and share with friends and family via mobile devices, computers, virtual and mixed reality headsets, and wearable technology. The company operates through two main segments: Family of Apps (FoA) and Reality Labs (RL).
Kalkine’s Low Carbon Research Report covers the Investment Highlights, Low Carbon Emission Initiatives, Key Financial Metrics, Risks, and Technical Analysis along with the Valuation, Target Price, and Recommendation on the stock.
Stock Performance:

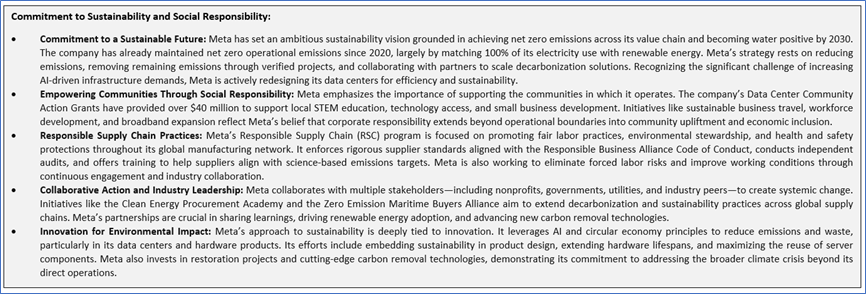
1.2 Why do Low Carbon Emissions matter?
The shift toward a low-carbon economy is one of the most significant challenges of current time, spurred by the urgent need to combat climate change and reduce the environmental impact of corporate activities. This report covers the US-listed low-carbon emission company (NYSE: ATR), that is committed to sustainability and responsible environmental practices.
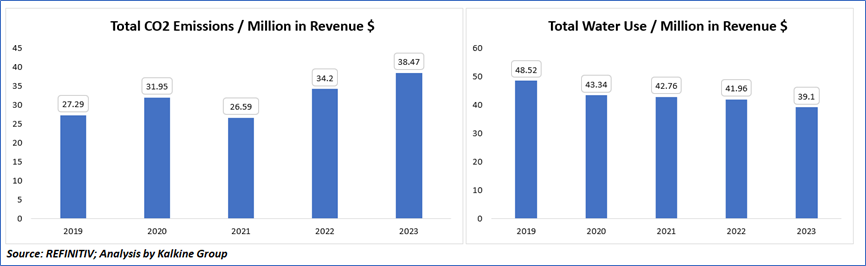
Carbon and Waste Management - Key Metrics
Between 2019 and 2023, Meta's CO₂ emissions per million dollars in revenue increased from 27.29 to 38.47, indicating a rising carbon intensity. In contrast, water use per million in revenue steadily declined from 48.52 to 39.1, reflecting improved water efficiency despite revenue and operational growth.
Peer Comparison: Carbon Emission and Waste Management Metrics

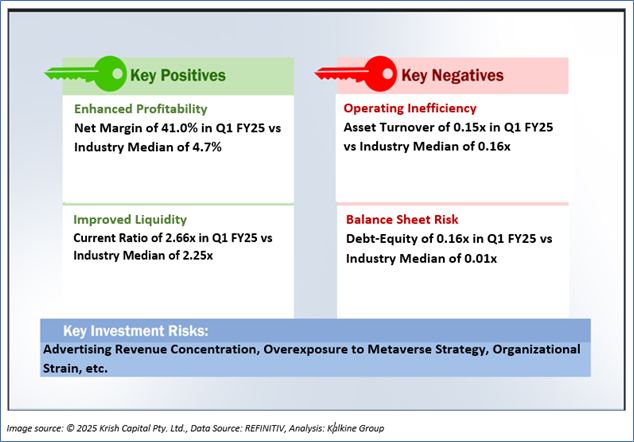
1.2 The Key Positives, Negatives, and Investment summary

1.3 Top 10 shareholders:
The top 10 shareholders together form ~34.40% of the total shareholding, signifying diverse shareholding. The Vanguard Group, Inc. and Fidelity Management & Research Company LLC are the biggest shareholders, holding the maximum stake in the company at 8.72% and 6.05%, respectively.

1.4 Key Metrics
The graph compares Meta's financial performance between Q1 FY25 and Q1 FY24. Margins across key indicators have improved, including EBITDA margin (50.7% vs. 47.8%), operating margin (41.5% vs. 37.9%), and income before tax margin (43.4% vs. 38.9%). Notably, the income tax rate decreased significantly from 12.8% to 5.5%, boosting the net margin from 33.9% to 41.0%. Returns on equity, assets, and invested capital also rose, highlighting enhanced efficiency and profitability. These improvements suggest robust financial health and better resource utilization in Q1 FY25 compared to the previous year.

Section 2: Business Updates and Corporate Business Highlights
2.1 Insights of FY24:

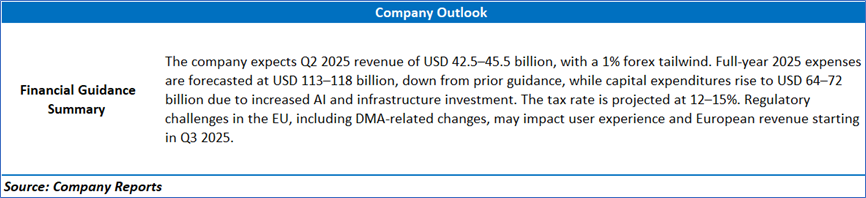
Section 3: Key Risks & Outlook

Section 4: Stock Recommendation Summary:
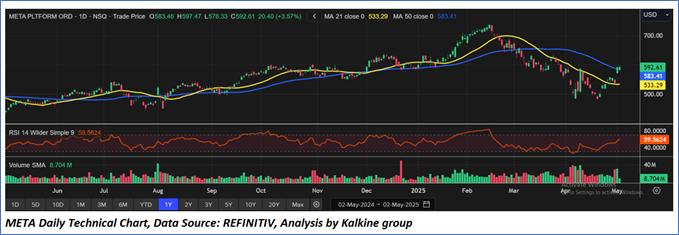
4.1 Price Performance and Technical Summary:
Stock Performance:
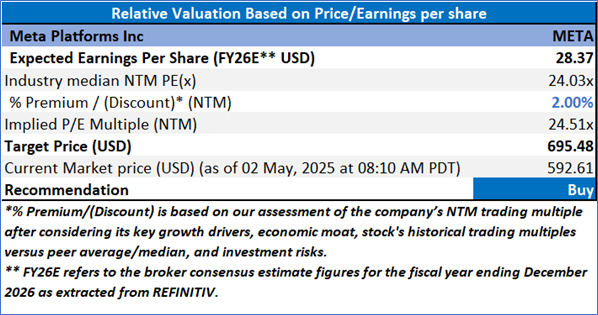
4.2 Fundamental Valuation
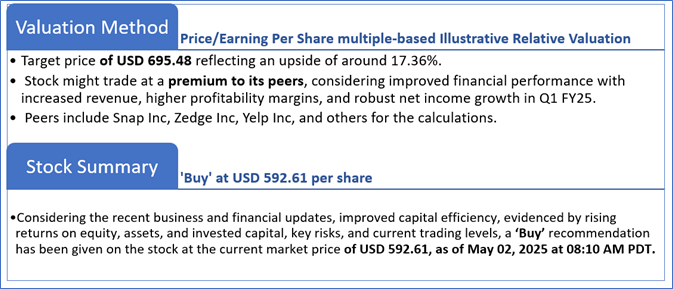
Valuation Methodology: Price/Earnings Per Share Multiple Based Relative Valuation
Markets are trading in a highly volatile zone currently due to certain macroeconomic issues and geopolitical tensions prevailing. Therefore, it is prudent to follow a cautious approach while investing.
Note 1: Past performance is not a reliable indicator of future performance.
Note 2: The reference date for all price data, currency, technical indicators, support, and resistance levels is May 02, 2025. The reference data in this report has been partly sourced from REFINITIV.
Note 3: Investment decisions should be made depending on an individual's appetite for upside potential, risks, holding duration, and any previous holdings. An 'Exit' from the stock can be considered if the Target Price mentioned as per the Valuation and or the technical levels provided has been achieved and is subject to the factors discussed above.
Note 4: The report publishing date is as per the Pacific Time Zone.
Technical Indicators Defined: -
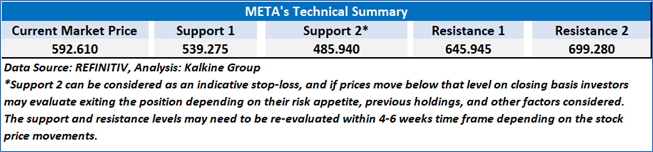
Support: A level at which the stock prices tend to find support if they are falling, and a downtrend may take a pause backed by demand or buying interest. Support 1 refers to the nearby support level for the stock and if the price breaches the level, then Support 2 may act as the crucial support level for the stock.
Resistance: A level at which the stock prices tend to find resistance when they are rising, and an uptrend may take a pause due to profit booking or selling interest. Resistance 1 refers to the nearby resistance level for the stock and if the price surpasses the level, then Resistance 2 may act as the crucial resistance level for the stock.
Stop-loss: It is a level to protect against further losses in case of unfavorable movement in the stock prices.
Disclaimer This report has been issued by Kalkine New Zealand Limited (FSP691351) (NZBN:9429047678101) (“Kalkine”). Kalkine is a Financial Advice Provider (“FAP”) and is authorised by a Class 1 Financial Advice Provider Licence issued by Financial Markets Authority (“FMA”) to provide financial advice. Kalkine provides only general financial advice through its research reports following a person becoming a member. The reports contain buy/sell/hold and other recommendations in relation to equity securities, managed funds and other managed investment schemes and other financial advice products. The recommendations and opinions in this report and on Kalkine website do not take into account any of your investment objectives, financial situation or needs. Before you make a decision about whether to acquire a financial product, you should obtain the Product Disclosure Statement from the product issuer. You should consider the appropriateness of advice taking into account your own objectives, financial situation and needs and seek independent financial advice before making any financial decisions. If you act on the advice in the research reports, you may have to pay fees, expenses or other amounts (but not to Kalkine). Further information about the complaints and dispute resolution process, as well as information about Kalkine’s duties are available on Kalkine’s website. Please read our Financial Advice Provider (FAP) disclosure statement and Complaints Handling Guide, which are available on the website.
Past performance is not a reliable indicator of future performance.
 Please wait processing your request...