
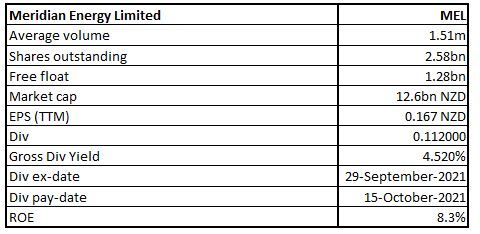
MEL Details
Company Overview: Meridian Energy Limited (NZX: MEL) is engaged in the business of generation, trading as well as retailing of electricity, and the sale of complementary products and services. It is a NZ power company that generates electricity with the help of 100% renewable sources – wind, water as well as sun.
Meridian Energy Limited is New Zealand's largest electricity company. Notably, the Government retains 51% ownership of Meridian.
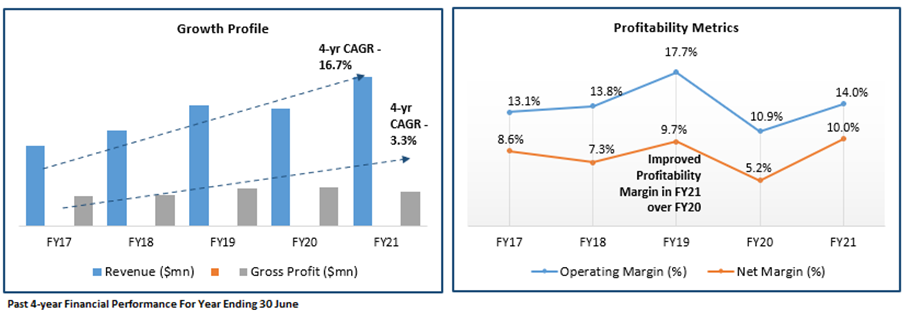
Looking at the past performance over FY17 to FY21, topline and bottomline of the company grew with a compounded annual growth rate (CAGR) of 16.65% and 20.95%, respectively. Total revenue of the company improved from $2,320.0 million in FY17 to $4,296.0 million in FY21. Net Income of the company improved from $200.0 million in FY17 to $428.0 million in FY21.
Exhibit 1: Operating Performance
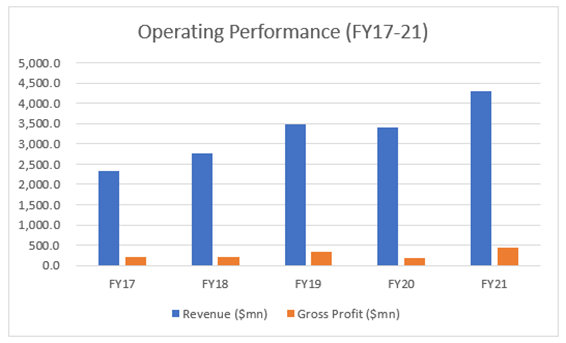
Source: Company Reports, Analysis by Kalkine Group
Results Performance (FY21 ended 30 June 2021)
Exhibit 2: Income Statement
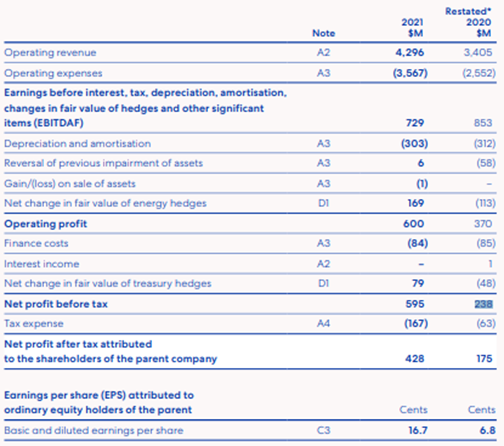
Key Data (Source: Company Reports)
Operational Performance for September 2021:
National Hydro Storage: National hydro storage, from the start of September month till the date of 12 October 2021, increased from 126% to 134% of historical average. North Island storage increased to 115% of average and South Island storage increased to 140% of average by 12 October 2021. Total monthly inflows were 171% of historical average.
National electricity demands down 1.7% YoY: As per market data, national electricity demand in September 2021 was 1.7% lower than the same month last year. This was due to more stringent lockdowns in the month as compared to previous corresponding period.
Exhibit 3: Key Operational Data
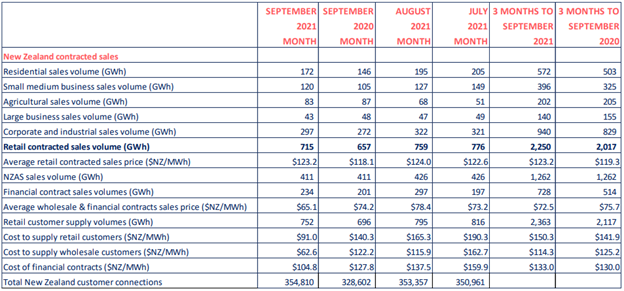
Key Data for New Zealand Market (Source: Company Reports)
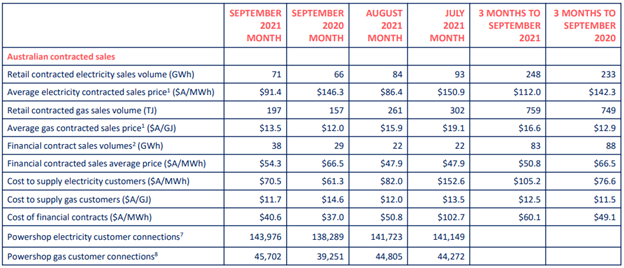
Key Data for Australian Market (Source: Company Reports)
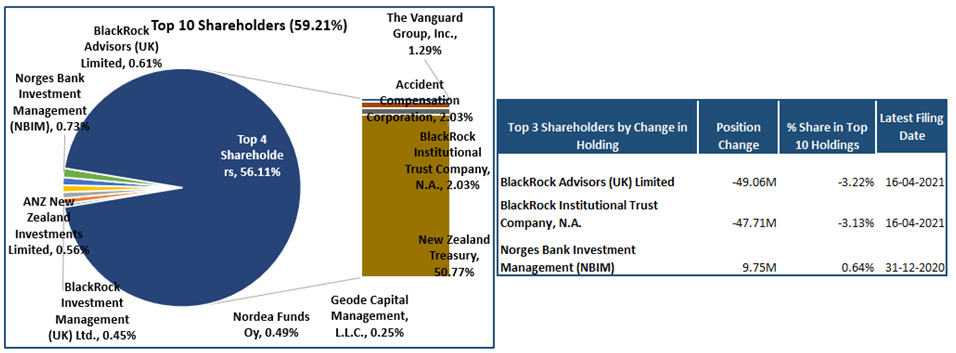
Top 10 Shareholders: The top 10 shareholders have been highlighted in the table, which together forms around 59.21% of the total shareholding. New Zealand Treasury and BlackRock Institutional Trust Company, N.A. are holding maximum stake in the company at 50.77% and 2.03%, respectively, as provided in the table below:
Exhibit 4: Top 10 Shareholders
A Quick Look at Key Metrics: The company’s operating margin and net margin for FY21 stood at 14.0% and 10.0%, better than the FY20 result of 10.9% and 5.2%, respectively, implying improvement in the operational efficiency of the company. Its ROE for FY21 stood at 8.3%, better than the FY20 result of 3.3%.
Exhibit 5: Key Metrics
Recent Update:
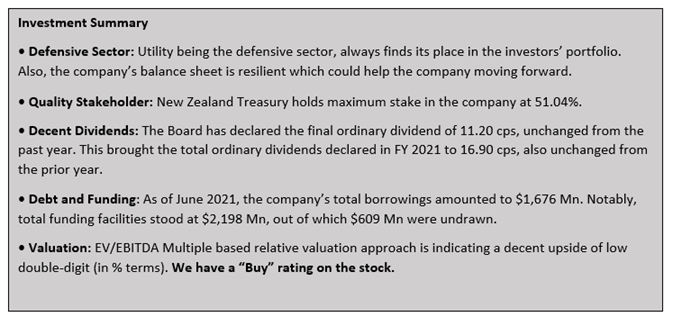
Outlook:
The company’s balance sheet is resilient. On the first day of the new 2022 financial year, S&P Global Ratings reaffirmed MEL’s corporate credit rating as BBB+/Stable/A-2. In New Zealand, Powershop won the Canstar and Consumer New Zealand awards for customer satisfaction and trust, and over in Australia Powershop was recognised once again by Canstar Blue, Finder and Roy Morgan for customer satisfaction.
Key Risks:
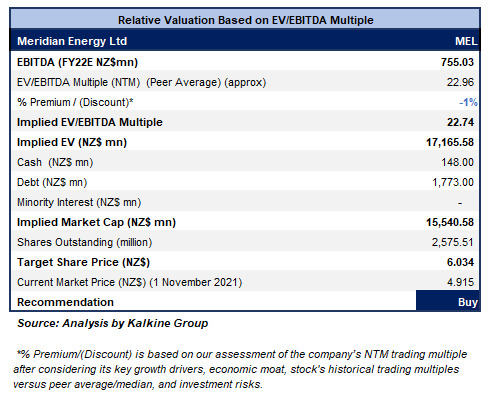
Valuation Methodology: EV/EBITDA Multiple Based Relative Valuation (Illustrative)
Technical Overview:
Chart:
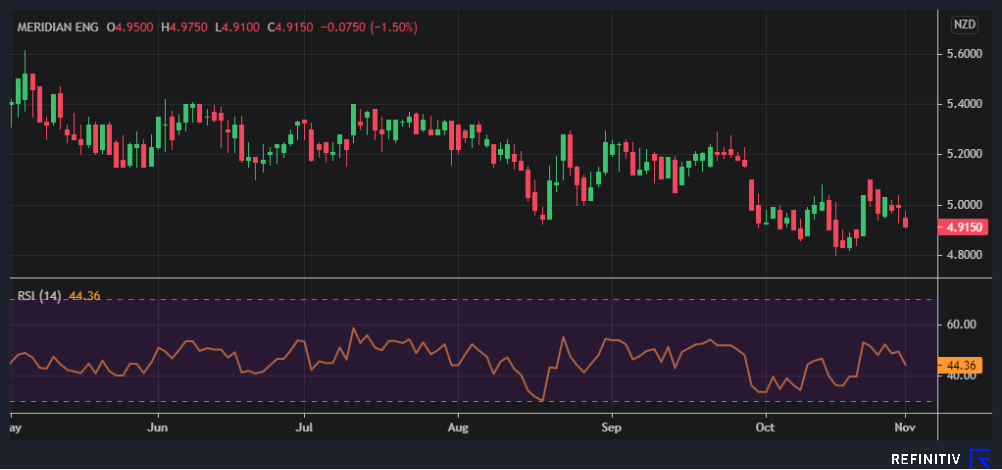
Source: REFINITIV
Note: Orange Color Line Reflects RSI (14-Period)
.png)
Stock Recommendation:
The stock has been valued using EV/EBITDA multiple based illustrative relative valuation method and the target price reflects that there might be a rise of low double-digit (in percentage terms). A discount has been applied to EV/EBITDA Multiple (NTM) (Peer Average) considering higher operating expenses in FY 2021 on the YoY basis. However, the company is possessing robust balance sheet which could help it moving forward.
Hence, we give a “Buy” recommendation on the stock at the current market price of $4.915 per share (New Zealand Time: 4:25 PM (GMT +12)) on 1st November 2021.
Note 1: The reference data in this report has been partly sourced from REFINITIV.
Note 2: Investment decisions should be made depending on the investors’ appetite on upside potential, risks, holding duration, and any previous holdings. Investors can consider exiting from the stock if the Target Price mentioned as per the analysis has been achieved and subject to the factors discussed above alongside support levels provided.
Technical Indicators Defined:-
Support: A level where-in the stock prices tend to find support if they are falling, and downtrend may take a pause backed by demand or buying interest.
Resistance: A level where-in the stock prices tend to find resistance when they are rising, and uptrend may take a pause due to profit booking or selling interest.
Stop-loss: It is a level to protect further losses in case of unfavourable movement in the stock prices.
Disclaimer
Kalkine New Zealand Limited is authorised to provide general advice only. The information on this website does not take into account any of your investment objectives, financial situation or needs. Before you make a decision about whether to acquire a financial product, you should obtain the Product Disclosure Statement from the product issuer. You should consider the appropriateness of advice taking into account your own objectives, financial situation and needs and seek independent financial advice before making any financial decisions.
Past performance is not a reliable indicator of future performance.
 Please wait processing your request...