
Company Overview: Mercury NZ Limited (NZX: MCY) (formerly known as Mighty River Power Limited), is engaged in the energy retail business. The company is in 100 percent renewable energy and aims at becoming a leading brand with a sustainable future. The company’s retail operations cater to residential, commercial (small and medium sized businesses), industrial as well as spot market customers.
MCY Details
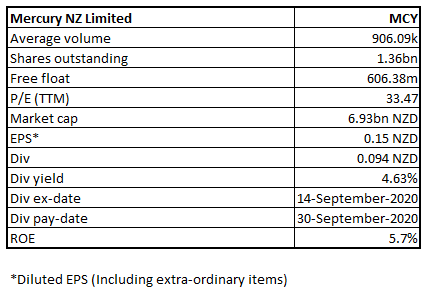
Important Utility Company in NZ: Mercury NZ Limited (NZX: MCY) is into the generation of electricity from renewable sources. It also sells electricity to customers under retail brands – Mercury, Globug and Bosco. The company has a market capitalization of ~$6.93 billion as on September 28, 2020.
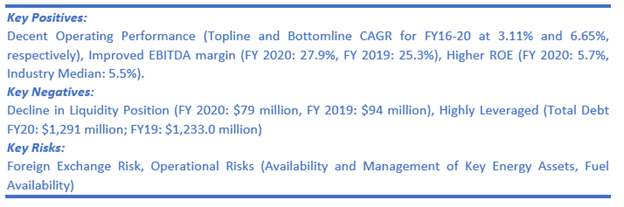
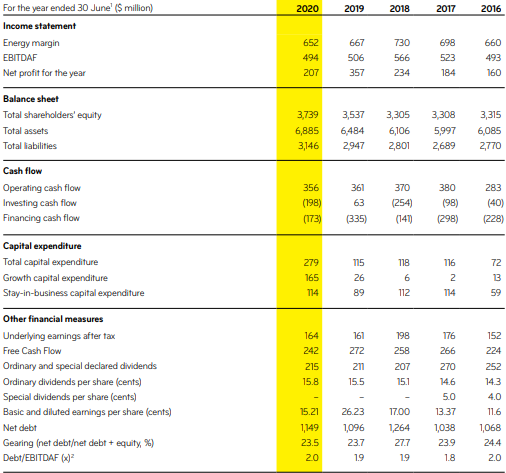
Looking at the past performance over FY16 to FY20, the top line and bottom line of the company grew at a compounded annual growth rate (CAGR) of 3.11% and 6.65%, respectively. The total revenue improved from $1,564.0 million in FY16 to $1,768.0 million in FY20 and its bottom line improved from $160.0 million in FY16 to $207.0 million in FY20.
Results Performance (Year Ended 30th June 2020)
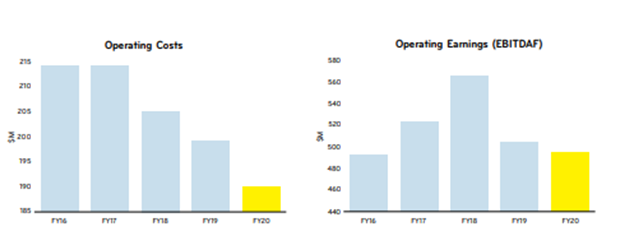
As per FY20 results, the revenue from continuing operations for the period stood at $1.77 billion, a decline of 11.6% (y-o-y). Net profit/(loss) from continuing operations for the period stood at $207 million, a decline of 42% (y-o-y). The company’s segments include Generation/Wholesale, Retail and Other segments. EBITDAF under Generation/Wholesale stood at $486 million and $8 million for Retail.
Key Data (Source: Company Reports)
During the year, the company incurred capital expenditure in relation to the construction of the Turitea wind farm, with $184 million advanced till date. MCY's gearing level stood at 2.0 times debt/ EBITDAF, which was marginally up from the previous year. The gearing ratio, however, remains under the company’s target credit range of 2.0x to 3.0x debt/EBITDAF to support S&P Global credit rating of BBB+.
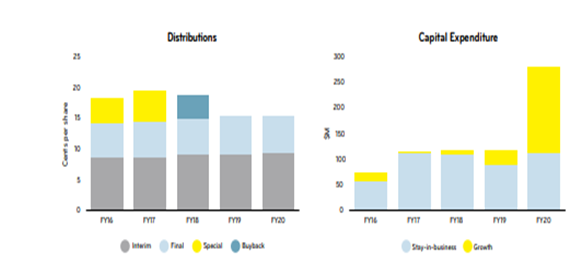
Distributions and Capital Expenditure (Source: Company Reports)
The company has available debt headroom of $525 million and cash & equivalents of $79 million, and holds 39 million shares as treasury stock, providing balance sheet flexibility in relation to the development of the Turitea wind farm and other potential opportunities.
Under its dividend policy, the company has declared a fully imputed ordinary dividend of 9.4 cents per share (CPS) of final dividend, by targeting a payout ratio of 70% to 85% of Free Cash Flow on average over time.
Key Data (Source: Company Reports)
Top 10 Shareholders: The top 10 shareholders have been highlighted in the table, which together forms around 58.59% of the total shareholding. New Zealand Treasury and Accident Compensation Corporation are holding maximum stake in the company at 52.57% and 1.93%, respectively, as provided in the table below:
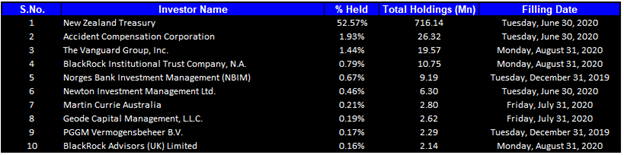
Top 10 Shareholders (Source: Refinitiv (Thomson Reuters))
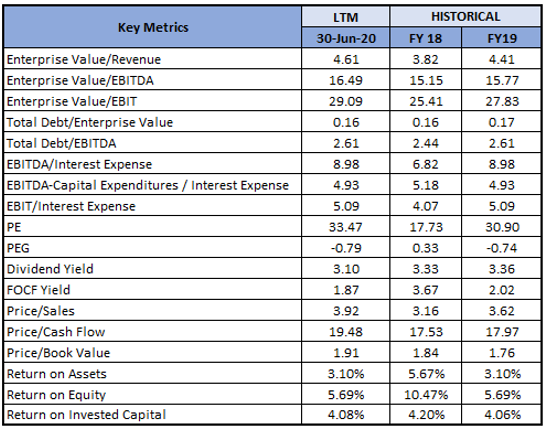
A Quick Look at Key Metrics: The company’s current ratio for FY20 stood at 0.54x, better than the previous year result of 0.52x. Its Debt to Equity ratio for FY20 stood at 0.35x, lower than the industry median of 0.51x, depicting a reasonable leverage position of the company. EBITDA margin for FY20 stood at 27.9%, better than the FY19 result of 25.3%. ROE for FY20 stood at 5.7%, as compared to the industry median of 5.5%, implying that the company generated better returns for its shareholders than its peer group.
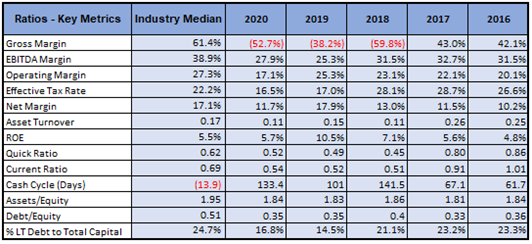
Key Metrics (Source: Refinitiv (Thomson Reuters))
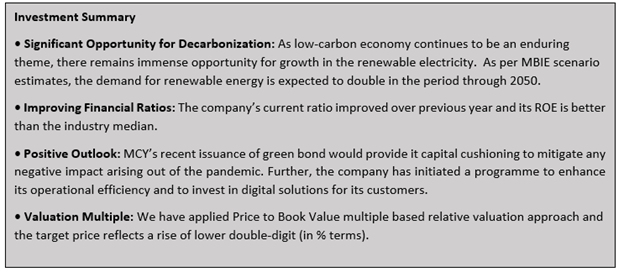
Company Outlook: MCY’s recent issuance of the green bond would provide capital cushioning to mitigate any negative impact arising out of the pandemic. The company stated that growth would be delivered by bringing generation to grid from Turitea wind farm. Notably, 33 northern turbines are expected to be completed in the final quarter of FY21, while completion of 27 southern turbines has been anticipated in Q2 FY 2022. The company has recently revised its FY21 EBITDAF guidance from $515 million to $505 million.
Key Valuation Metrics (Source: Refinitiv (Thomson Reuters))
Valuation Methodology: Price to Book Value Multiple Based Relative Valuation (Illustrative)
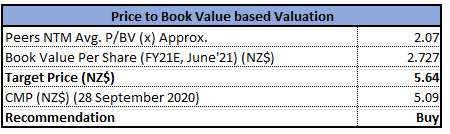
Price to Book Value Multiple Based Relative Valuation (Source: Refinitiv (Thomson Reuters))
Note: All forecasted figures and peers have been taken from Thomson Reuters, NTM-Next Twelve Months
Technical Overview:
Weekly Chart –
Source: Refinitiv (Thomson Reuters)
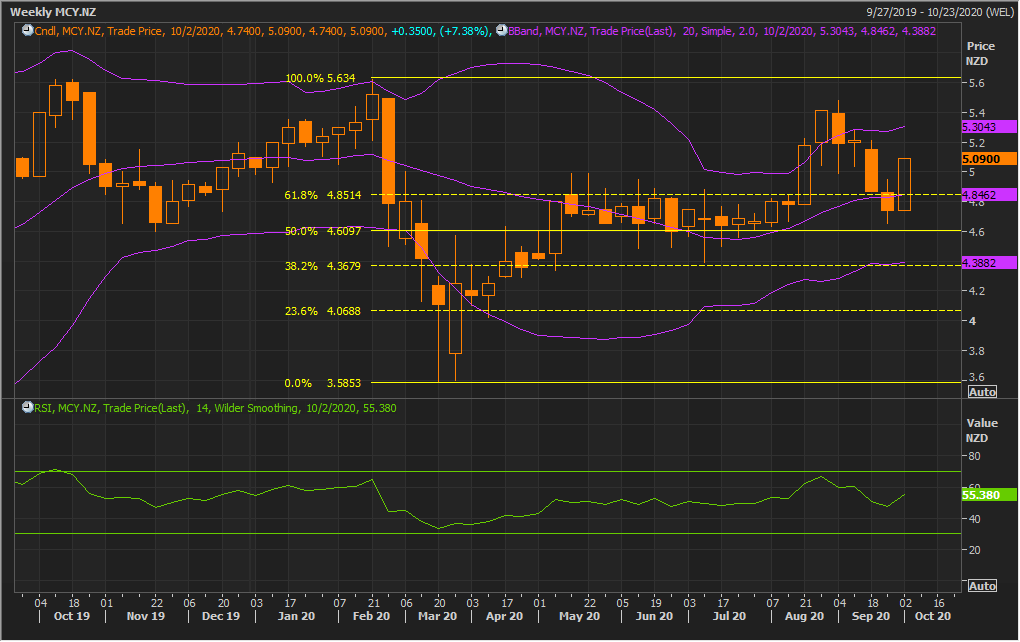
Note: Purple colour lines are Bollinger Bands with the upper band suggesting overbought status while the lower band oversold status, and yellow lines are Fibonacci retracement lines which measure price rebound and backtrack.
On the first trading day of the ongoing week, the stock opened around the previous week closing price of $4.74, made the high of $5.09, and gave closing at the same level thereby demonstrating strength positive sentiment on the stock. The technical indicator RSI with 55 reading and curve at the end pointing up, suggests strong bullish momentum for the stock.
Going forward, the stock may have resistance around the previous high of $5.50 whereas support could be around the 50% retracement level of $4.60.
Stock Recommendation: The company’s underlying earnings after tax for the financial year 2020 increased by $3 million, as a result of MCY’s focus on careful portfolio management, customer value as well as a disciplined approach to cost.
Considering the aforesaid facts, recent updates and FY20 results, we have valued the stock using Price to Book Value Multiple Based Relative Valuation (on an illustrative basis), and we have arrived at a target price of lower double-digit growth (in % terms).
Hence, we give a “Buy” recommendation on the stock at the current market price of NZ$5.09 per share, up by 7.38% on September 28, 2020.
.png)
MCY Daily Technical Chart (Source: Refinitiv (Thomson Reuters))
Disclaimer
Kalkine New Zealand Limited is authorised to provide class advice only. The information on this site does not take into account any of your investment objectives, financial situation or needs. Before you make a decision about whether to acquire a financial product, you should obtain the Product Disclosure Statement from the product issuer. You should consider the appropriateness of advice taking into account your own objectives, financial situation and needs and seek independent financial advice before making any financial decisions.
Past performance is not a reliable indicator of future performance.
 Please wait processing your request...