
This report is an updated version of the report published on 2 July 2024 at 2:52 pm AEST.
Section 1: Company Overview and Fundamentals Insights
Megaport Limited (ASX: MP1) is a Network as a Service (NaaS) solutions provider. Its global software defined network (SDN) helps businesses connect their network to services through an easy-to-use portal or its open application programming interface (API). It offers agile networking capabilities. Kalkine’s Growth Report covers the Investment Highlights, Management Insights, Key Financial Metrics, Risks, Technical Analysis along with the Valuation, Target Price, and Recommendation on the stock.
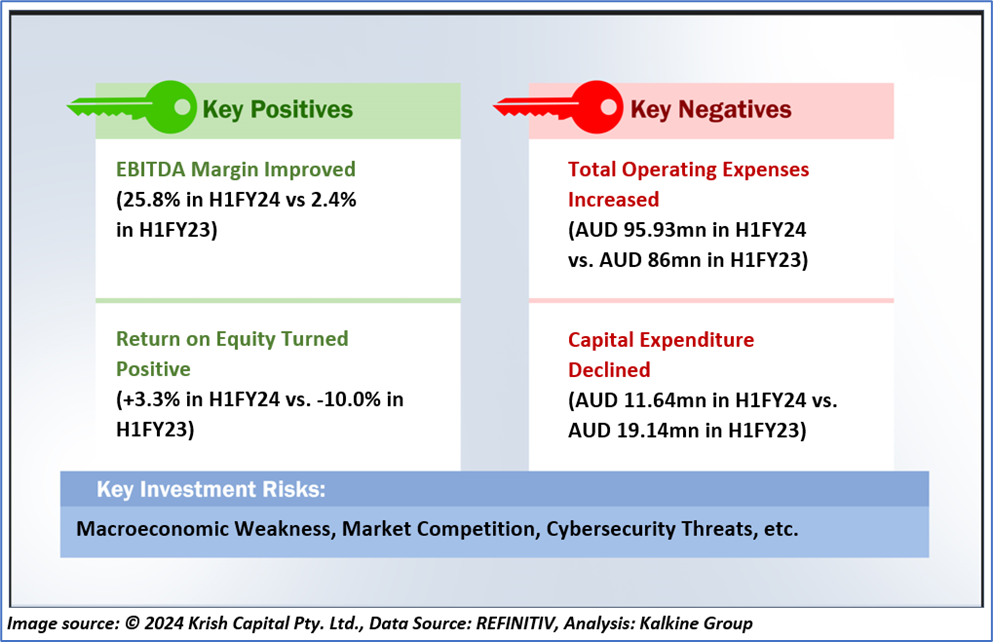
1.2 The Key Positives, Negatives, Investment Highlights, and Risks

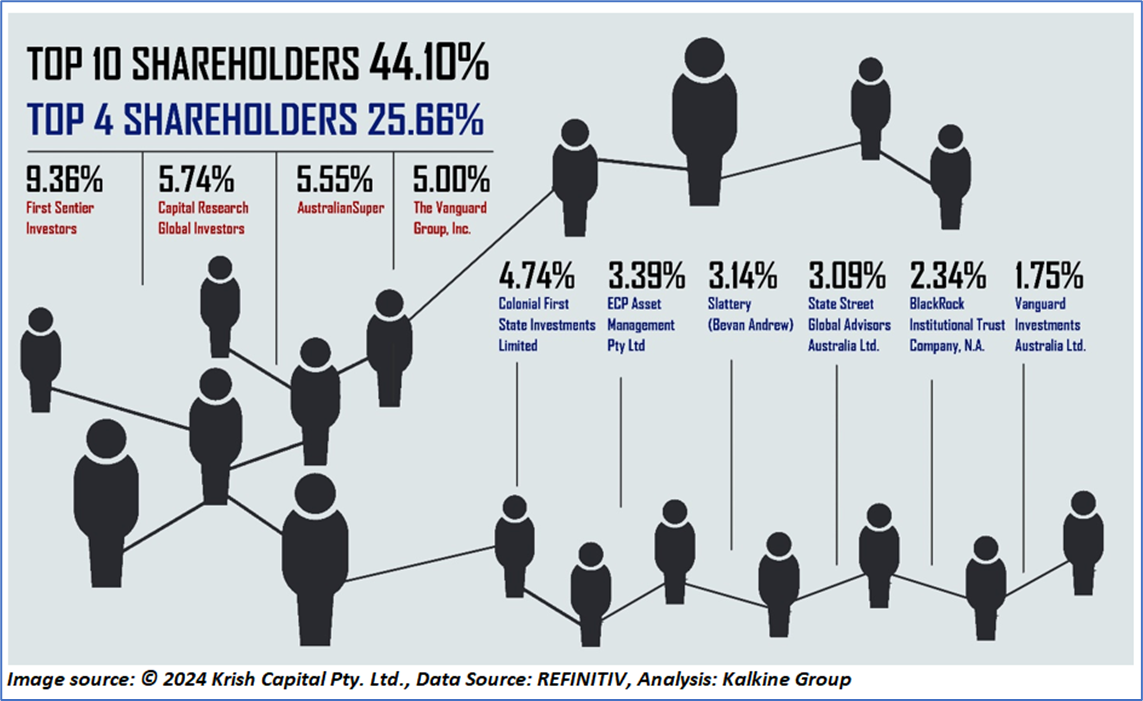
1.3 Top 10 Shareholders:
The top 10 shareholders together form ~44.10% of the total shareholding. First Sentier Investors, Capital Research Global Investors hold maximum stakes in the company at ~9.36% and ~5.74%, respectively.
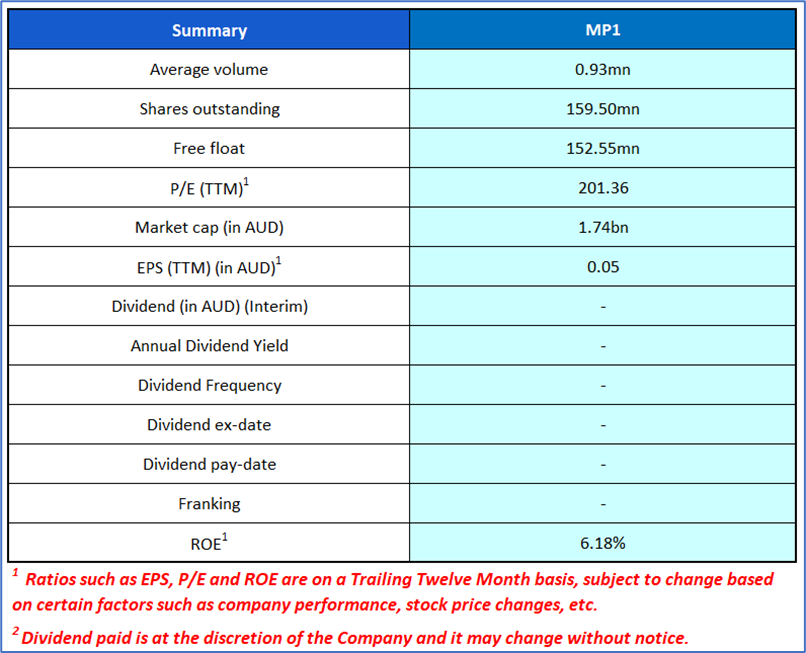
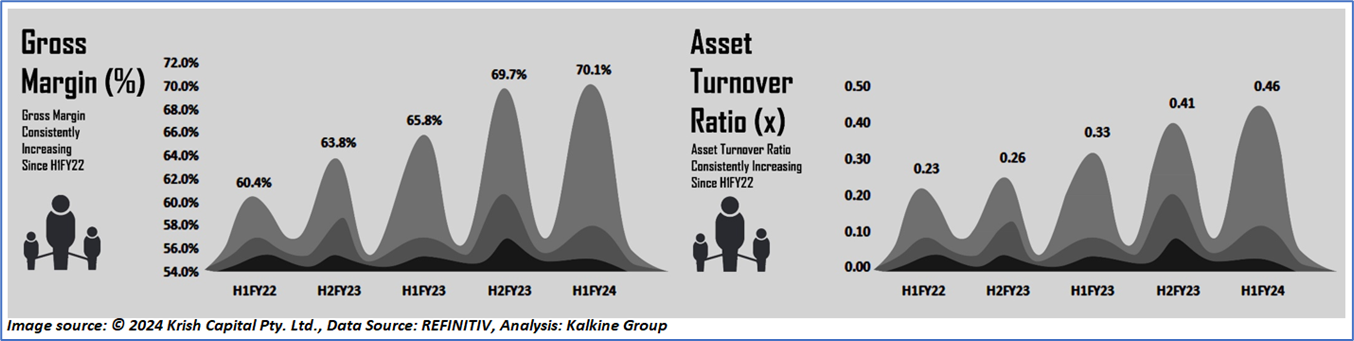
1.4 Key Metrics: In H1FY24, MP1's EBITDA margin improved to 25.8% from 2.4% in H1FY23. Below is captured other metrics:
Section 2: Business Updates, Financial and Operational Highlights
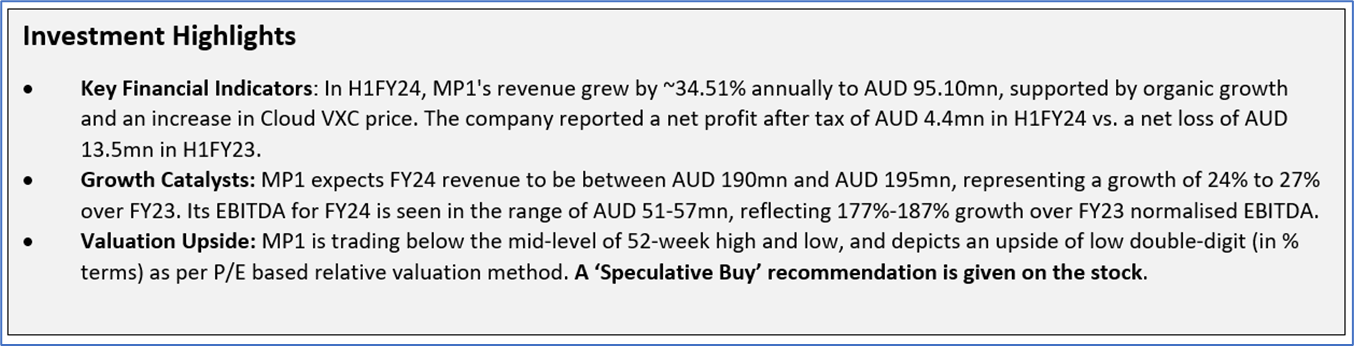
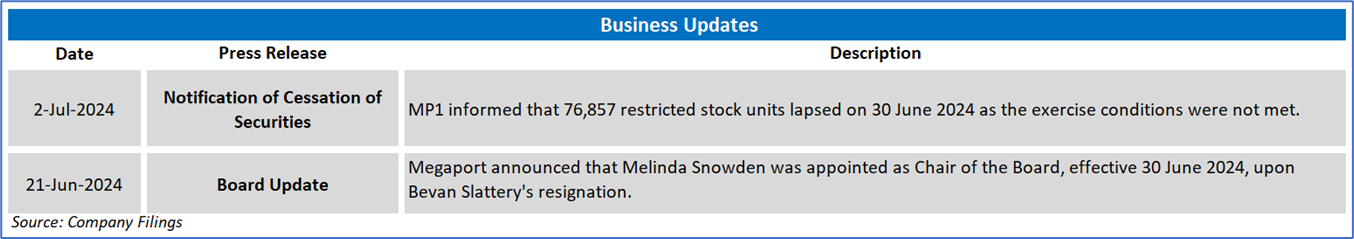
2.1 Recent Business Updates:
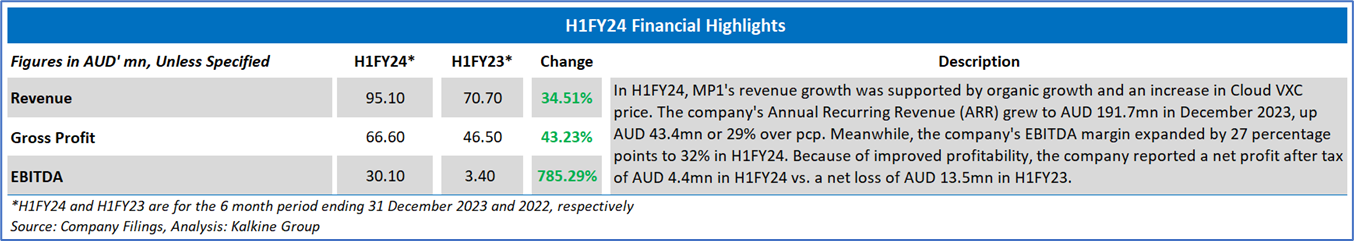
2.2 H1FY24 Results Highlights (for the period ended 31 December 2023): Below mentioned are some key financial highlights:
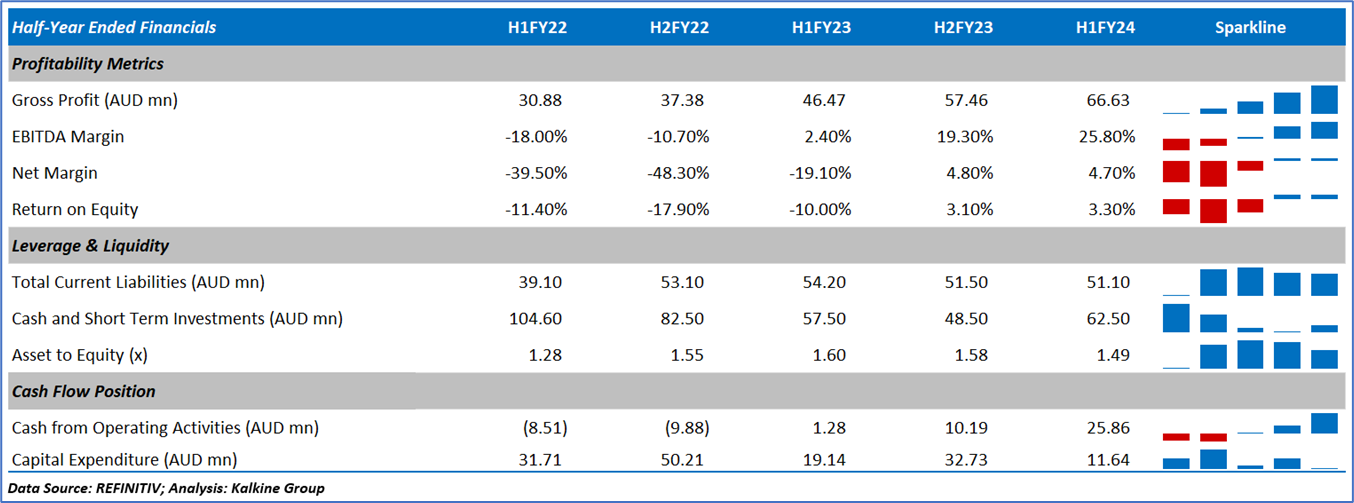
2.3 Historical Financial Trend
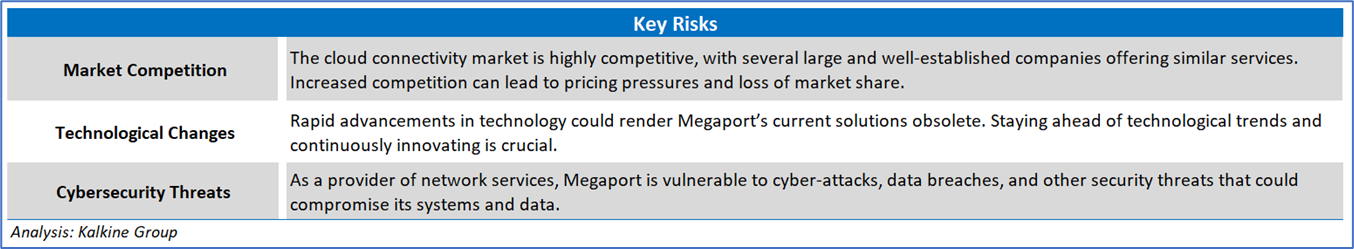
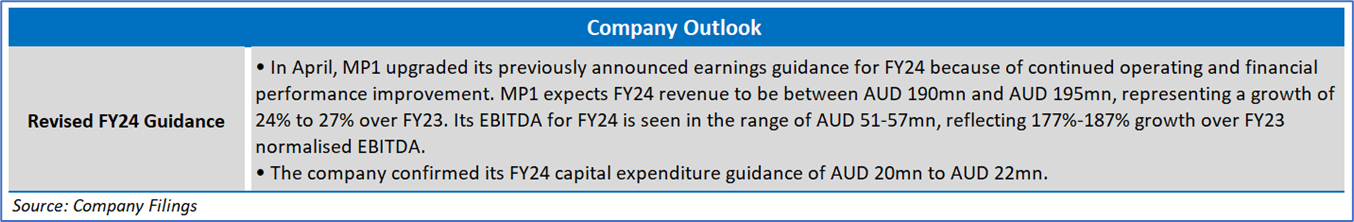
Section 3: Key Risks and Outlook:
Section 4: Stock Recommendation Summary
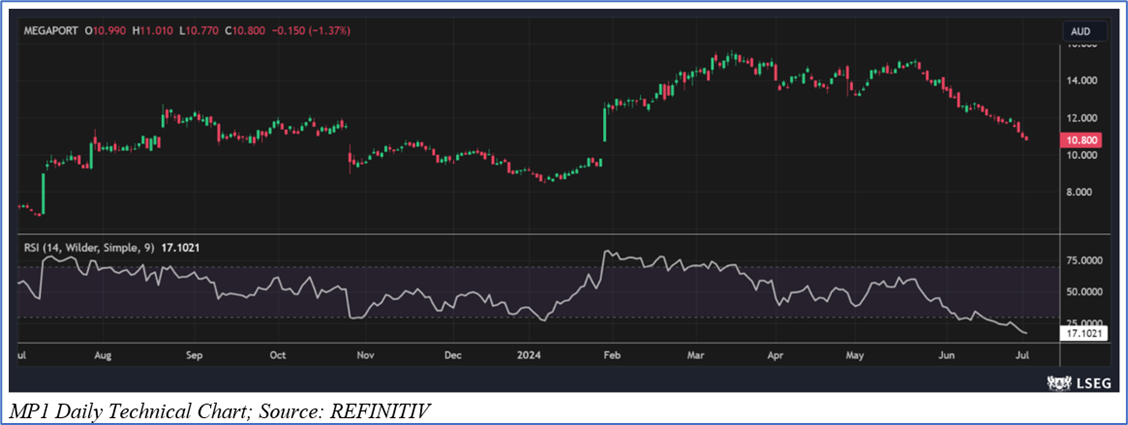
4.1 Price Performance and Technical Summary
The stock has declined by ~19.40% in the last one month, whereas over the last three months, the stock has corrected by ~21.98%. The stock has a 52-week low and 52-week high of AUD 6.710 and AUD 15.650, respectively, and is currently trading below the mid-point of its 52-week low and high. MP1 was last covered in a report dated ‘19 July 2023’.
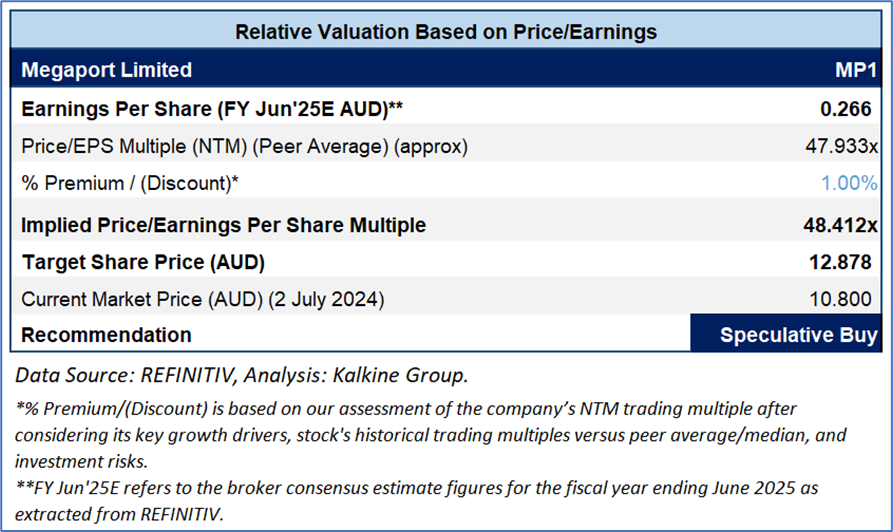
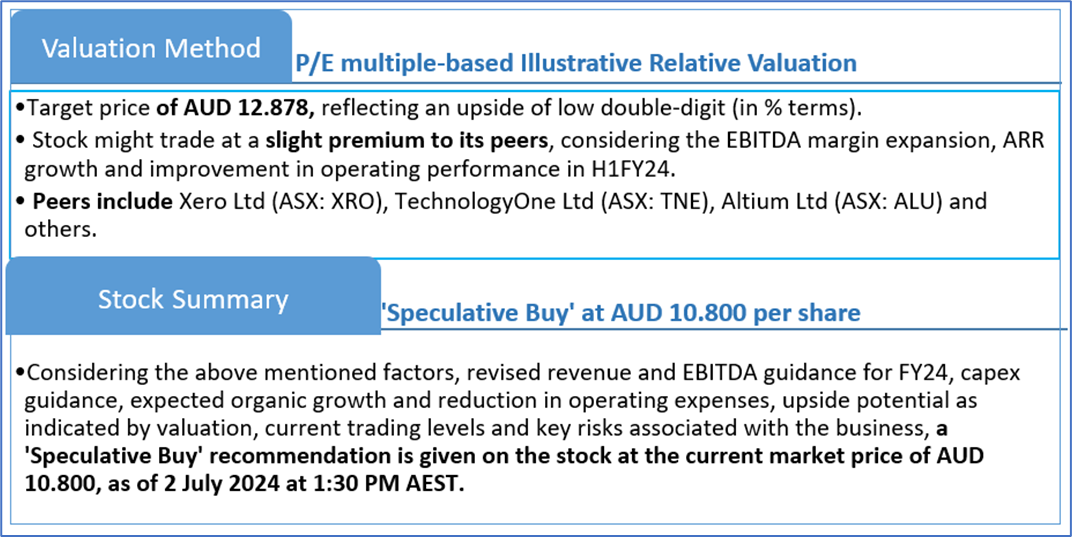
4.2 Fundamental Valuation
Valuation Methodology: P/E Multiple Based Relative Valuation (Illustrative)
Markets are trading in a highly volatile zone currently due to certain macro-economic issues and geopolitical tensions prevailing. Therefore, it is prudent to follow a cautious approach while investing.
Note 1: Past performance is neither an indicator nor a guarantee of future performance.
Note 2: The reference date for all price data, currency, technical indicators, support, and resistance levels is 2 July 2024. The reference data in this report has been partly sourced from REFINITIV.
Note 3: Investment decisions should be made depending on an individual's appetite for upside potential, risks, holding duration, and any previous holdings. An 'Exit' from the stock can be considered if the Target Price mentioned as per the Valuation and or the technical levels provided has been achieved and is subject to the factors discussed above.
Note 4: Dividend Yield may vary as per the stock price movement.
Technical Indicators Defined: -
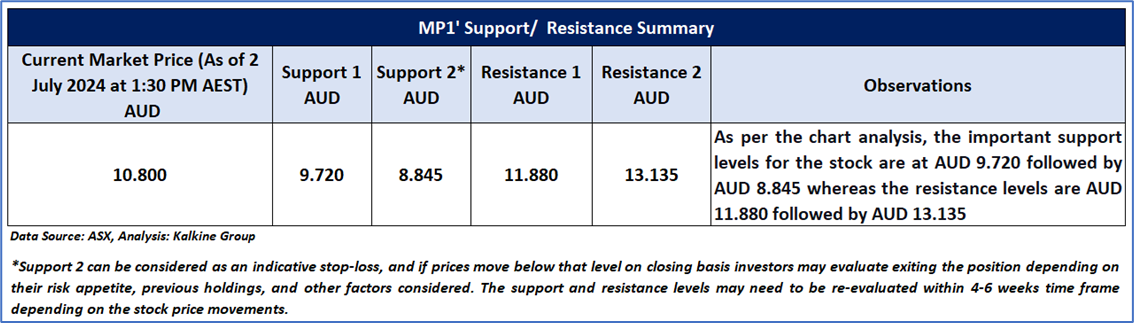
Support: A level at which the stock prices tend to find support if they are falling, and a downtrend may take a pause backed by demand or buying interest. Support 1 refers to the nearby support level for the stock and if the price breaches the level, then Support 2 may act as the crucial support level for the stock.
Resistance: A level at which the stock prices tend to find resistance when they are rising, and an uptrend may take a pause due to profit booking or selling interest. Resistance 1 refers to the nearby resistance level for the stock and if the price surpasses the level, then Resistance 2 may act as the crucial resistance level for the stock.
Stop-loss: It is a level to protect further losses in case of unfavourable movement in the stock prices.
Disclaimer This report has been issued by Kalkine New Zealand Limited (FSP691351) (NZBN:9429047678101) (“Kalkine”). Kalkine is a Financial Advice Provider (“FAP”) and is authorised by a Class 1 Financial Advice Provider Licence issued by Financial Markets Authority (“FMA”) to provide financial advice. Kalkine provides only general financial advice through its research reports following a person becoming a member. The reports contain buy/sell/hold and other recommendations in relation to equity securities, managed funds and other managed investment schemes and other financial advice products. The recommendations and opinions in this report and on Kalkine website do not take into account any of your investment objectives, financial situation or needs. Before you make a decision about whether to acquire a financial product, you should obtain the Product Disclosure Statement from the product issuer. You should consider the appropriateness of advice taking into account your own objectives, financial situation and needs and seek independent financial advice before making any financial decisions. If you act on the advice in the research reports, you may have to pay fees, expenses or other amounts (but not to Kalkine). Further information about the complaints and dispute resolution process, as well as information about Kalkine’s duties are available on Kalkine’s website. Please read our Financial Advice Provider (FAP) disclosure statement and Complaints Handling Guide, which are available on the website.
Past performance is not a reliable indicator of future performance.
 Please wait processing your request...