
Company Overview: Mainfreight Limited is engaged in the business of supply chain logistics. The Company provides a range of warehousing, domestic distribution, as well as international air and ocean freight services. The Company operates its business in over 240 branches in over 20 countries across the world. The Company operates in the domestic supply chain, which includes moving and storing freight within countries, and air and ocean freight industries, which includes moving freight between countries. The Company's geographical segments include New Zealand, Australia, The Americas, Asia and Europe. It provides a suite of services covering both import and export by sea and air, customs clearance, tariff classification, and costing and consultancy all operated in house. It also manages the specialized services, such as project logistics, bulk liquids, perishables, automotive, trans border and distribution. It provides a full door-to-door solution backed by full visibility from pick up to delivery.

MFT Details
Satisfactory Results led By Global Footprints: Mainfreight Limited (NZX: MFT) is a global logistic provider that offers managed warehousing and domestic and international freight forwarding. The company has branches and team throughout New Zealand, Australia, Europe, China and the United States. The company started its businesses in New Zealand, in 1978, and soon it grew to become the country’s most extensive freight network. The market capitalisation of the company stood at ~$3.675 billion on 02nd March 2020. For the half-year ended 30th September 2019 and under IFRS 16, the company reported satisfactory results as compared to the previous period. The company reported revenue of $1.5 billion, up 4.9% on pcp and EBITDA of $176.46 million, up 62.9% on pcp. Net profit stood at $59.13 million, up 6.2% on pcp. Continuing profit improvement from the Americas and Europe has aided overall performance, as it continues to enhance margins and services in both the regions. The company’s Australian and New Zealand operations had to face increased overhead costs and decelerating economic conditions. In Asia, freight revenues reduced due to trade tariffs on the Asia/USA trade lanes and the disturbances being felt in Hong Kong. At the same time, overhead costs soared with network expansion to Malaysia and Japan. The company announced an interim dividend of 25.0 cents per share fully imputed at the 28% company tax rate.
These 10-year figures reflects the past performance of the company and increasing intensity of growth. Moreover, the key financial numbers of the past 10 years witnessed upward momentum and reflects that MFT is capable to maintaining decent financial position in different business cycles. The company is possessing robust track record of consistent earnings as well as dividend growth, while there is no shortage of the future potential. The combination of 3 core products i.e. Domestic Transportation, Warehousing (managed logistics) and Air & Ocean freight forwarding, gives full supply chain solution for the customers.
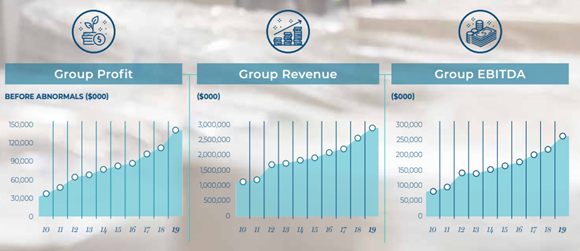
Key Numbers (Source: Company Reports)
The company’s total revenues have witnessed a CAGR of 9.51% between FY 2015- FY 2019 and, therefore, it can be said that the company is possessing decent capabilities to garner revenues. There are expectations that its revenue-generation capabilities might help it in further strengthening its financial footing. MFT has been able to achieve better service levels along with competitive positioning as compared to the industry players of much greater scale.
Top 10 Shareholders: The following table provides an overview of the top 10 shareholders of Mainfreight Limited. Plested (Bruce George) is the largest shareholder with a percentage holding of 15.72%.
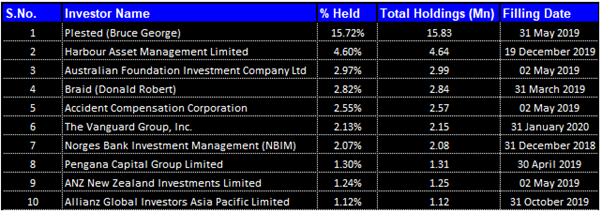
Top 10 Shareholders (Source: Thomson Reuters)
Decent Position of Key Margins: In 1HFY20, the company’s gross margins stood at 41.1% as compared to 38.8% in 1H FY 2019. This indicates an improvement in financial condition of the company and reflects that the company can make reasonable profits on sales as long as it keeps its direct costs in control. The company’s EBITDA margin stood at 11.8% in 1HFY20 which reflects an increase from 1H FY 2019 figure of 7.6%.
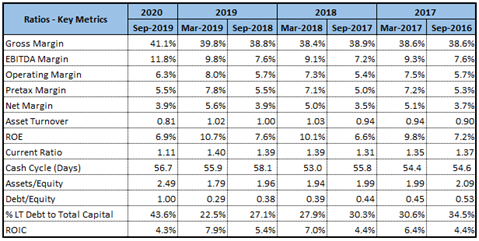
Key Metrics (Source: Thomson Reuters)
Divisional Performance: The company’s overall results remain strong in New Zealand on the YoY basis. However, they experienced a slow economic conditions mainly affecting domestic transport growth. But still, the company continues to increase the market share throughout all three products (Transport, Warehousing and Air & Ocean). The increase in overhead costs and a lower level of sales growth in the transport business kept profit growth below expectations. However, Air & Ocean operations registered revenue and profit growth throughout both exports and imports, and in both sea and air freight modes.
In the Australian segment, the company reported revenue growth of 5.5% to A$360.42 million. In the transport business, revenue growth stalled at 2% due to slowing economic conditions. In the Warehousing business, new customer gains boosted warehouse utilisation with suitable profit improvements. Air & Ocean operations accomplished improved gross margins and saw export volumes in both sea and air freight improve.
The European operations delivered healthy growth, as it improved business margins and gain market share. EBITDA increased by 33.6% to EU€13.90 million and revenue increased by 6.3% to EU€193.77 million.
In the American operations, EBITDA increased by 22.3% to US$13.44 million and revenue increased by 2.9% to US$244.04 million.
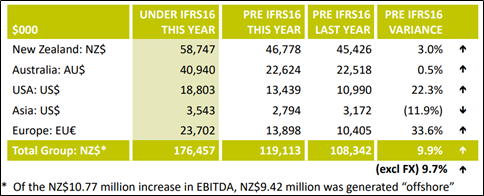
Half-year EBITDA Analysis (Source: Company Reports)
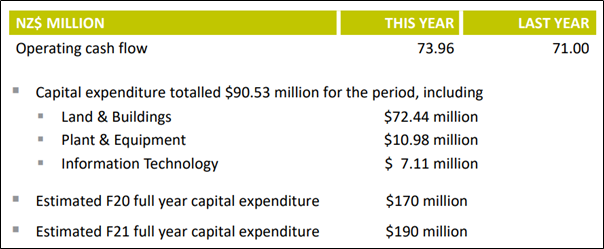
Financial Position of MFT: The company’s operating cash flows stood at $73.96 million, up from $71.00 million in the previous year, indicating increased profitability and acceptable cash collection. The net capital expenditure equalled $90.53 million, with expenditure for plant and equipment of $10.98 million, land and buildings accounting for $72.44 million and information technology of $7.11 million. The company’s expectations for capital expenditure for full financial year ending 31st March 2020 has been estimated to be in the range of $170 million, with further $190 million estimated for the capital expenditure in 2021 financial year.
Capital Management (Source: Company Reports)
Excellent Record of Earnings and Dividend Growth: For the year ended 31st March 2019, the company reported total revenue of $2.954 billion, up by 12.9% and EBITDA was up by 19.5% or $42 million to $257.05 million. Of this increase, $30 million was generated by offshore businesses and only $12 million from within New Zealand. The well-signalled plan of increasing global branch network, within cities, within countries and between countries, has continued during this past year. The advantage of network development throughout three core products: warehousing (Logistics), domestic transportation (Transport) and international freight forwarding (CaroTrans and Air & Ocean) has been exhibited in these improving financial results.
With respect to New Zealand results, revenue increased 7.9% to $718.79 million, and EBITDA is up 12.2% to $110.56 million. Australian business improved revenue by 13.9% to AU$710.17 million and EBITDA to AU$55.37 million, up 11.0%. In the Americas, the company has improved overall profitability, with EBITDA up 37.2% to US$26.11 million and revenues improving 13.5% to US$493.86 million.
Key Metrics (Source: Company Reports)
Long Term Targets and Their Current Status: The company is planning to open more than 400 branches globally, which is now being stretched till FY22. The company is targeting to extend its network across 30 countries worldwide, out of which it is currently operating in 24 countries. The company is targeting to improve trade with Top 500 customers to all three divisions and all 5 regions and currently 31% of top 500 customers trade across 3 divisions, and 5% trade in all 5 regions. For FY21, the company is targeting a sales revenue of $4 billion, which represents a CAGR of 16.37% over FY19 to FY21.
Outlook for FY20: The company reported satisfactory results for the first half of FY20 due to its global presence providing growth and increased profitability across various markets, all with differing economic climates and market share opportunities. The company’s Asian business is not expected to end the current year better than the previous year. The company anticipates seeing increased profitability and growth in American and European markets. The traditional markets of Australia and New Zealand are anticipated to improve further through to year-end, resulting in improved returns over the previous year. The period to 30 September 2019 has demonstrated the benefits of a global network strategy and the company expects an improved full-year result accordingly.
Valuation Methodology: Price to Cash Flow-Based Relative Valuation
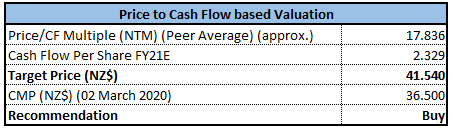
Price to Cash Flow-Based Relative Valuation (Source: Thomson Reuters), NTM: Next Twelve Months
Note: All forecasted figures and peers have been taken from Thomson Reuters
Technical Overview:
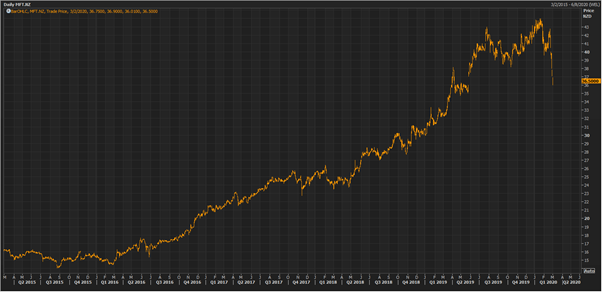
Monthly Chart -
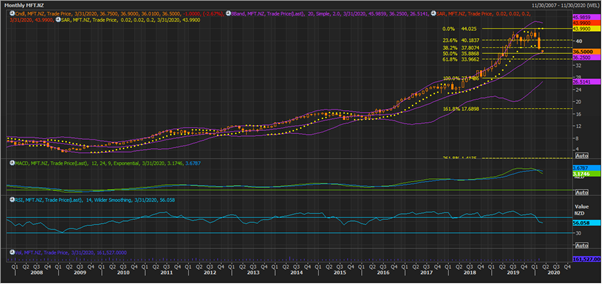
Source: Thomson Reuters
Weekly Chart –
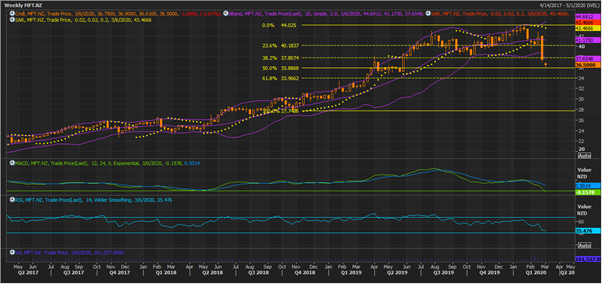
Source: Thomson Reuters
Daily Chart –
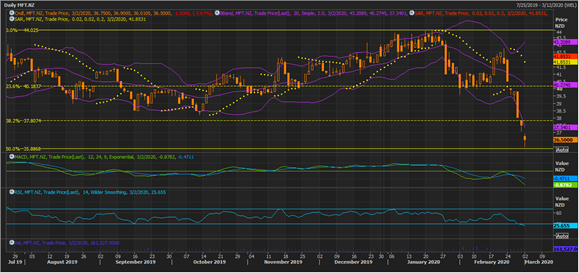
Source: Thomson Reuters
Note: Purple colour lines are Bollinger bands, yellow colour horizontal lines are retracement lines and yellow colour dotted line is Parabolic SAR.
The stock has been in uptrend from Oct. 2018, barring periods of bullish consolidation. Lower closing of the stock price for Jan. 2020 against Dec. 2019 closing, was clear indication that it had entered into correction territory. However, Feb. 2020 witnessed a sharper correction in price, correcting below 38.2% retracement level. During the previous trading session, the stock took support around 50% retracement level of $35.88 which is likely to be held as bullish cross-over for MACD on the monthly and weekly charts and RSI reading above 50 on the monthly chart, demonstrate strength in bullish momentum for the stock in medium-term. However, bearish cross-over for MACD on the daily chart and RSI reading around 35 and 25 on the weekly and daily charts respectively, point at near-term weakness in trend.
RSI reading of 35 on the weekly chart and 25 on the daily chart also suggest the stock to have either reached or about to reach on oversold zones which may be towards inducing traders to build long positions on the stock. Thus, greater bid to build long position will cause the stock price to rebound.
All-in-all, we believe that the underlying trend for the stock remains to be bullish with short-term deviation from the underlying trend might provide initial support to the stock around $35.88 and on breach below $33.96 will act as major support for the stock. However, the stock remaining on bullish trend is likely to meet with initial resistance around $41.17 and on breach above $44.0 should provide major resistance to the stock.
Stock Recommendation: The stock of MFT gave a return of +14.82% in the past one year and is trading slightly below its average of 52-week low high level of $32.25 and $43.99. This offers a decent opportunity for the shareholders to benefit from accumulation. The company has outlaid long-term targets and there are expectations that the company can gain attraction of the market participants. Mainfreight Chinese branches have now resumed normal operations, but as a precautionary measure, it indicated to maintain two shifts approach through until March 2. The company stated that between 60% to 80% of shippers and factories have resumed export activity.
Considering the decent performance in American and European market, current trading levels, resuming of Chinese operations and decent outlook, we have valued the stock using a relative valuation method, i.e., Price to Cash Flow multiple, and arrived at a target price of lower double-digit growth (in percentage terms).
Hence, we recommend a “Buy” rating on the stock at the current market price of NZ$36.500 per share, down by 2.67% on March 2, 2020.
MFT Daily Technical Chart (Source: Thomson Reuters)
Disclaimer
Kalkine New Zealand Limited is authorised to provide class advice only. The information on this site does not take into account any of your investment objectives, financial situation or needs. Before you make a decision about whether to acquire a financial product, you should obtain the Product Disclosure Statement from the product issuer. You should consider the appropriateness of advice taking into account your own objectives, financial situation and needs and seek independent financial advice before making any financial decisions.
Past performance is not a reliable indicator of future performance.
 Please wait processing your request...