
Section 1: Company Overview and Fundamentals
1.1 Company Overview:
Lemonade Inc (NYSE: LMND) offers a range of insurance products, including renters, homeowners, auto, pet, and life insurance. It serves customers in the United States and Europe, including the UK, and distributes its services through various sales channels.
Kalkine’s Diversified Opportunities Report covers the Company Overview, Key positives & negatives, Investment summary, Key investment metrics, Top 10 shareholding, Business updates and insights into company recent financial results, Key Risks & Outlook, Price performance and technical summary, Target Price, and Recommendation on the stock.
Stock Performance:

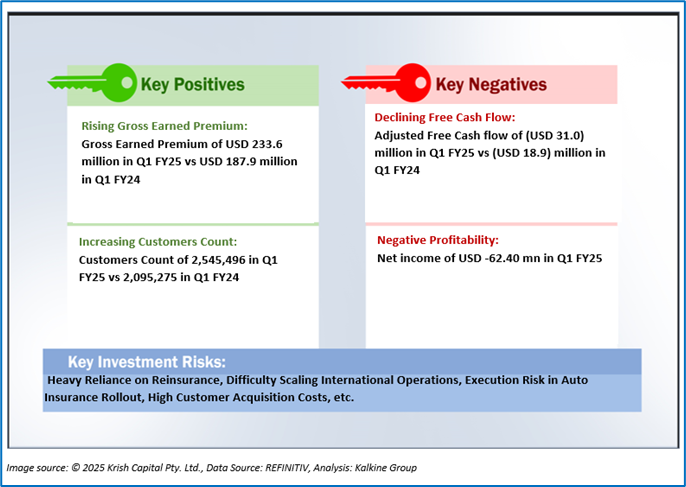
1.2 The Key Positives, Negatives, and Investment summary

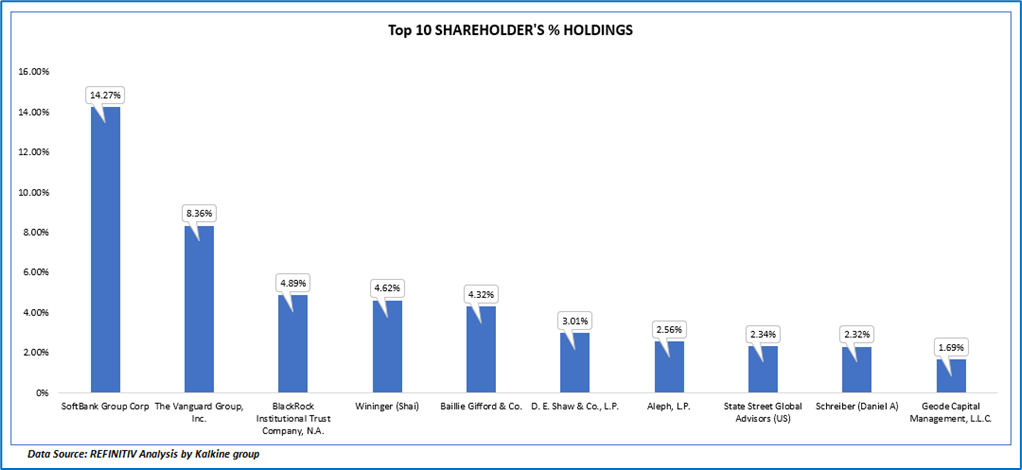
1.3 Top 10 shareholders:
The top 10 shareholders together form ~ 48.39% of the total shareholding, signifying concentrated shareholding. SoftBank Group Corp and The Vanguard Group, Inc are the biggest shareholders, holding the maximum stake in the company at 14.27% and 8.36%, respectively.
1.4 Key Metrics:
The graph shows a steady increase in revenue from Q1 FY24 (USD 119.1 million) to Q1 FY25 (USD 151.2 million), mainly attributed to higher gross earned premiums, increased ceding commission income, and stronger net investment income Despite this growth, the company consistently reported net losses each quarter, peaking at USD -67.7 million in Q3 FY24 and narrowing to USD -30.0 million in Q4 FY24 before rising again to USD -62.4 million in Q1 FY25. This is due to higher growth-related expenses and the effects of the California wildfires and FAIR Plan assessment, partially offset by increased revenue.

Section 2: Business Updates and Corporate Business Highlights
2.1 Recent Business Updates
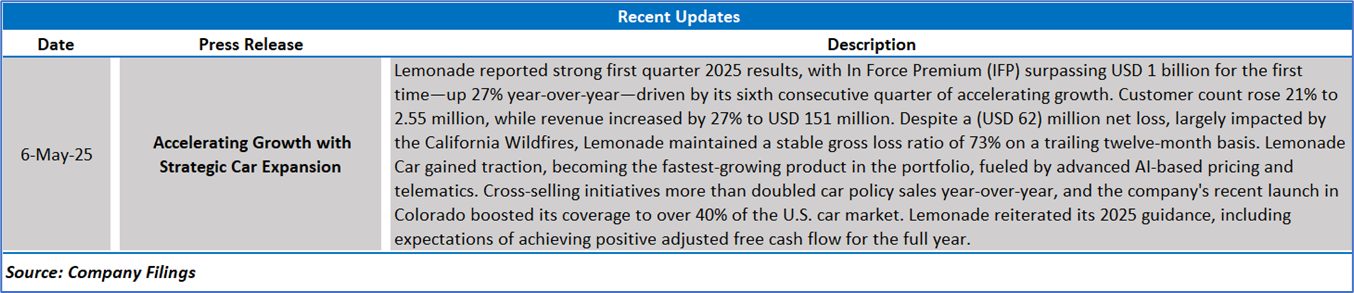
2.2 Insights of Q1FY25:

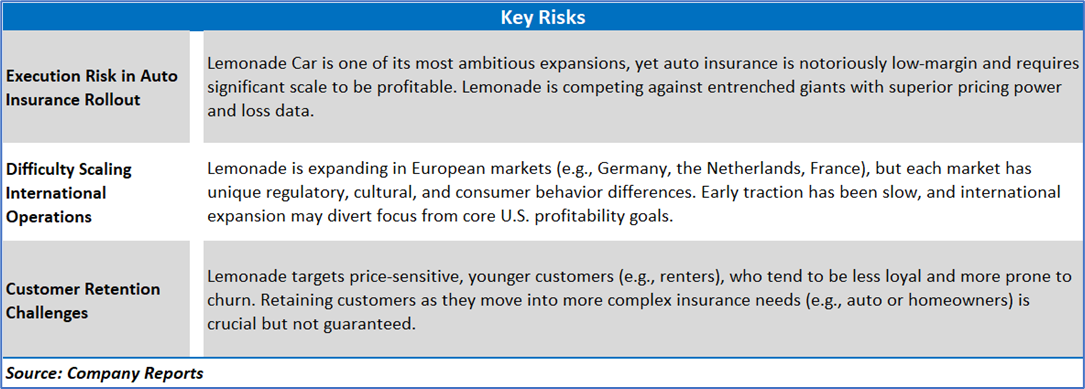
Section 3: Key Risks & Outlook

Section 4: Stock Recommendation Summary:
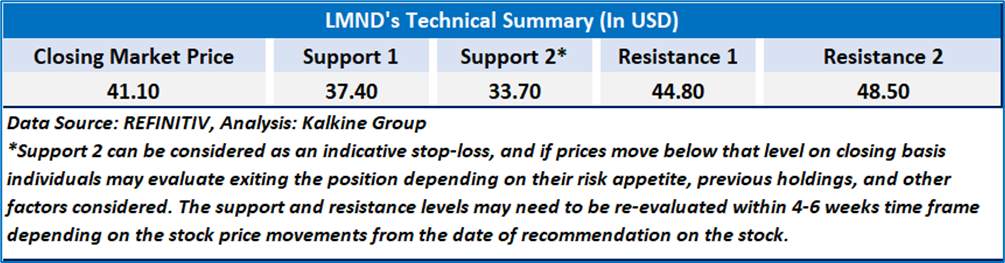
4.1 Price Performance and Technical Summary:
Stock Performance:

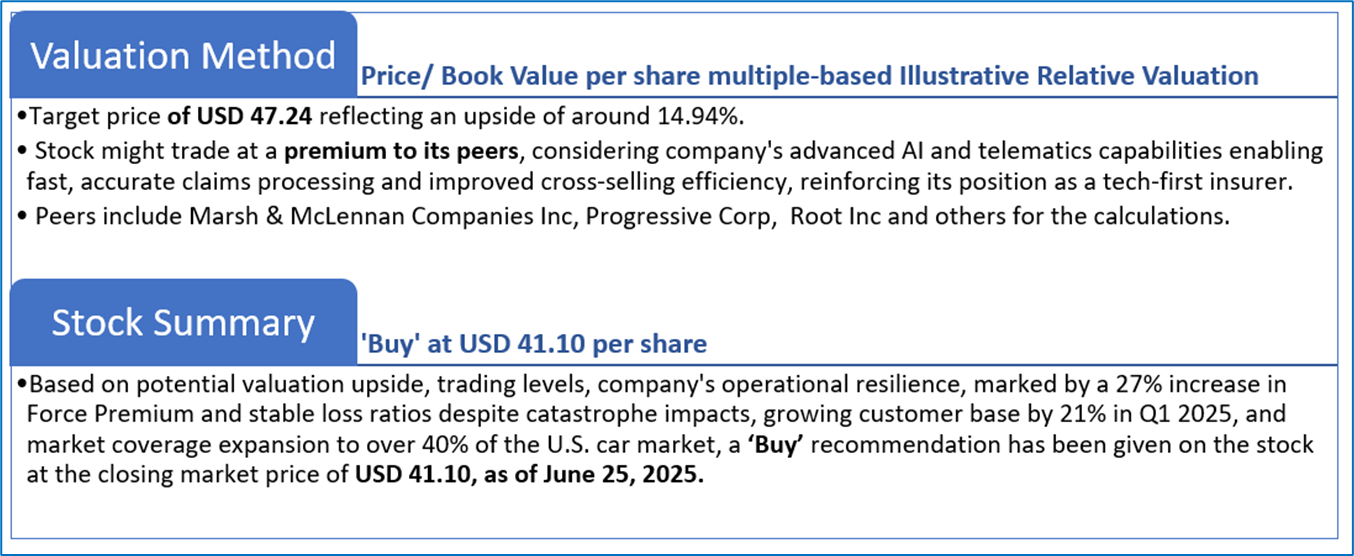
4.2 Fundamental Valuation
Valuation Methodology: Price/Book Value per share Multiple Based Relative Valuation

Markets are trading in a highly volatile zone currently due to certain macroeconomic issues and geopolitical tensions prevailing. Therefore, it is prudent to follow a cautious approach while investing.
Note 1: Past performance is not a reliable indicator of future performance.
Note 2: The reference date for all price data, currency, technical indicators, support, and resistance levels is June 25, 2025. The reference data in this report has been partly sourced from REFINITIV.
Note 3: Investment decisions should be made depending on an individual's appetite for upside potential, risks, holding duration, and any previous holdings. An 'Exit' from the stock can be considered if the Target Price mentioned as per the Valuation and or the technical levels provided has been achieved and is subject to the factors discussed above.
Note 4: The report publishing date is as per the Pacific Time Zone.
Technical Indicators Defined: -
Support: A level at which the stock prices tend to find support if they are falling, and a downtrend may take a pause backed by demand or buying interest. Support 1 refers to the nearby support level for the stock and if the price breaches the level, then Support 2 may act as the crucial support level for the stock.
Resistance: A level at which the stock prices tend to find resistance when they are rising, and an uptrend may take a pause due to profit booking or selling interest. Resistance 1 refers to the nearby resistance level for the stock and if the price surpasses the level, then Resistance 2 may act as the crucial resistance level for the stock.
Stop-loss: It is a level to protect against further losses in case of unfavorable movement in the stock prices.
Disclaimer This report has been issued by Kalkine New Zealand Limited (FSP691351) (NZBN:9429047678101) (“Kalkine”). Kalkine is a Financial Advice Provider (“FAP”) and is authorised by a Class 1 Financial Advice Provider Licence issued by Financial Markets Authority (“FMA”) to provide financial advice. Kalkine provides only general financial advice through its research reports following a person becoming a member. The reports contain buy/sell/hold and other recommendations in relation to equity securities, managed funds and other managed investment schemes and other financial advice products. The recommendations and opinions in this report and on Kalkine website do not take into account any of your investment objectives, financial situation or needs. Before you make a decision about whether to acquire a financial product, you should obtain the Product Disclosure Statement from the product issuer. You should consider the appropriateness of advice taking into account your own objectives, financial situation and needs and seek independent financial advice before making any financial decisions. If you act on the advice in the research reports, you may have to pay fees, expenses or other amounts (but not to Kalkine). Further information about the complaints and dispute resolution process, as well as information about Kalkine’s duties are available on Kalkine’s website. Please read our Financial Advice Provider (FAP) disclosure statement and Complaints Handling Guide, which are available on the website.
Past performance is not a reliable indicator of future performance.
 Please wait processing your request...