Section 1: Company Overview and Fundamentals
Company Overview:
LCNB Corp. (NASDAQ: LCNB) is a financial holding company. The Company operates, through its wholly owned subsidiary, LCNB National Bank (the Bank), which serves customers and communities in Southwest and South-Central Ohio. The Bank operates over 36 offices; one branch office in Boone County, Kentucky. It offers various loan products, such as commercial and industrial loans, commercial and residential real estate loans, agricultural loans, construction loans, various types of consumer loans, and small business administration loans.
Kalkine’s Dividend Income Report covers the Company Overview, Key positives & negatives, Investment summary, Key investment metrics, Top 10 shareholding, Business updates and insights into company recent financial results, Key Risks & Outlook, Price performance and technical summary, Target Price, and Recommendation on the stock.
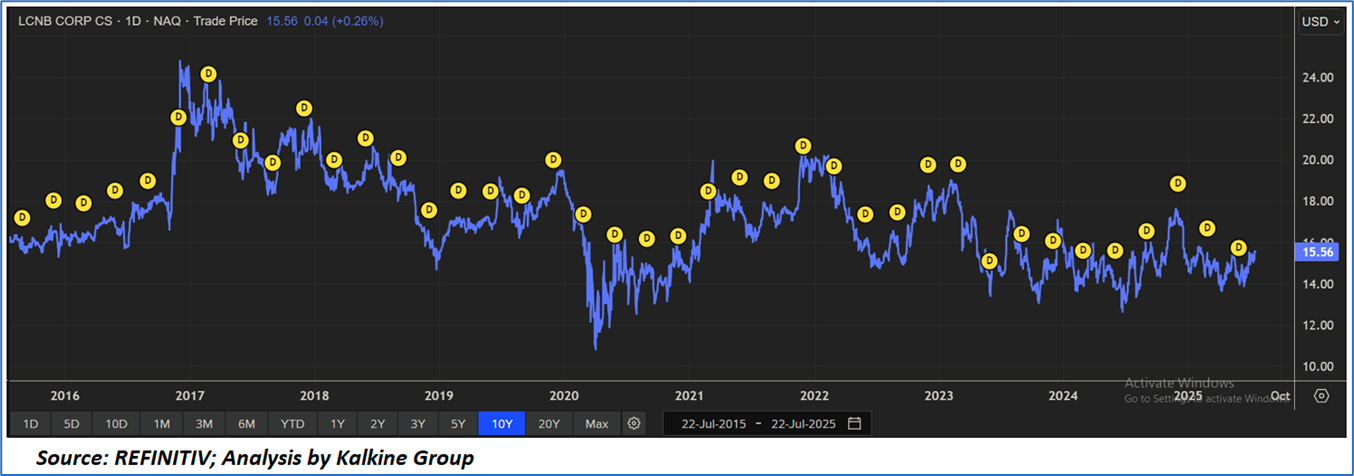
Price Performance:

1.2 The Key Positives, Negatives, and Investment summary


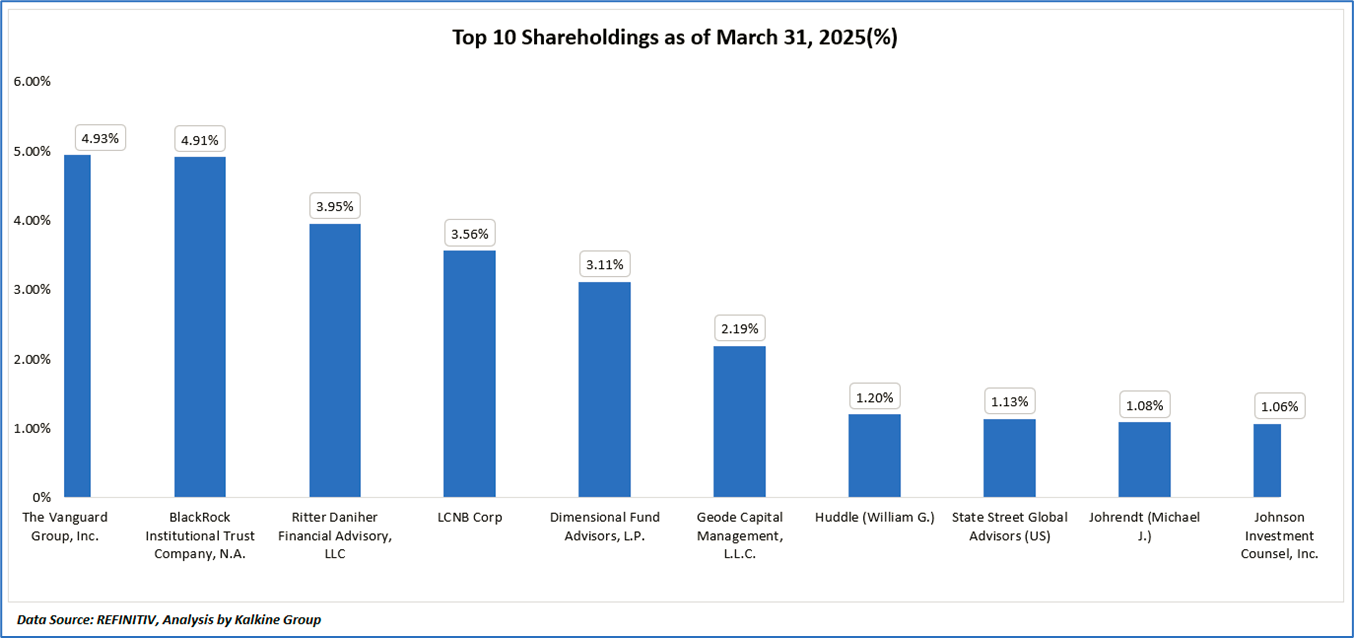
1.3 Top 10 shareholders:
The top 10 shareholders together form ~27.12% of the total shareholding, signifying concentrated shareholding. The Vanguard Group, Inc., and BlackRock Institutional Trust Company, N.A. are the biggest shareholders, holding the maximum stake in the company at ~4.93% and ~4.91%, respectively.
1.4 Dividend payments with impressive dividend yield:
On July 22, 2025, LCNB Corp. (NASDAQ: LCNB) announced dividends of USD 0.22 per share for Q2 2025, contributing to a year-to-date total of USD 0.44 per share, payable to shareholders of record, underscoring its commitment to consistent shareholder returns. As of July 22, 2025, LCNB’s dividend yield is approximately 5.67%, based on recent stock price data and dividend payments. Historically, LCNB has maintained a steady dividend policy, with a fiscal year dividend yield aligning closely with its five-year average of around 4.8%. However, the company’s dividend coverage ratio for Q2 2025 reflects a strong position, supported by net income of USD 5.9 million, though potential risks from rising nonperforming loans (USD 4.8 million, 0.28% of total loans) could challenge future earnings stability. LCNB’s focus on cost management and acquisition synergies suggests a stable outlook for sustaining and potentially growing its dividend payments over time.
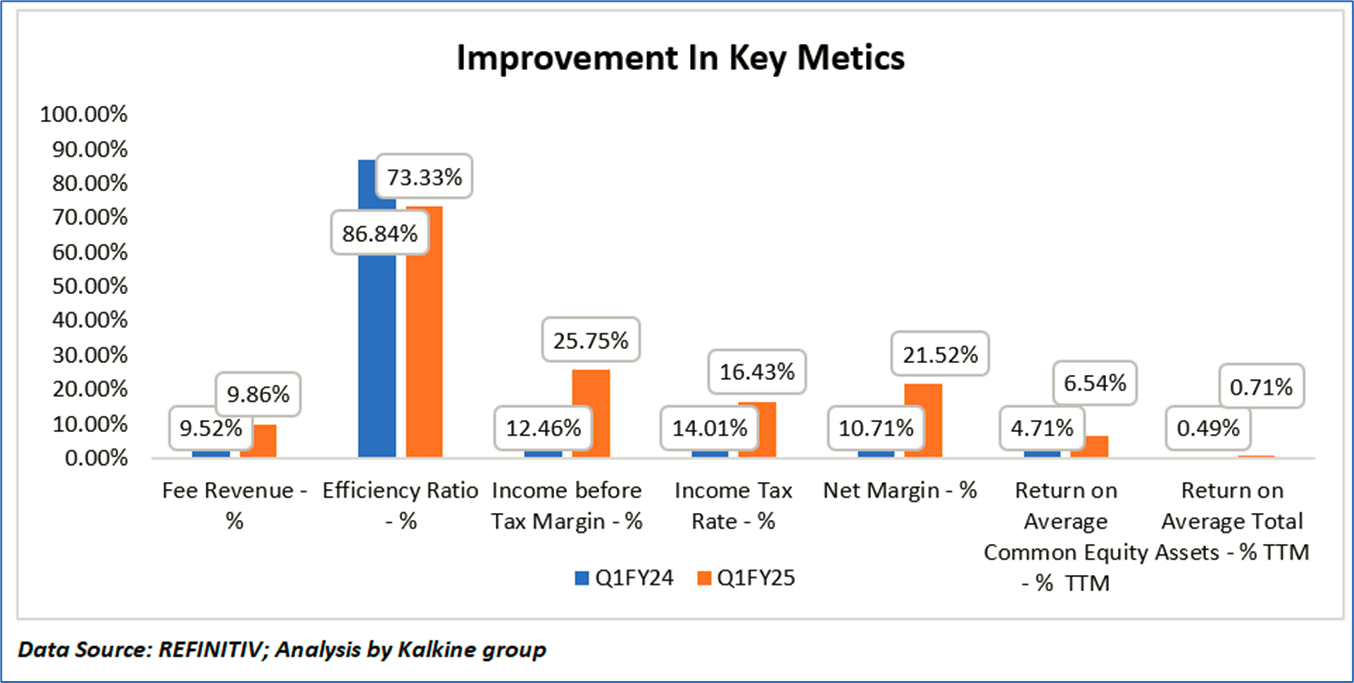
1.5 Key Metrics
LCNB Corp. (NASDAQ: LCNB) demonstrated significant financial improvement in Q1 2025 compared to Q1 2024, as evidenced by key performance metrics. Fee revenue as a percentage of total revenue rose slightly from 9.52% to 9.86%, reflecting modest growth in non-interest income sources. The efficiency ratio improved markedly from 86.84% to 73.33%, indicating enhanced operational efficiency and better cost management, likely driven by reduced merger-related expenses from the 2024 Eagle acquisition. The income before tax margin surged from 12.46% to 25.75%, showcasing stronger pre-tax profitability, while the net margin nearly doubled from 10.71% to 21.52%, underscoring robust bottom-line growth supported by a 24.2% increase in net income to USD 5.9 million in Q2 2025. The income tax rate increased from 14.01% to 16.43%, reflecting a higher tax burden. Additionally, the trailing twelve-month (TTM) return on average common equity improved from 4.71% to 6.54%, and the TTM return on average total assets rose from 0.49% to 0.71%, signaling better utilization of equity and assets to generate returns, positioning LCNB favorably for sustained profitability despite potential risks from rising nonperforming loans.
Section 2: Business Updates and Financial Highlights
2.1 Recent Updates:
The below picture gives an overview of the recent updates:

2.2 Insights of Q2FY25:

Section 3: Key Risks and Asset & Credit Quality Overview:


Section 4: Stock Recommendation Summary:
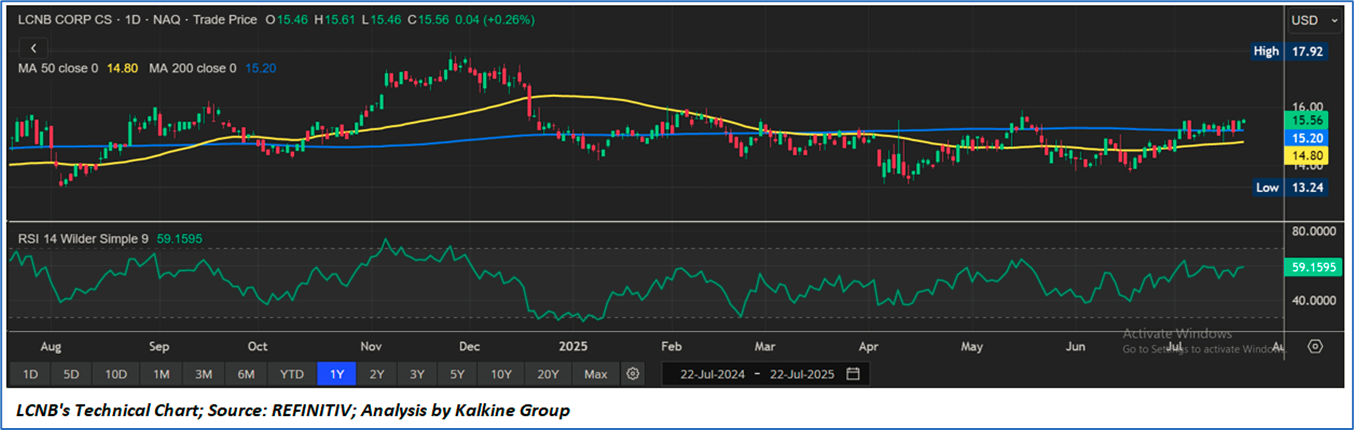
4.1 Technical Summary:
Price Performance:

4.2 Fundamental Valuation
Valuation Methodology: Price/Book Value Per Share Multiple Based Relative Valuation


Markets are trading in a highly volatile zone currently due to certain macroeconomic issues and geopolitical tensions prevailing. Therefore, it is prudent to follow a cautious approach while investing.
Note 1: Past performance is not a reliable indicator of future performance.
Note 2: The reference date for all price data, currency, technical indicators, support, and resistance levels is July 22, 2025. The reference data in this report has been partly sourced from REFINITIV.
Note 3: Investment decisions should be made depending on an individual's appetite for upside potential, risks, holding duration, and any previous holdings. An 'Exit' from the stock can be considered if the Target Price mentioned as per the Valuation and or the technical levels provided has been achieved and is subject to the factors discussed above.
Note 4: The report publishing date is as per the Pacific Time Zone.
Technical Indicators Defined: -
Support: A level at which the stock prices tend to find support if they are falling, and a downtrend may take a pause backed by demand or buying interest. Support 1 refers to the nearby support level for the stock and if the price breaches the level, then Support 2 may act as the crucial support level for the stock.
Resistance: A level at which the stock prices tend to find resistance when they are rising, and an uptrend may take a pause due to profit booking or selling interest. Resistance 1 refers to the nearby resistance level for the stock and if the price surpasses the level, then Resistance 2 may act as the crucial resistance level for the stock.
Stop-loss: It is a level to protect against further losses in case of unfavorable movement in the stock prices.
Disclaimer This report has been issued by Kalkine New Zealand Limited (FSP691351) (NZBN:9429047678101) (“Kalkine”). Kalkine is a Financial Advice Provider (“FAP”) and is authorised by a Class 1 Financial Advice Provider Licence issued by Financial Markets Authority (“FMA”) to provide financial advice. Kalkine provides only general financial advice through its research reports following a person becoming a member. The reports contain buy/sell/hold and other recommendations in relation to equity securities, managed funds and other managed investment schemes and other financial advice products. The recommendations and opinions in this report and on Kalkine website do not take into account any of your investment objectives, financial situation or needs. Before you make a decision about whether to acquire a financial product, you should obtain the Product Disclosure Statement from the product issuer. You should consider the appropriateness of advice taking into account your own objectives, financial situation and needs and seek independent financial advice before making any financial decisions. If you act on the advice in the research reports, you may have to pay fees, expenses or other amounts (but not to Kalkine). Further information about the complaints and dispute resolution process, as well as information about Kalkine’s duties are available on Kalkine’s website. Please read our Financial Advice Provider (FAP) disclosure statement and Complaints Handling Guide, which are available on the website.
Past performance is not a reliable indicator of future performance.
 Please wait processing your request...