Kinaxis Inc.
Section1: Company Overview

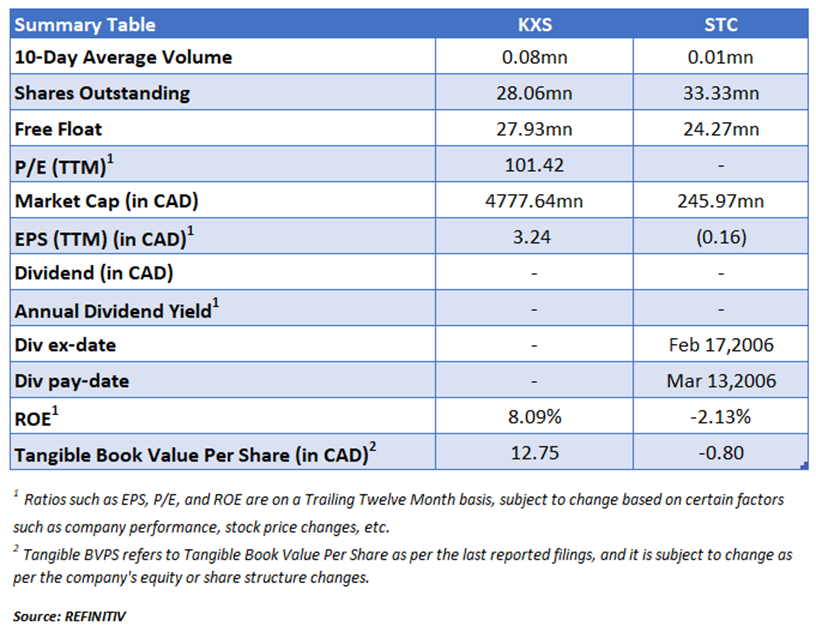
Kinaxis Inc. (TSX: KXS) is a Canada-based provider of software solutions for sales and operations planning (S&OP) and supply chain management. The firm's flagship RapidResponse product is offered on the cloud. Its capabilities include consequence evaluation and alerting, responsibility-based collaboration, high-speed analytics, and scenario simulation. Kinaxis's S&OP solution capabilities include supply and demand planning, capacity and inventory planning, and inventory management. The firm has operations in North America, Europe, and Asia-Pacific regions.
This Artificial Intelligence and Emerging Technologies report covers the Investment Highlights, Key Financial Metrics, Risks, Technical Analysis along with the Valuation, Target Price, and Recommendation on the stock.

Section2: Financial Highlights

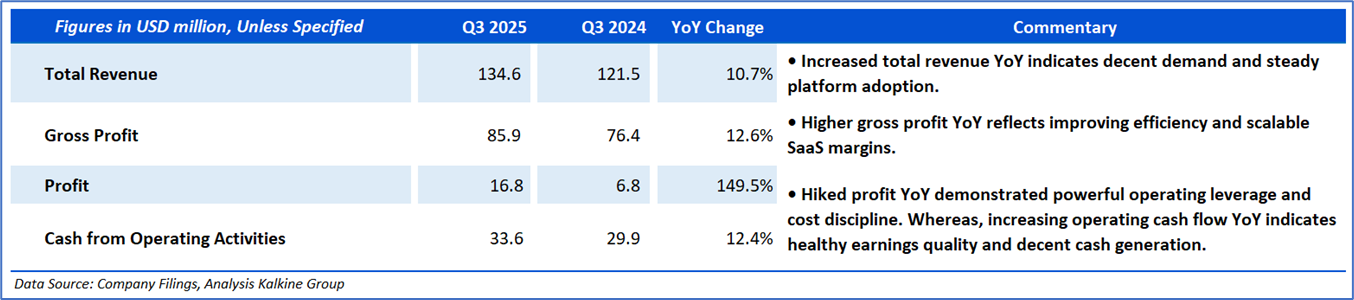
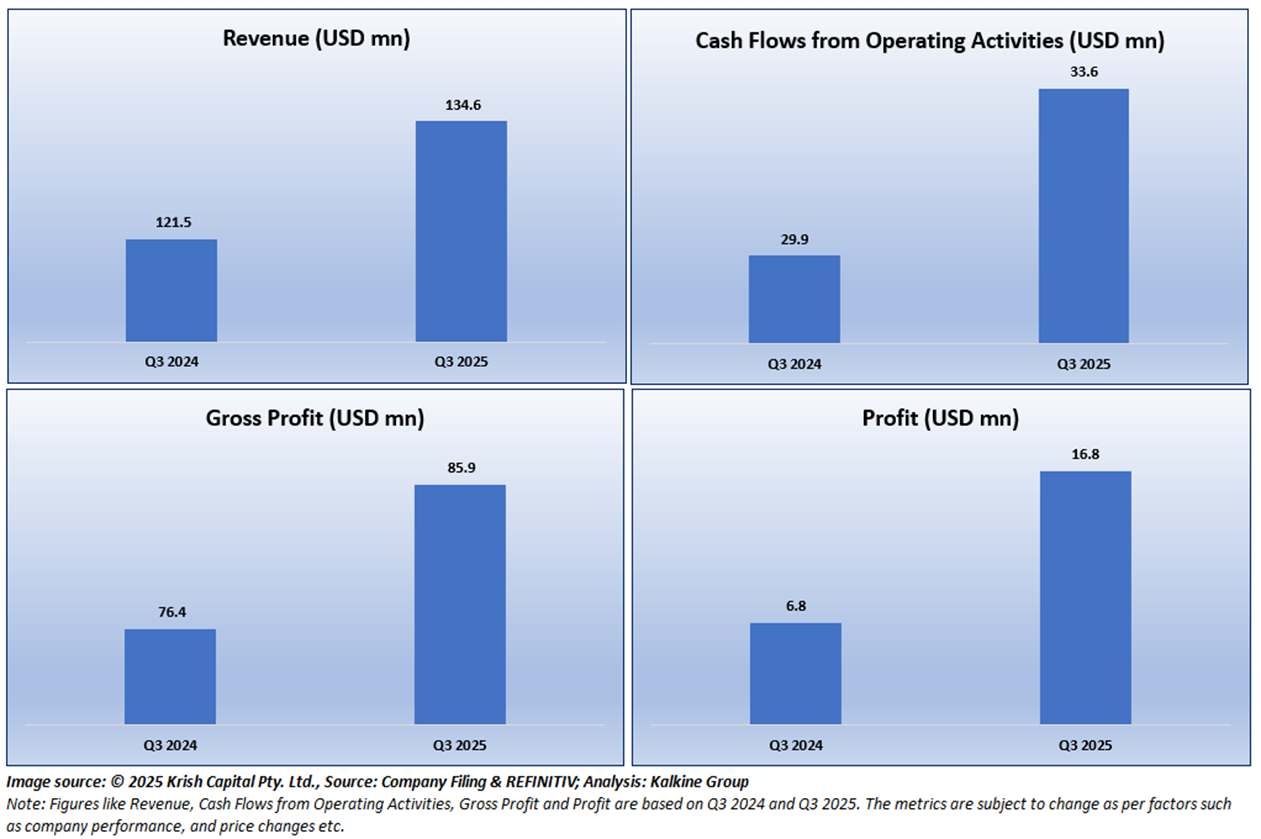
Section 3: Key Metrics
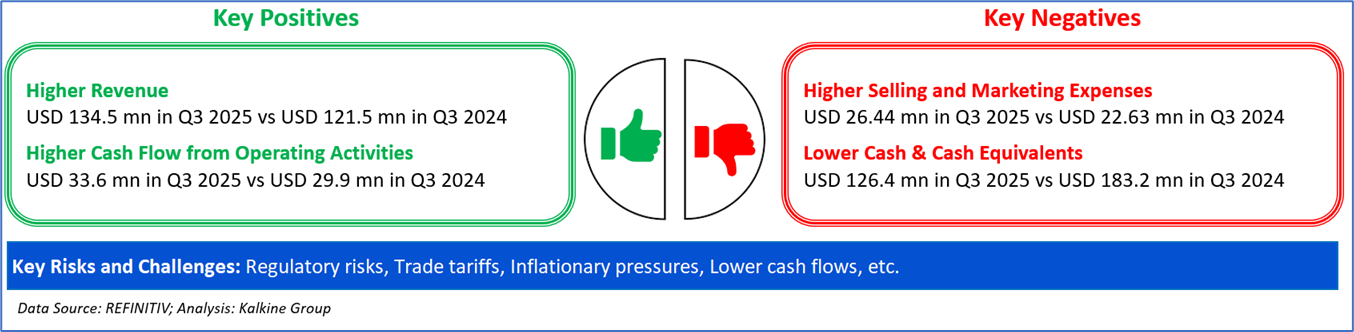
Below charts depict the change in Revenue, Cash Flows from Operating Activities, Gross Profit and Profit are based on Q3 2024 and Q3 2025
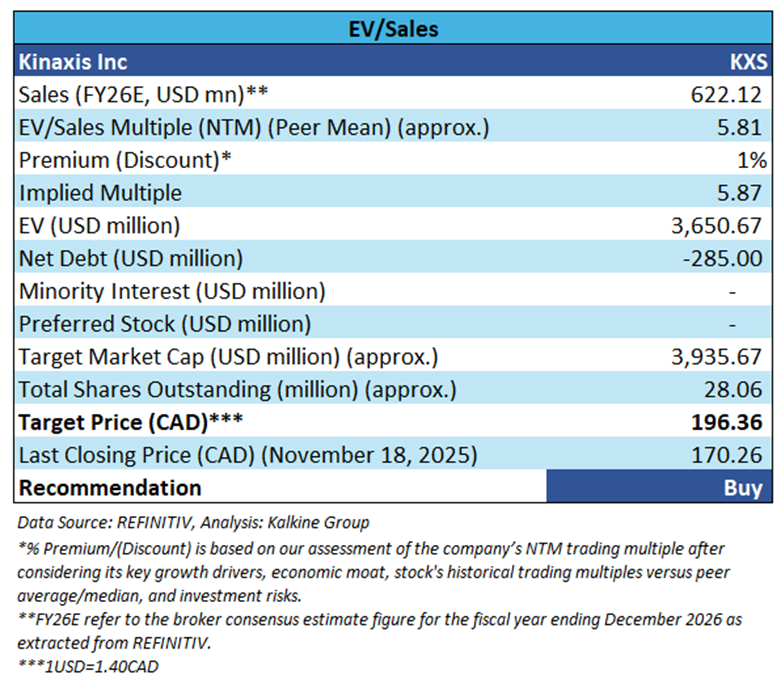
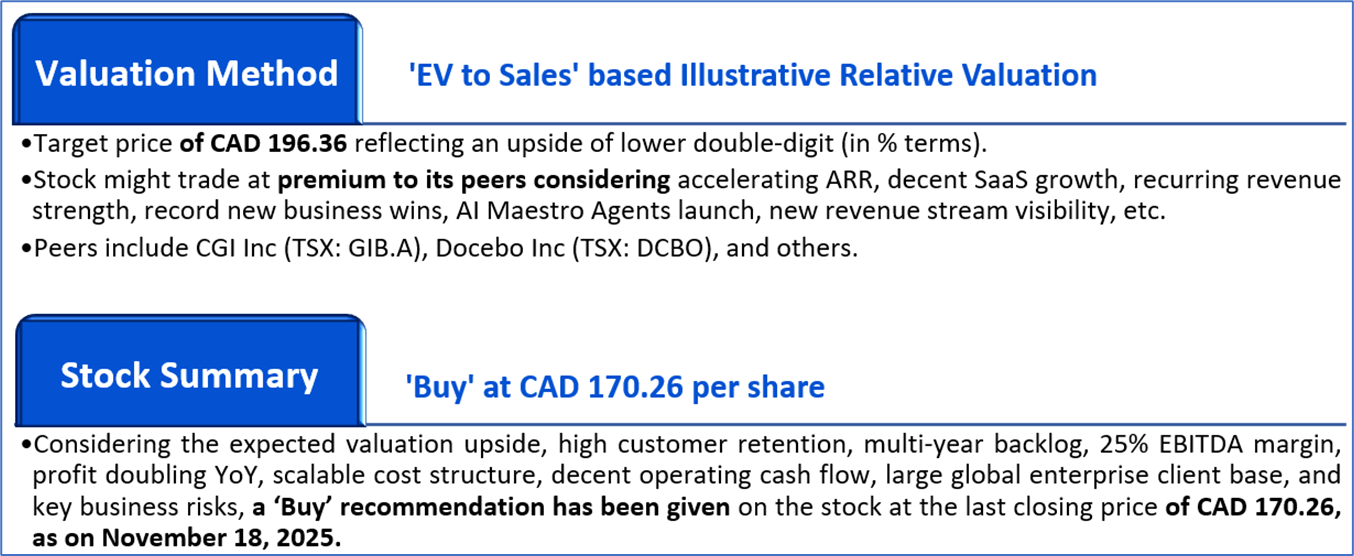
Section 4: Stock Recommendation Summary

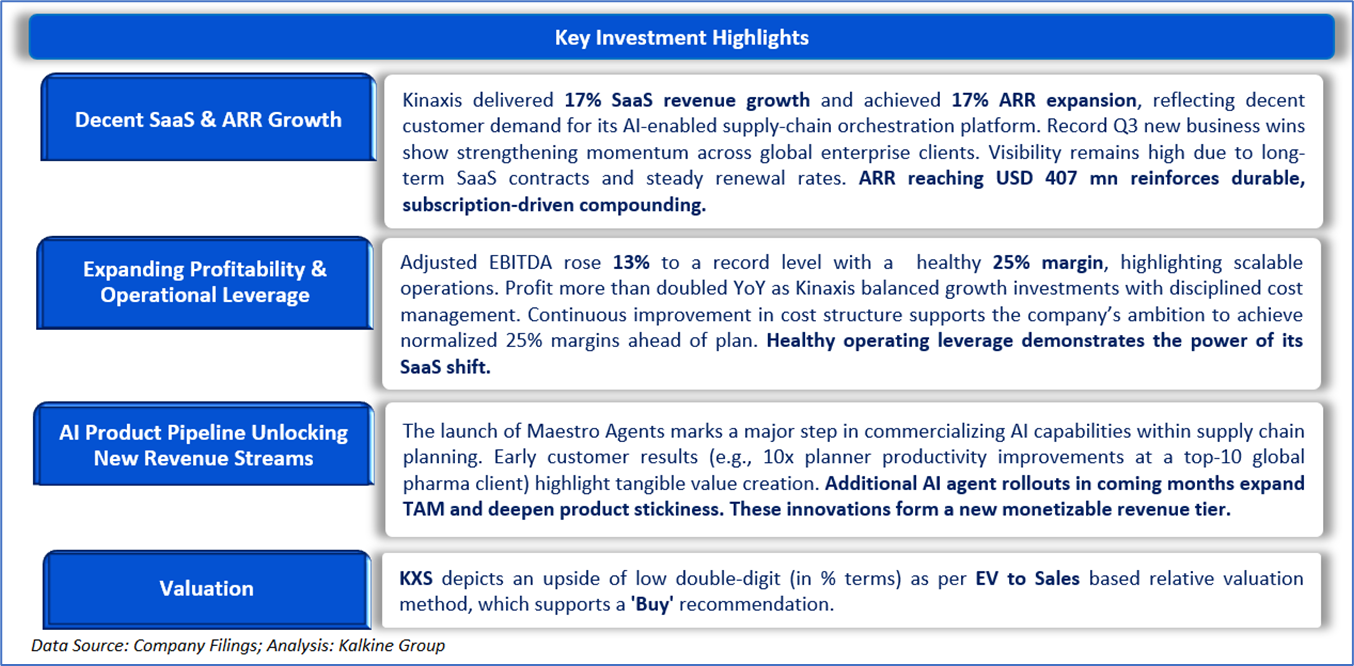
Valuation Methodology: EV to Sales Multiple Based Relative Valuation (Illustrative):


The stock has witnessed a downside of ~2.68% and ~13.30% over the last 1 week and 3 months respectively. Moreover, it is trading below the average 52-week high price of CAD 212.45 and 52-week low price of CAD 149.96, providing an opportunity to accumulate the stock.

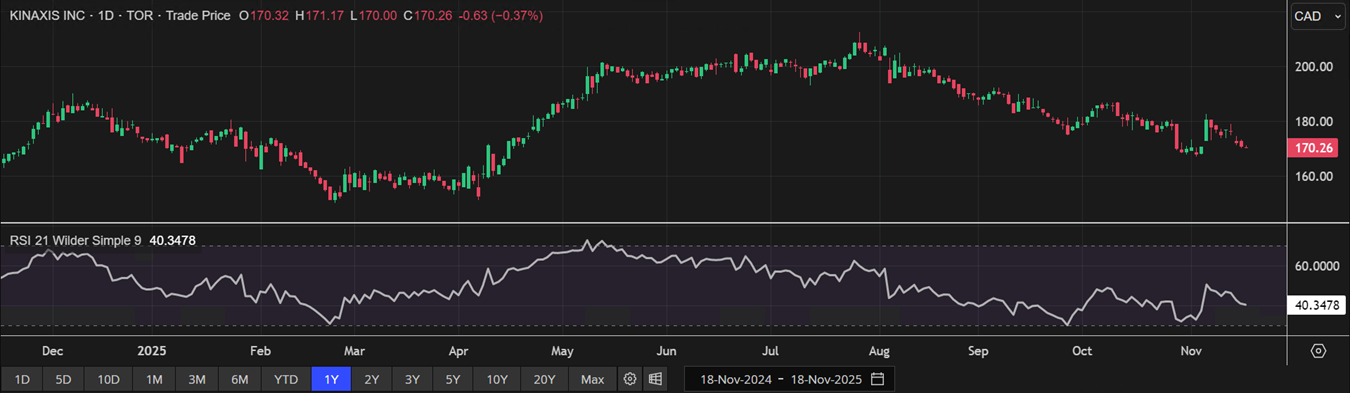
One-Year Technical Price Chart (as of November 18, 2025). Source: REFINITIV, Analysis: Kalkine Group

Sangoma Technologies Corp.
Section1: Company Overview

Sangoma Technologies Corp. (TSX: STC) is a provider of hardware and software components that enable Internet protocol communications systems for both telecom and datacom applications. It is engaged in the development, manufacturing, distribution, and support of voice and data connectivity components for software-based communication applications. Its products include Cloud Services, Video Conferencing, Carrier Services, Business Phone Systems, Phones & Devices, and Network Connectivity. The company sells into three major geographic centers: the United States of America, which is the key revenue driver, Canada, and other foreign countries.
This “Artificial Intelligence and Emerging Technologies” report covers the Investment Highlights, Key Financial Metrics, Risks, Technical Analysis along with the Valuation, Target Price, and Recommendation on the stock.

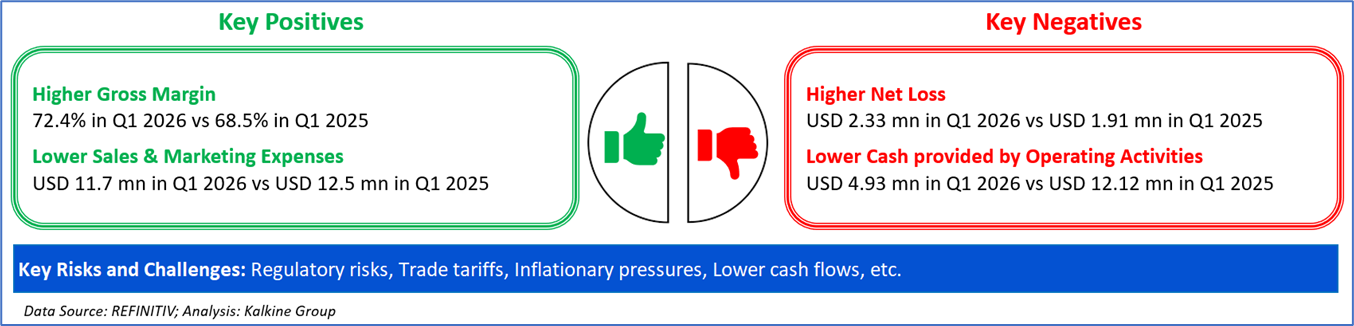
Section2: Financial Highlights

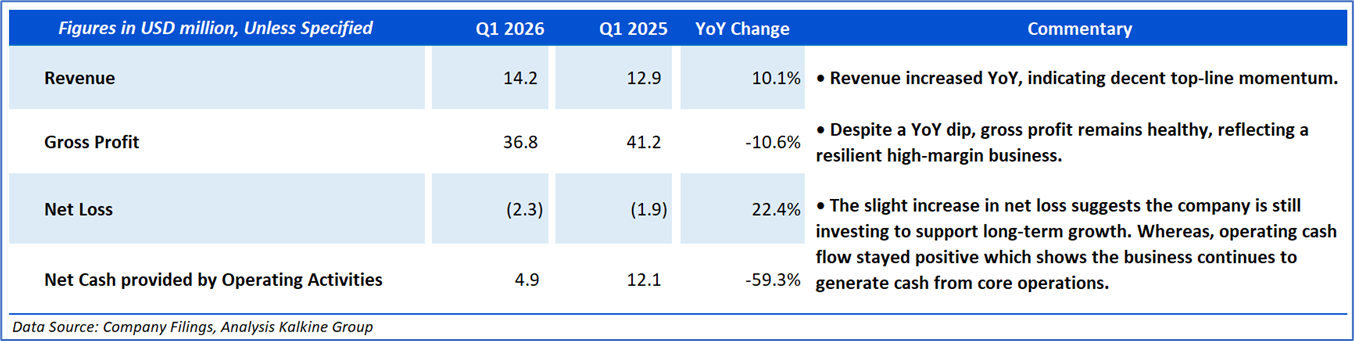
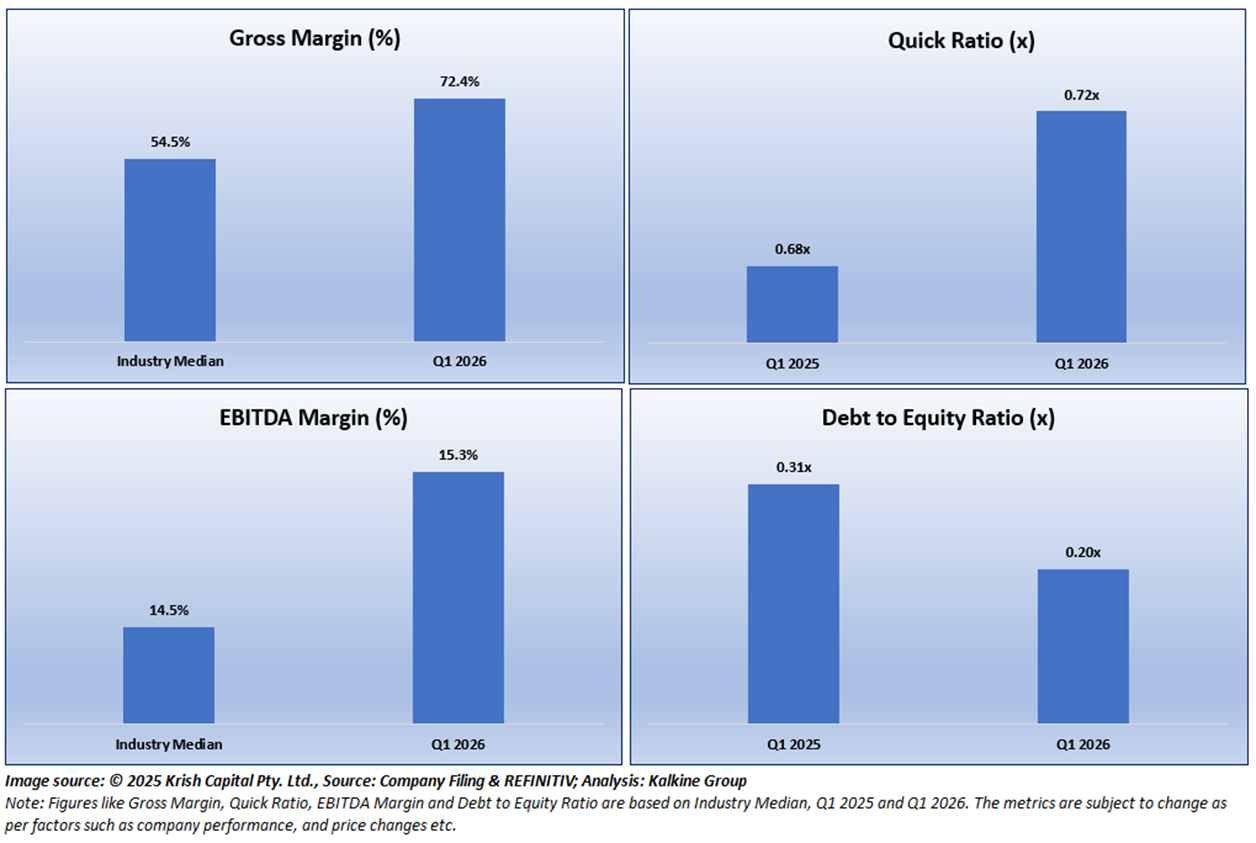
Section 3: Key Metrics
Below charts depict the change in Gross Margin, Quick Ratio, EBITDA Margin and Debt to Equity Ratio are based on Industry Median, Q1 2025 and Q1 2026.
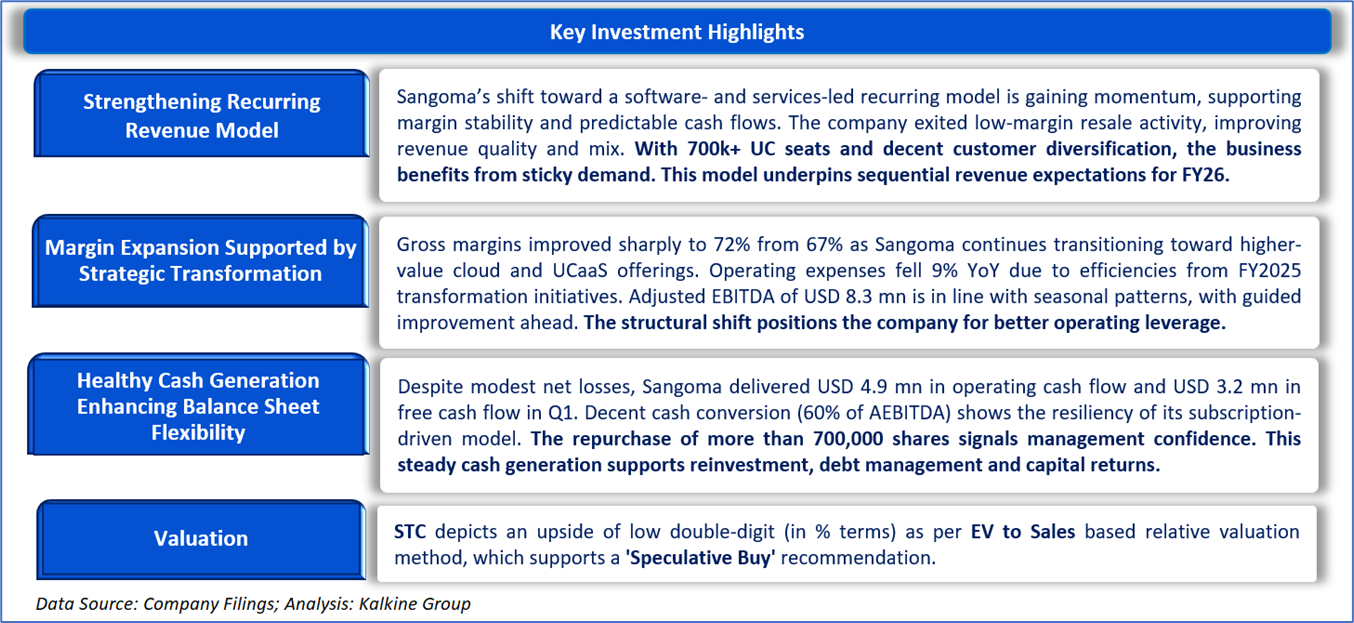
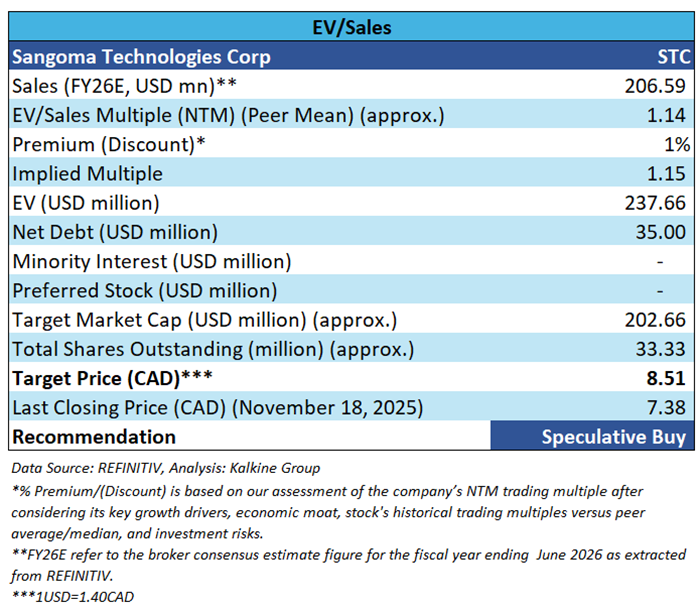
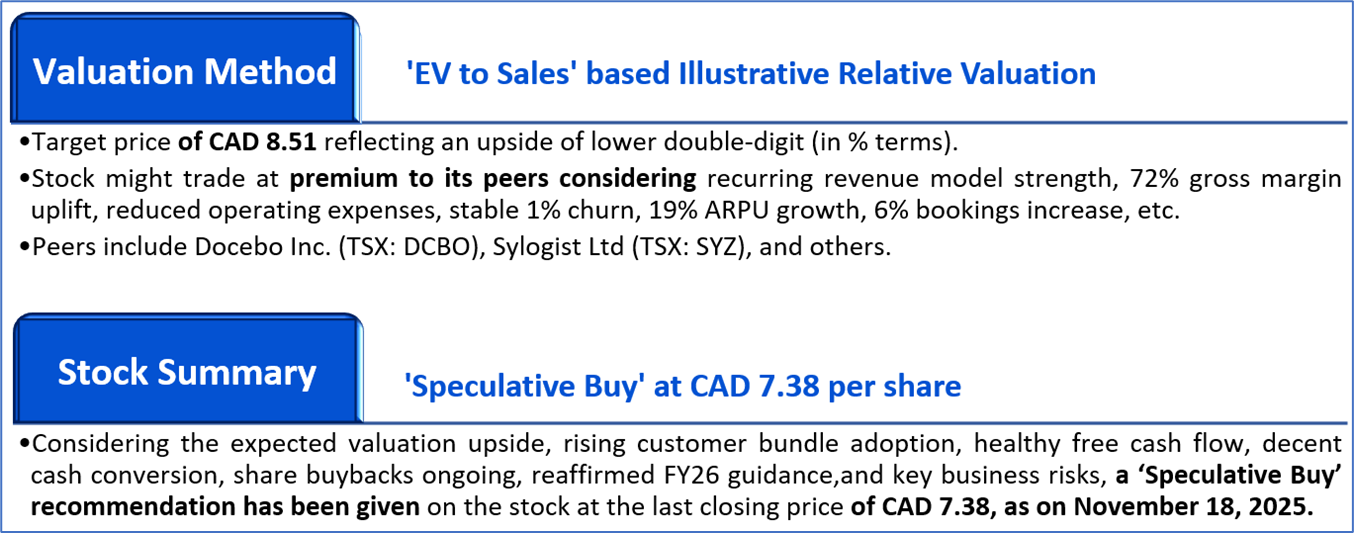
Section 4: Stock Recommendation Summary

Valuation Methodology: EV to Sales Based Relative Valuation (Illustrative):


The stock has witnessed an upside of ~0.81% and ~9.49% over the last 1 week and 1 month respectively. Moreover, it is trading above the average 52-week high price of CAD 11.50 and 52-week low price of CAD 5.80, providing an opportunity to ride the trend.

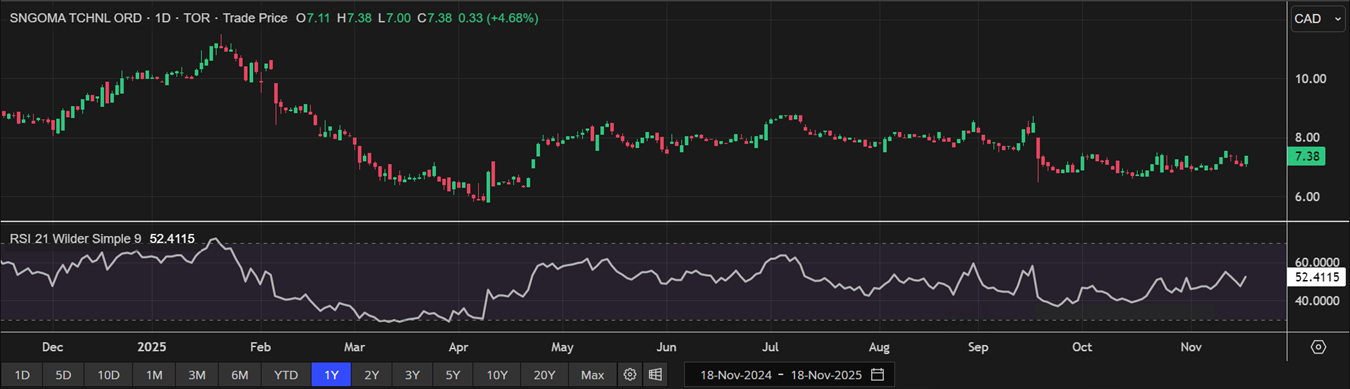
One-Year Technical Price Chart (as of November 18, 2025). Source: REFINITIV, Analysis: Kalkine Group

Markets are trading in a highly volatile zone currently due to certain macroeconomic issues and geopolitical tensions prevailing. Therefore, it is prudent to follow a cautious approach while investing.
Note 1: Past performance is not a reliable indicator of future performance.
Note 2: The reference date for all price data, and currency as of November 18, 2025. The reference data in this report has been partly sourced from REFINITIV.
Note 3: Investment decisions should be made depending on an individual's appetite for upside potential, risks, holding duration, and any previous holdings. An 'Exit' from the stock can be considered if the Target Price mentioned as per the Valuation and or the technical levels provided has been achieved and is subject to the factors discussed above.
Note 4: Dividend Yield may vary as per the stock price movement.
Note 5: Kalkine reports are prepared based on the stock prices captured either from REFINITIV or Trading View. Typically, REFINITIV or Trading View may reflect stock prices with a delay which could be a lag of 25-30 minutes. There can be no assurance that future results or events will be consistent with the information provided in the report. The information is subject to change without any prior notice.
Technical Indicators Defined: -
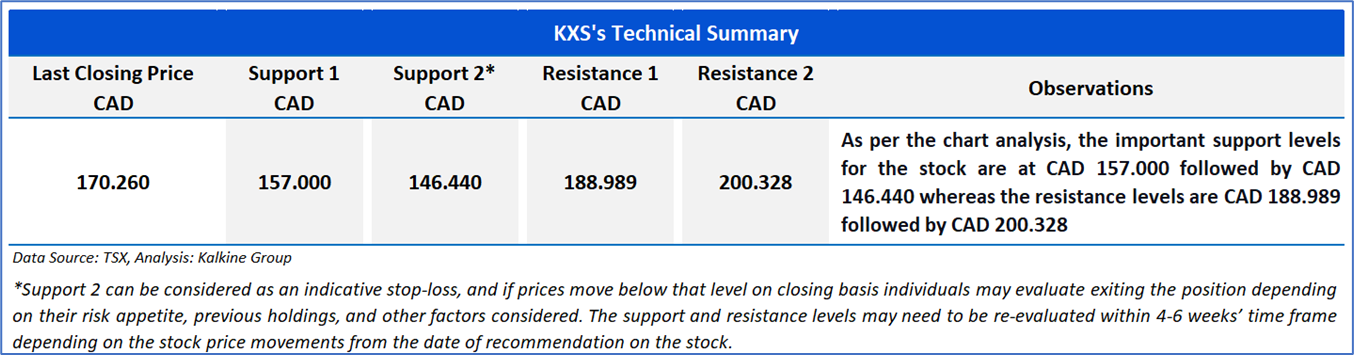
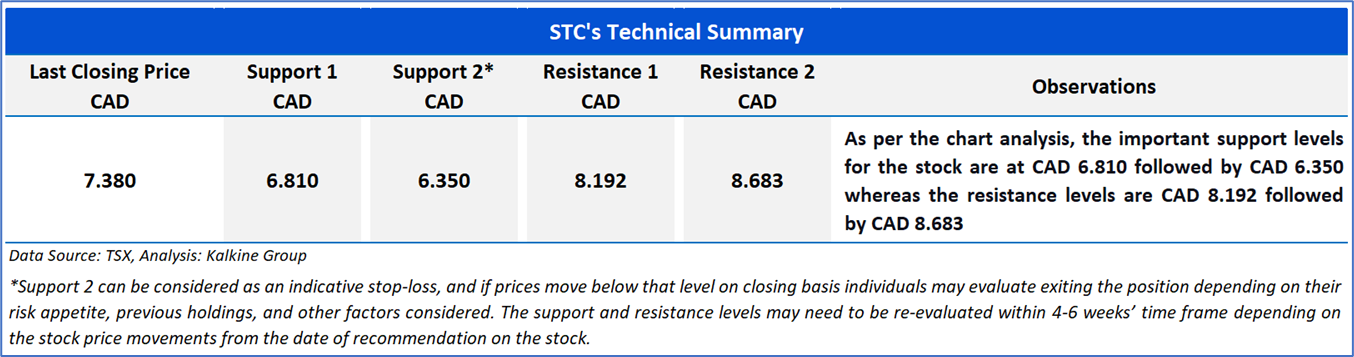
Support: A level at which the stock prices tend to find support if they are falling, and a downtrend may take a pause backed by demand or buying interest.
Resistance: A level at which the stock prices tend to find resistance when they are rising, and the uptrend may take a pause due to profit booking or selling interest.
Stop-loss: In general, it is a level to protect further losses in case of any unfavourable movement in the stock prices.
This report (“Report”) has been issued by Kalkine New Zealand Limited (FSP691351) (NZBN:9429047678101) (“Kalkine”). Kalkine is a Financial Advice Provider (“FAP”) and is authorised by a Class 1 Financial Advice Provider Licence issued by Financial Markets Authority (“FMA”) to provide financial advice. Kalkine provides only general financial advice through its research reports following a person becoming a member. The reports contain buy/sell/hold and other recommendations in relation to equity securities, managed funds and other managed investment schemes and other financial advice products. The recommendations and opinions in this Report and on Kalkine website do not take into account any of your investment objectives, financial situation or needs. Before you make a decision about whether to acquire a financial product, you should obtain the Product Disclosure Statement from the product issuer. You should consider the appropriateness of advice taking into account your own objectives, financial situation and needs and seek independent financial advice before making any financial decisions. If you act on the advice in the research reports, you may have to pay fees, expenses or other amounts (but not to Kalkine).
The information in this Report and on the Kalkine website has been prepared from a wide variety of sources, which Kalkine, to the best of its knowledge and belief, considers accurate. Kalkine has made every effort to ensure the reliability of the information contained in its reports (including this Report), newsletters and websites. All information represents our views at the date of publication and may change without notice.
Kalkine does not issue, sell or deal in any financial products. The information in this Report does not constitute an offer to sell securities or other financial products or a solicitation of an offer to buy securities or other financial products. Our reports contain general recommendations to invest in securities and other financial products. Kalkine is not responsible for, and does not guarantee, the performance of, or returns on, any investments mentioned in this Report.
This Report may contain information on past performance of particular investments. Past performance is not a reliable indicator of future performance. Returns stated do not take into account transaction costs and taxes.
Further information about the complaints and dispute resolution process, as well as information about Kalkine’s duties are available on Kalkine’s website. Please read our Financial Advice Provider (FAP) disclosure statement and Complaints Handling Guide, which are available on the website.
Copyright 2025 Krish Capital Pty. Ltd. (ABN 61629651510). All Rights Reserved. No part of this Report, or its content, may be reproduced in any form without our prior consent.
Past performance is not a reliable indicator of future performance.
 Please wait processing your request...