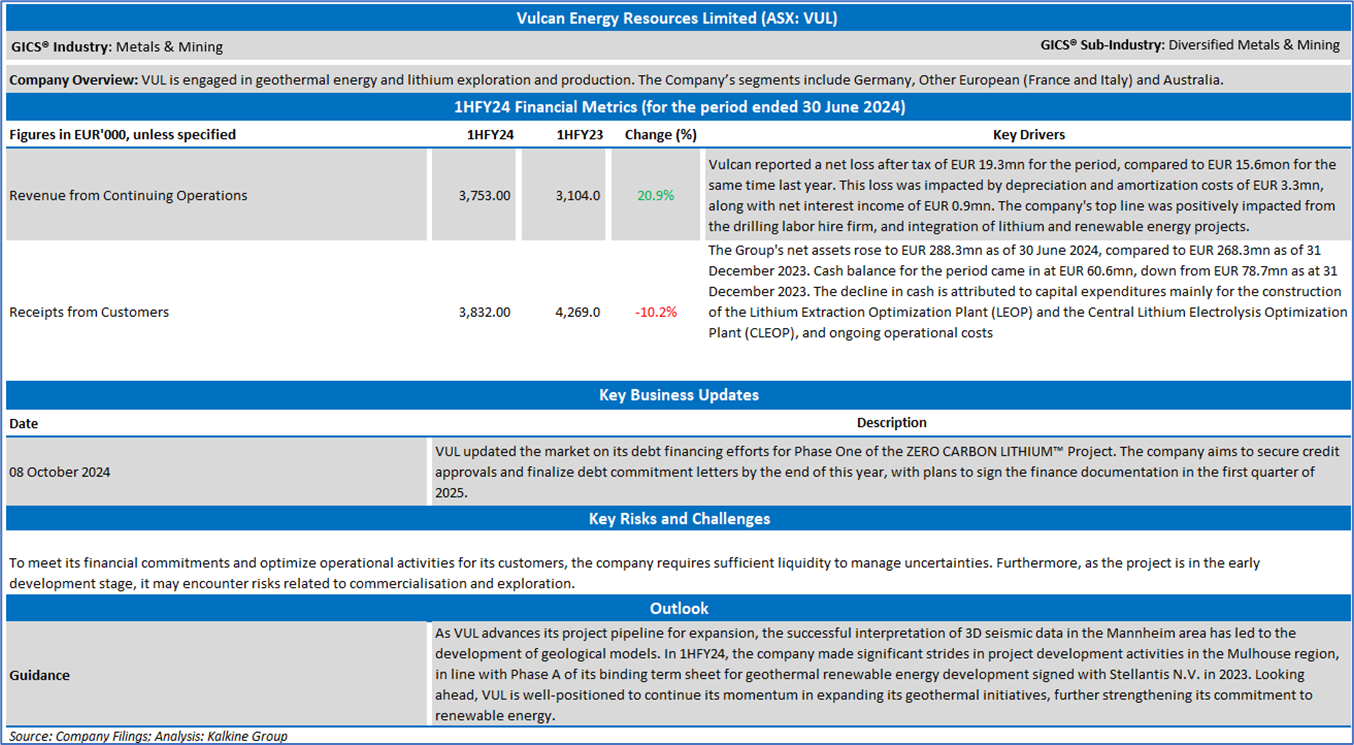
Company Overview: Vulcan Energy Resources Limited (ASX: VUL) is engaged in geothermal energy and lithium exploration and production, with segments in Germany, other European countries (France and Italy) and Australia. Helloworld Travel Limited (ASX: HLO) is involved in the sale of international and domestic travel products and services, operation of retail distribution networks for travel agents and specialised freight operations. Kalkine’s Inflation Report covers the Investment Highlights, Key Financial Metrics, Risks, Outlook, Technical Analysis along with the Valuation, Target Price, and Recommendation on these two stocks.
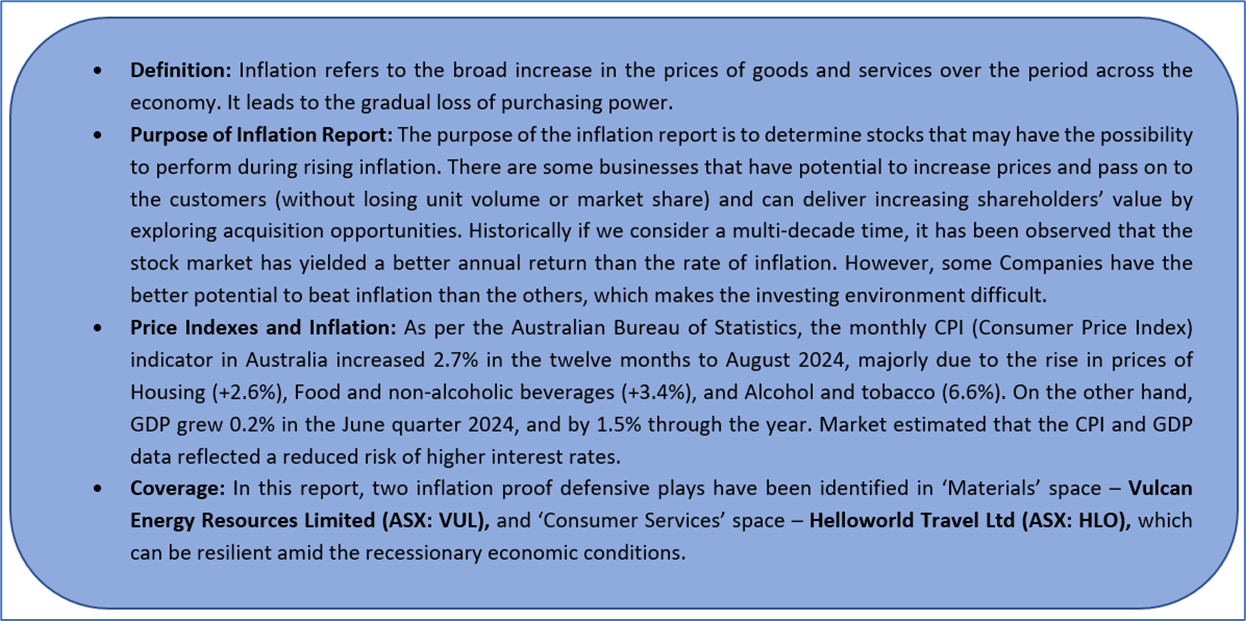
Section 1: Introduction
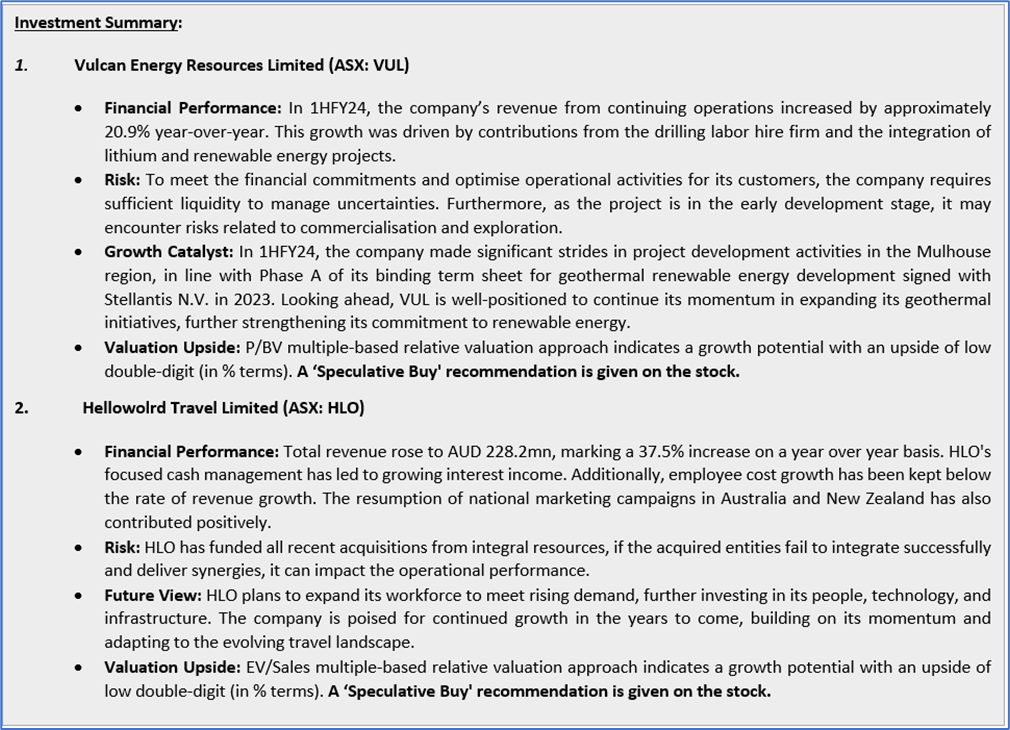
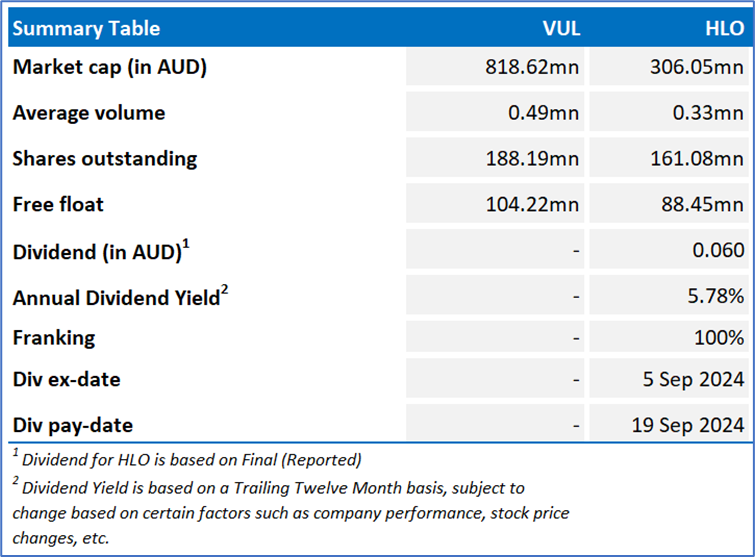
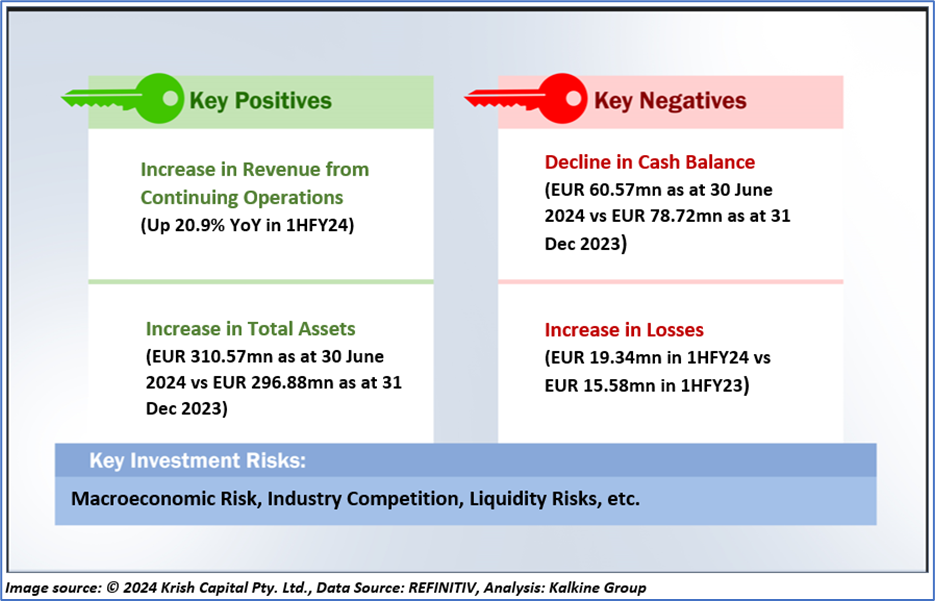
Section 2: Investment Highlights & Summary Table
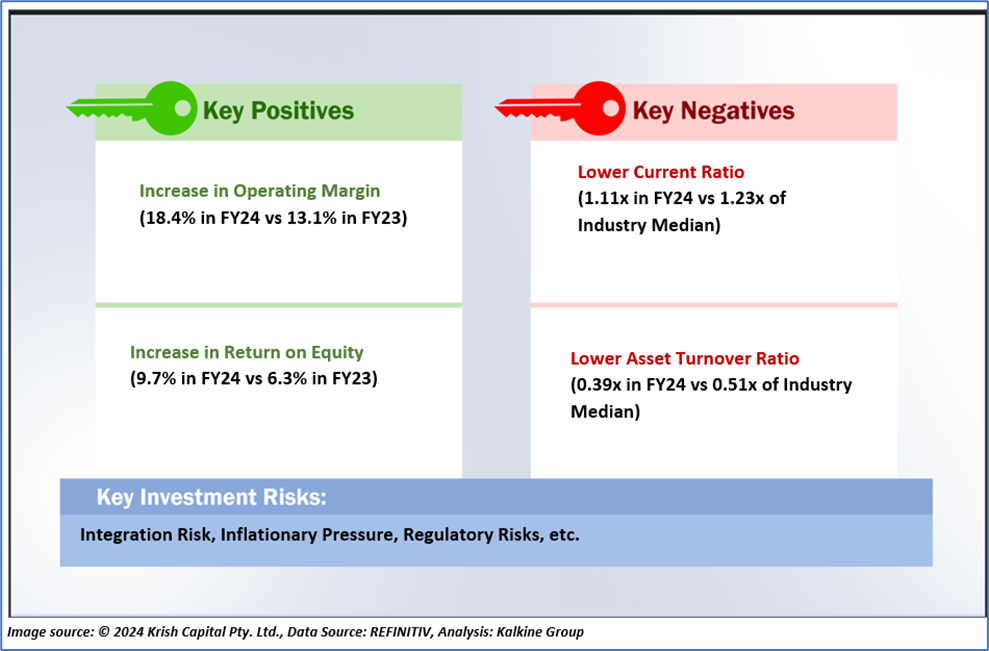
Section 3.0: Key Metrics in Pictures
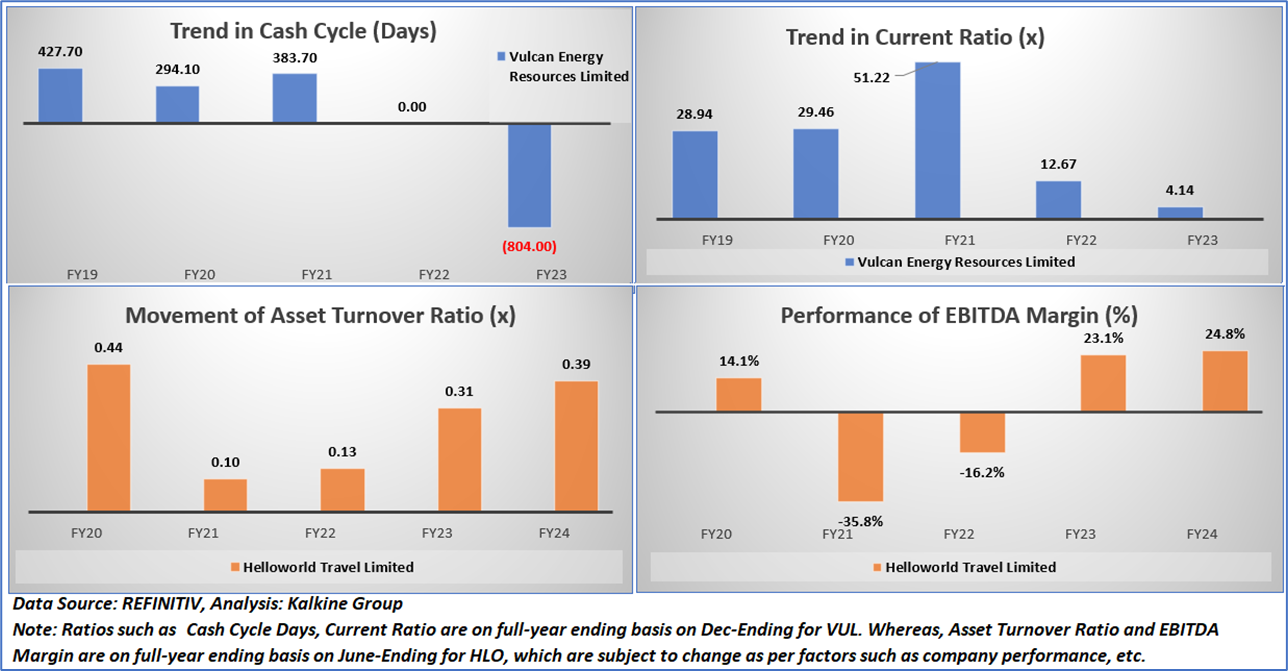
Having looked at the key financial ratios above, the below sections provide an in-depth fundamental, and technical analysis on these two ASX-listed stocks along with respective recommendations, technical support and resistance levels and indicative stop-loss.
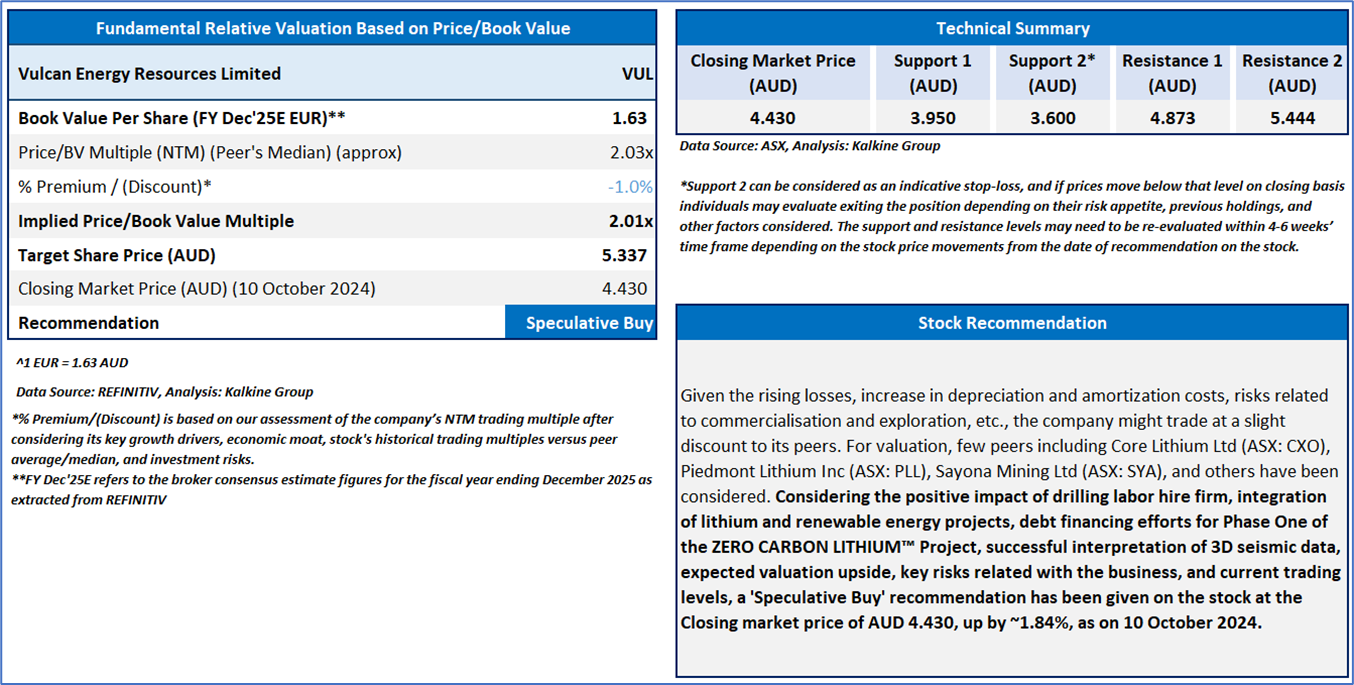
Section 4: Vulcan Energy Resources Limited (ASX: VUL) (‘Speculative Buy’ at AUD 4.430, closing market price as on 10 October 2024)
4.1 Company Details, Business Updates, Key Risks & Outlook
Section 5: Valuation and Recommendation Summary
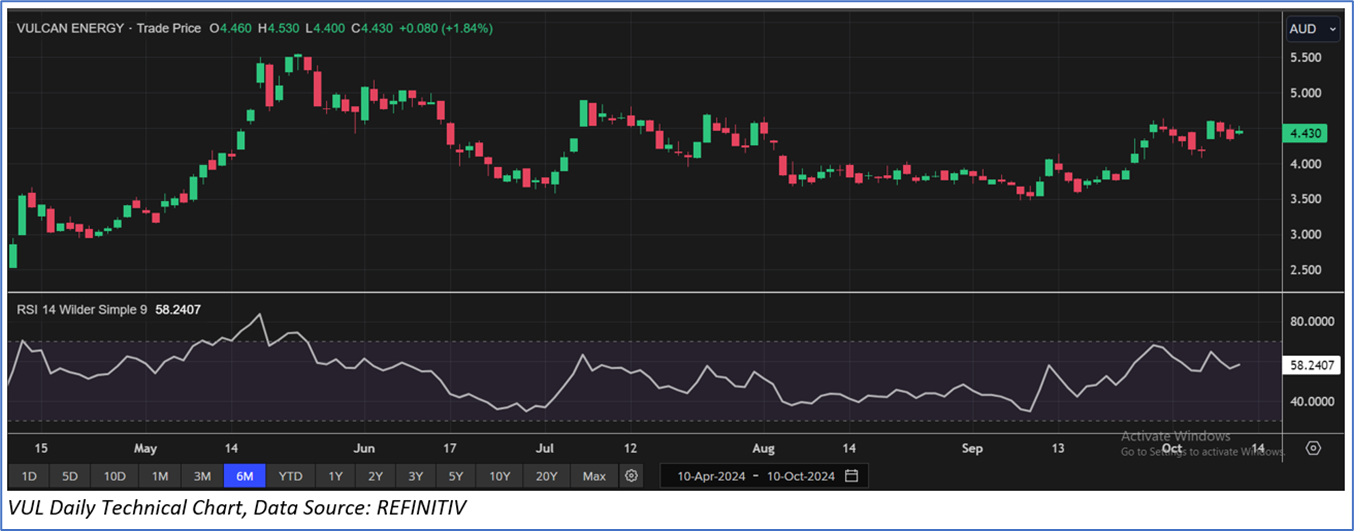
The stock has witnessed a decline of ~4.7% in the last three months, whereas over the last six months, it has increased by ~24.8%. The stock has a 52-week low and 52-week high of AUD 1.950 and AUD 5.550, respectively, and is currently trading above the average of 52-week high-low average. VUL was last covered in a report dated '5 July 2024'.
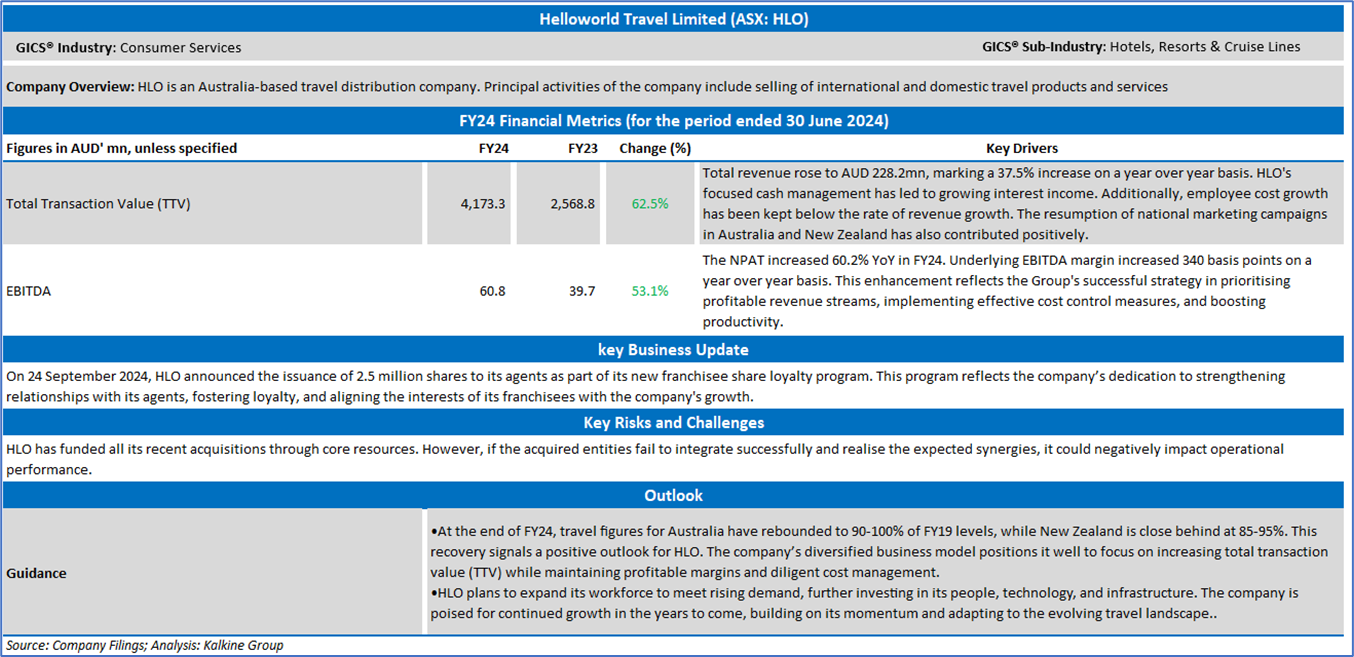
Section 6: Helloworld Travel Limited (ASX: HLO) (Speculative Buy’ at AUD 1.92, closing market price per share as on 10 October 2024
6.1 Company Details, Business Updates, Key Risks & Outlook
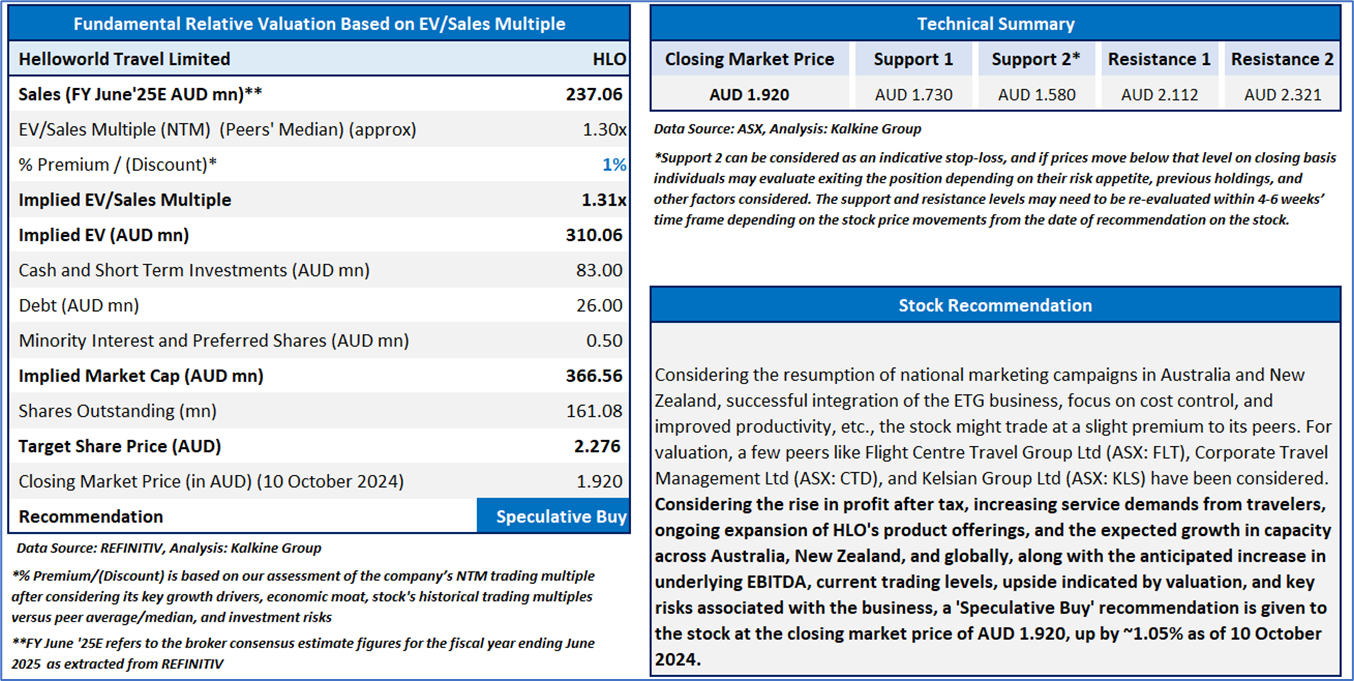
Section 7: Valuation and Recommendation Summary
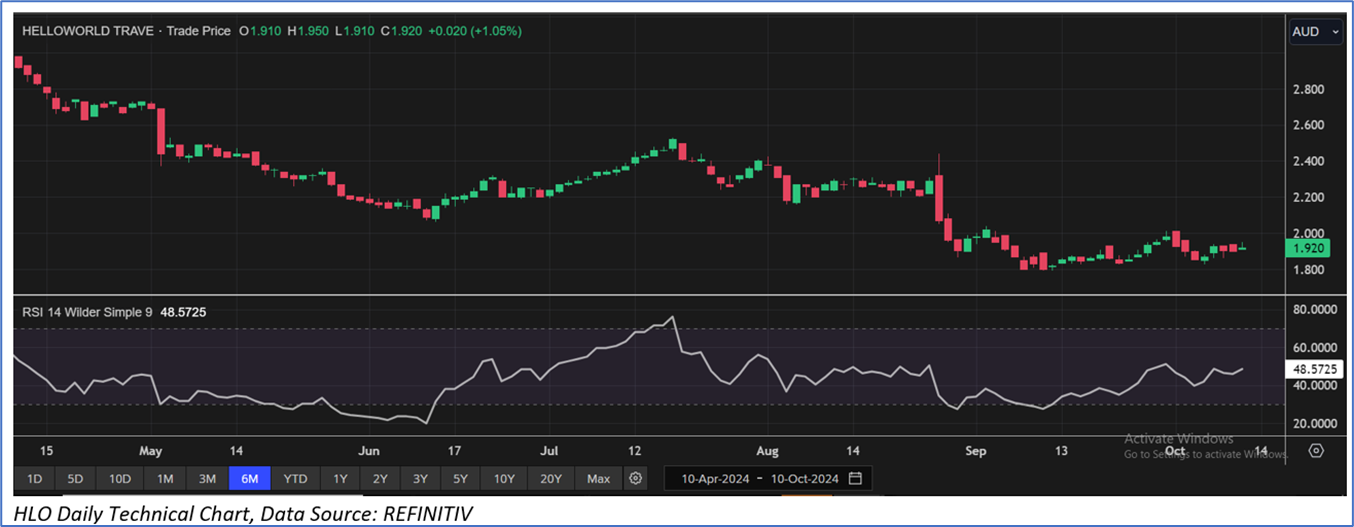
The stock has witnessed a rise of ~18.9% in the last three months, and over the last six months, it has increased by ~17.9%. The stock has a 52-week low and 52-week high of AUD 1.790 and AUD 3.050, respectively, and is currently trading below the average of 52-week high-low average. HLO was last covered in a report dated ’30 August 2024’.
Markets are trading in a highly volatile zone currently due to certain macro-economic issues and geopolitical tensions prevailing. Therefore, it is prudent to follow a cautious approach while investing.
Note 1: Past performance is neither an indicator nor a guarantee of future performance.
Note 2: The reference date for all price data, currency, technical indicators, support, and resistance levels is 10 October 2024. The reference data in this report has been partly sourced from REFINITIV.
Note 3: Investment decisions should be made depending on an individual’s appetite for upside potential, risks, holding duration, and any previous holdings. An ‘Exit’ from the stock can be considered if the Target Price mentioned as per the Valuation and or the technical levels provided have been achieved and is subject to the factors discussed above.
Note 4: Dividend Yield may vary as per the stock price movement.
Technical Indicators Defined: -
Support: A level at which the stock prices tend to find support if they are falling, and a downtrend may take a pause backed by demand or buying interest. Support 1 refers to the nearby support level for the stock and if the price breaches the level, then Support 2 may act as the crucial support level for the stock.
Resistance: A level at which the stock prices tend to find resistance when they are rising, and an uptrend may take a pause due to profit booking or selling interest. Resistance 1 refers to the nearby resistance level for the stock and if the price surpasses the level, then Resistance 2 may act as the crucial resistance level for the stock.
Stop-loss: It is a level to protect further losses in case of unfavourable movement in the stock prices.
Past performance is not a reliable indicator of future performance.

 Please wait processing your request...