Section 1: Company Overview, Low Carbon Emission Initiatives and Fundamentals
Section 1.1: Company Overview:
Kelt Exploration Ltd (TSX: KEL) is an oil and gas company that focuses on the exploration, development, and production of crude oil and natural gas in Canada. The company owns pipeline infrastructure in some of its core regions to help move its products to domestic markets. Product offerings for the energy firm consist of crude oil, natural gas liquids, and natural gas, with most of the revenue delivered by oil production.
Kalkine’s Low Carbon Research Report covers the Investment Highlights, Low Carbon Emission Initiatives, Key Financial Metrics, Risks, and Technical Analysis along with the Valuation, Target Price, and Recommendation on the stock.
Section 1.2: Why Low Carbon Emission Matters?
The shift toward a low-carbon economy is one of the most significant challenges of current time, spurred by the urgent need to combat climate change and reduce the environmental impact of corporate activities. This report covers TSX-listed low-carbon emission company (TSX: KEL), that is committed to sustainability and responsible environmental practices.
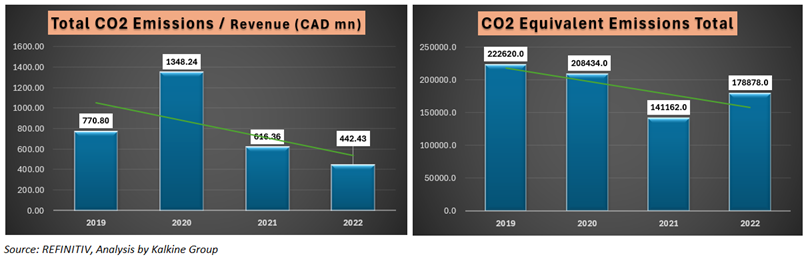
Carbon and Waste Management - Key Metrics
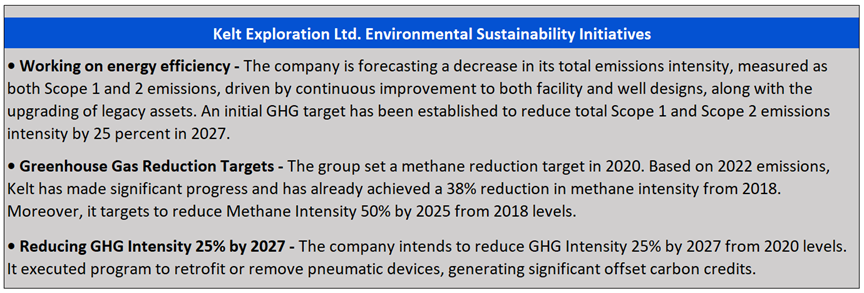
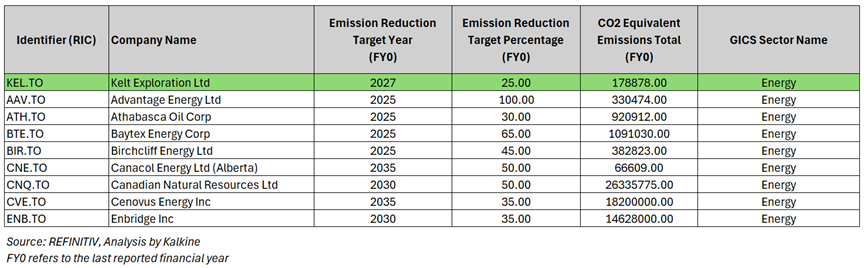
Kelt Exploration Ltd sustained environmental efforts have translated to improved CO2 emission since 2019, aligning with its net zero emissions goal.
Peer Comparison: Carbon Emission Metrics
KEL's lower CO2 emission positions the company well compared to peers in the industry.
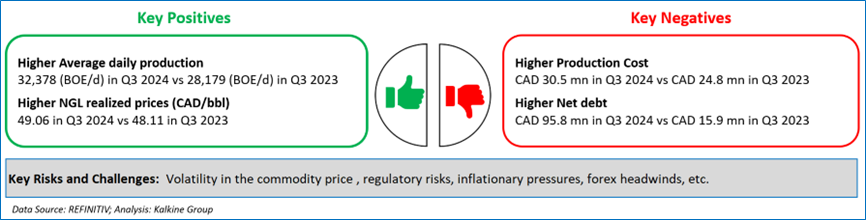
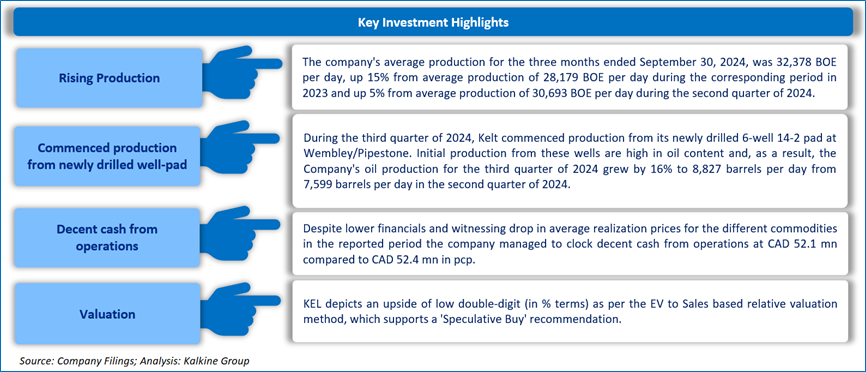
1.3 The Key Positives, Negatives, Investment Highlights and Risks
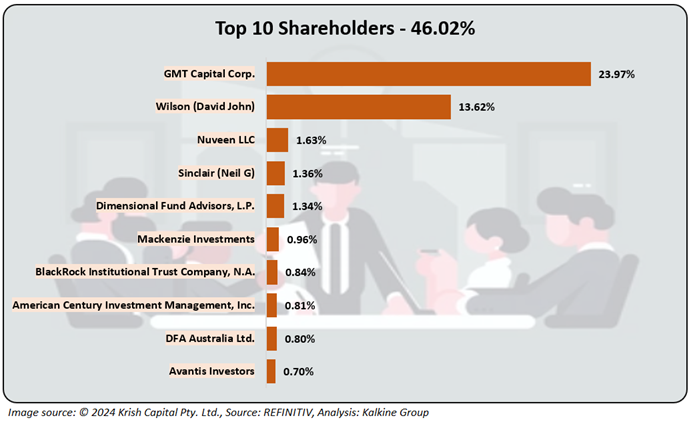
1.4 Top 10 Shareholders:
The top 10 shareholders together form ~46.02% of the total shareholding. GMT Capital Corp. and Wilson (David John) hold a maximum stake in the company at ~23.97% and ~13.62%, respectively.
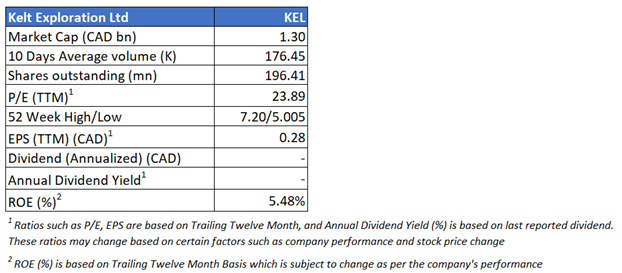
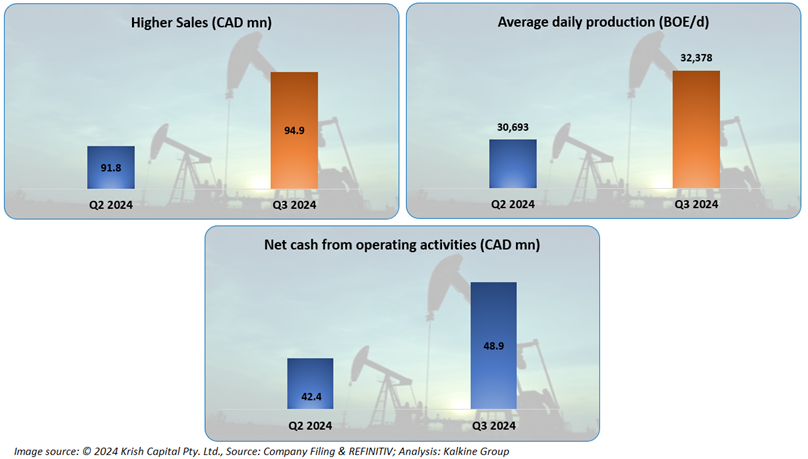
1.5 Key Metrics:
The company reported a decent rise in its sales and average production numbers in Q3 2024, compared to Q2 2024, which is a key positive. Furthermore, the group posted elevated net cash from operating activities again rising on a sequential basis.
Section 2: Business Updates and Financial Highlights
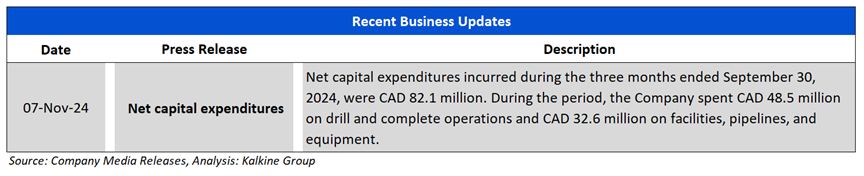
2.1 Recent Updates: The below picture gives an overview of the company’s recent activities, here the company shares information on its net capital expenditure.
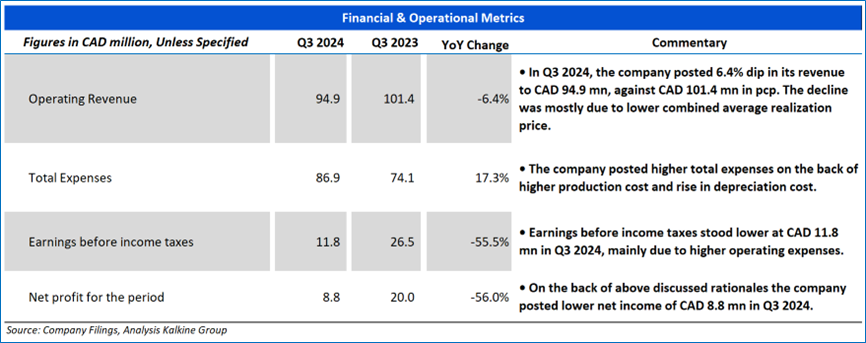
2.2 Insights on Q3 2024 Financial Performance:
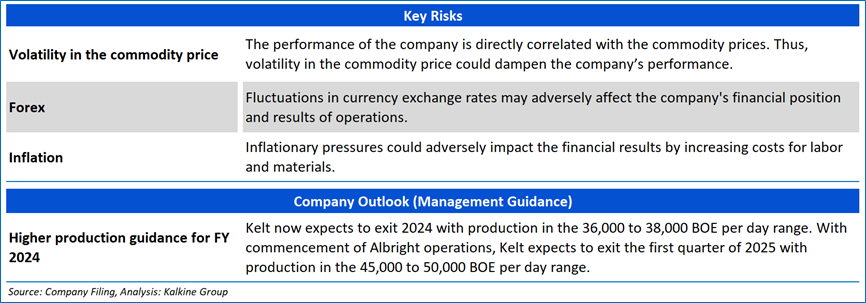
Section 3: Key Risks, Company Outlook:
Section 4: Stock Recommendation Summary:

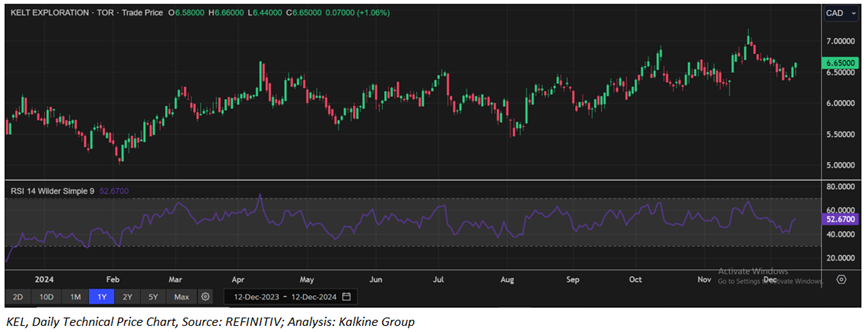
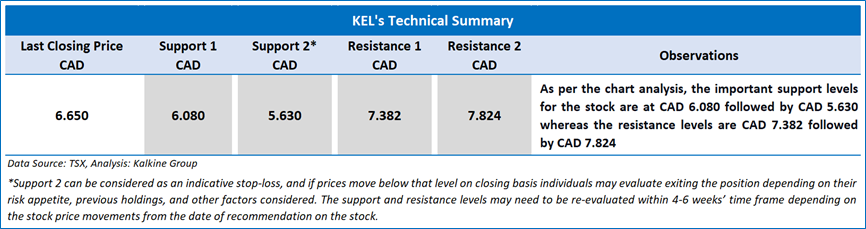
4.1 Price Performance and Technical Summary:
The stock has witnessed an upside of ~1.52% and ~5.38% over the last 1 week and 1 month respectively. Moreover, the stock is trading above the average 52-week high price of CAD 7.20 and 52-week low price of CAD 5.005 providing an opportunity to ride the trend.
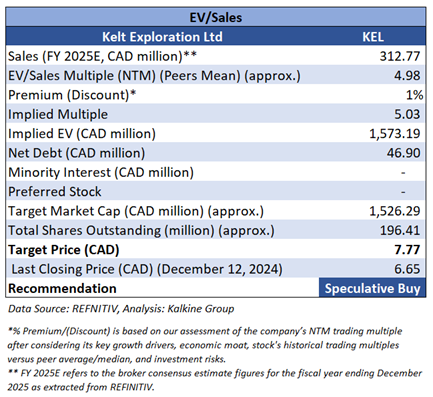
4.2 Fundamental Valuation
Valuation Methodology: EV/Sales Multiple Based Relative Valuation (Illustrative)
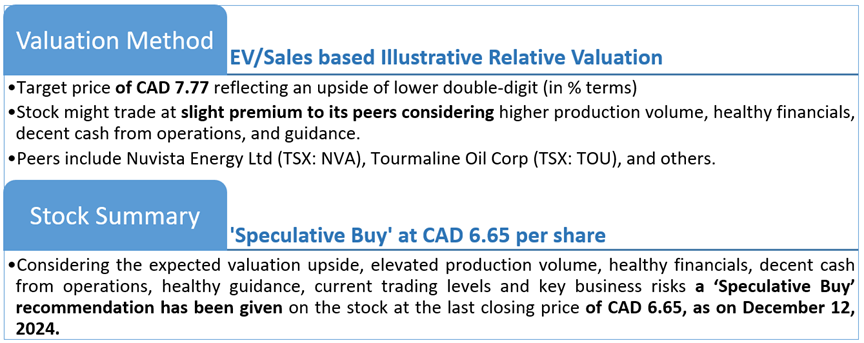
Markets are trading in a highly volatile zone currently due to certain macroeconomic issues and geopolitical tensions prevailing. Therefore, it is prudent to follow a cautious approach while investing.
Note 1: Past performance is not a reliable indicator of future performance.
Note 2: The reference date for all price data, currency, technical indicators, support, and resistance levels is December 12, 2024. The reference data in this report has been partly sourced from REFINITIV.
Note 3: Investment decisions should be made depending on an individual's appetite for upside potential, risks, holding duration, and any previous holdings. An 'Exit' from the stock can be considered if the Target Price mentioned as per the Valuation and or the technical levels provided has been achieved and is subject to the factors discussed above.
Note 4: Dividend Yield may vary as per the stock price movement.
Technical Indicators Defined: -
Support: A level at which the stock prices tend to find support if they are falling, and a downtrend may take a pause backed by demand or buying interest. Support 1 refers to the nearby support level for the stock and if the price breaches the level, then Support 2 may act as the crucial support level for the stock.
Resistance: A level at which the stock prices tend to find resistance when they are rising, and an uptrend may take a pause due to profit booking or selling interest. Resistance 1 refers to the nearby resistance level for the stock and if the price surpasses the level, then Resistance 2 may act as the crucial resistance level for the stock.
Stop-loss: It is a level to protect further losses in case of unfavourable movement in the stock prices.
Kalkine reports are prepared based on the stock prices captured either from REFINITIV or Trading View. Typically, REFINITIV or Trading View may reflect stock prices with a delay which could be a lag of 25-30 minutes. There can be no assurance that future results or events will be consistent with the information provided in the report. The information is subject to change without any prior notice.
Disclaimer This report has been issued by Kalkine New Zealand Limited (FSP691351) (NZBN:9429047678101) (“Kalkine”). Kalkine is a Financial Advice Provider (“FAP”) and is authorised by a Class 1 Financial Advice Provider Licence issued by Financial Markets Authority (“FMA”) to provide financial advice. Kalkine provides only general financial advice through its research reports following a person becoming a member. The reports contain buy/sell/hold and other recommendations in relation to equity securities, managed funds and other managed investment schemes and other financial advice products. The recommendations and opinions in this report and on Kalkine website do not take into account any of your investment objectives, financial situation or needs. Before you make a decision about whether to acquire a financial product, you should obtain the Product Disclosure Statement from the product issuer. You should consider the appropriateness of advice taking into account your own objectives, financial situation and needs and seek independent financial advice before making any financial decisions. If you act on the advice in the research reports, you may have to pay fees, expenses or other amounts (but not to Kalkine). Further information about the complaints and dispute resolution process, as well as information about Kalkine’s duties are available on Kalkine’s website. Please read our Financial Advice Provider (FAP) disclosure statement and Complaints Handling Guide, which are available on the website.
Past performance is not a reliable indicator of future performance.
 Please wait processing your request...