
This report is an updated version of the report published on 9 September 2024 at 1:42 PM AEST.
Company Overview: Macquarie Technology Group Limited (ASX: MAQ) is an Australian data centre, cloud, cyber security, and telecom service provider. The ASX-listed company caters to mid-to-large business and government customers. Superloop Limited (ASX: SLC) is an Australia-based telecommunications company. The Company operates through three segments: Wholesale, Business and Consumer. Kalkine’s Market Event Report covers the Investment Summary, Event Summary, Data Insights & Analysis, Key Financial Metrics, Risks, Outlook, Technical Analysis along with the Valuation, Target Price, and Recommendation on the stock.
Investment Summary
Event Highlights
Data Insights and Analysis
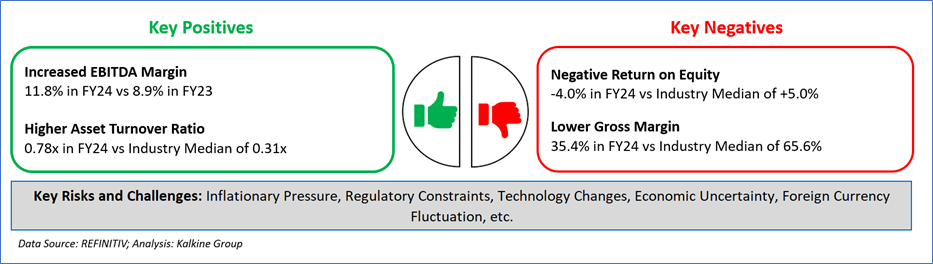
Key Drivers versus Key Challenges

Based on the above data, two ASX stocks have been identified to showcase the momentum.
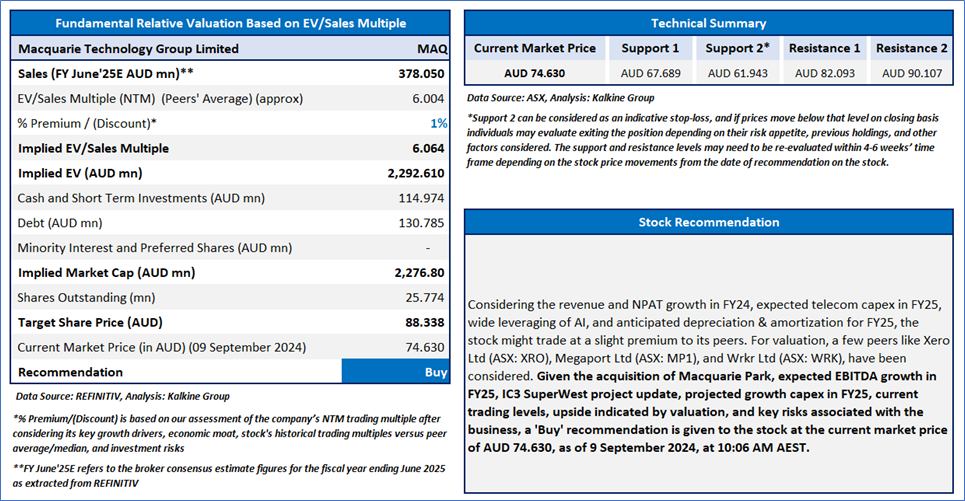
1) Macquarie Technology Group Limited (ASX: MAQ) (Recommendation: ‘Buy’ at AUD 74.630, Potential Upside: Low Double-Digit) (M-cap: AUD 1.97bn)
Company Overview: MAQ is an Australian data centre, cloud, cyber security, and telecom service provider. The ASX-listed company caters to mid-to-large business and government customers.

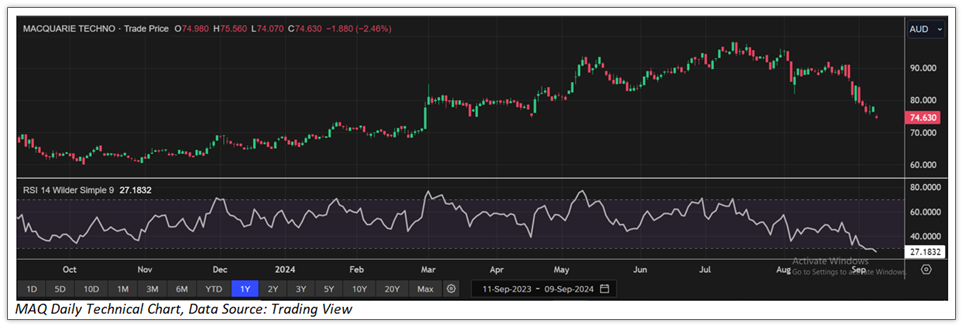
The stock has witnessed a correction of ~13.75% in last one month, and over the last three months, it decreased by ~11.03%. The stock has a 52-week low and 52-week high of AUD 60.110 and AUD 98.350, respectively, and is currently trading below the 52-week high-low average. MAQ was last covered in a report dated ‘12 August 2024’.
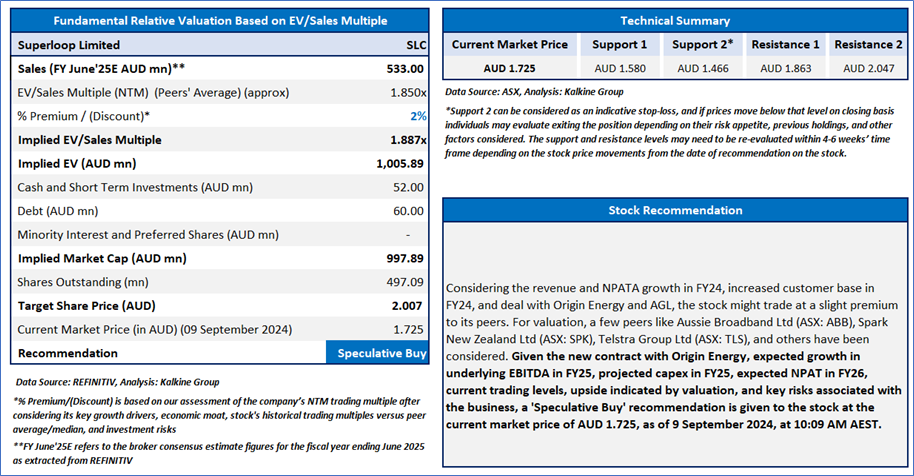
2) Superloop Limited (ASX: SLC) (Recommendation: ‘Speculative Buy’ at AUD 1.725, Potential Upside: Low Double-Digit) (M-cap: AUD 864.98mn)
Company Overview: SLC is an Australia-based telecommunications company. The Company operates through three segments: Wholesale, Business and Consumer.
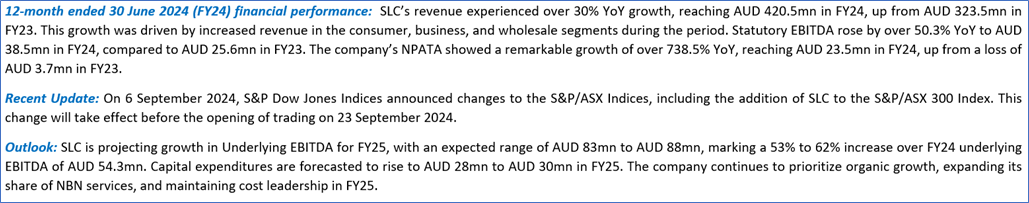
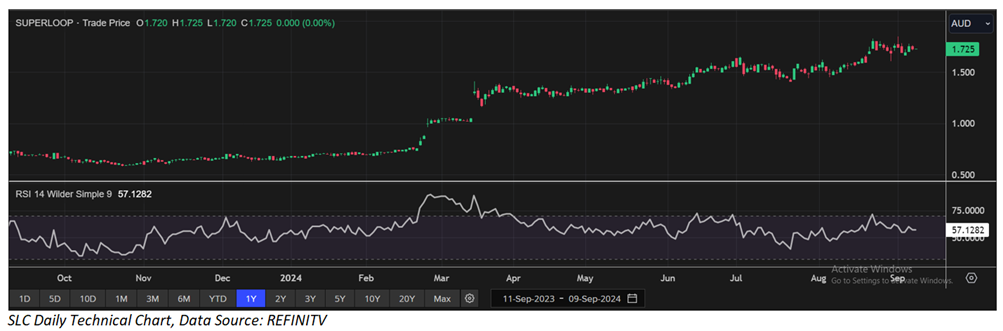
The stock has moved up by ~15.21% in last one month, and over the last three months, it has increased by ~28.52%. The stock has a 52-week low and 52-week high of AUD 0.580 and AUD 1.850, respectively and is currently trading above the 52-week high-low average. SLC was last covered in a report dated ‘14 June 2024’.
Markets are trading in a highly volatile zone currently due to certain macro-economic issues and geopolitical tensions prevailing. Therefore, it is prudent to follow a cautious approach while investing.
Note 1: Past performance is neither an Indicator nor a guarantee of future performance.
Note 2: The reference date for all price data, currency, technical indicators, support, and resistance levels is 9 September 2024. The reference data in this report has been partly sourced from REFINITIV.
Note 3: Investment decisions should be made depending on an individual’s appetite for upside potential, risks, holding duration, and any previous holdings. An ‘Exit’ from the stock can be considered if the Target Price mentioned as per the Valuation and or the technical levels provided has been achieved and is subject to the factors discussed above.
Technical Indicators Defined: -
Support: A level at which the stock prices tend to find support if they are falling, and a downtrend may take a pause backed by demand or buying interest. Support 1 refers to the nearby support level for the stock and if the price breaches the level, then Support 2 may act as the crucial support level for the stock.
Resistance: A level at which the stock prices tend to find resistance when they are rising, and an uptrend may take a pause due to profit booking or selling interest. Resistance 1 refers to the nearby resistance level for the stock and if the price surpasses the level, then Resistance 2 may act as the crucial resistance level for the stock.
Stop-loss: It is a level to protect further losses in case of unfavourable movement in the stock prices.
Disclaimer This report has been issued by Kalkine New Zealand Limited (FSP691351) (NZBN:9429047678101) (“Kalkine”). Kalkine is a Financial Advice Provider (“FAP”) and is authorised by a Class 1 Financial Advice Provider Licence issued by Financial Markets Authority (“FMA”) to provide financial advice. Kalkine provides only general financial advice through its research reports following a person becoming a member. The reports contain buy/sell/hold and other recommendations in relation to equity securities, managed funds and other managed investment schemes and other financial advice products. The recommendations and opinions in this report and on Kalkine website do not take into account any of your investment objectives, financial situation or needs. Before you make a decision about whether to acquire a financial product, you should obtain the Product Disclosure Statement from the product issuer. You should consider the appropriateness of advice taking into account your own objectives, financial situation and needs and seek independent financial advice before making any financial decisions. If you act on the advice in the research reports, you may have to pay fees, expenses or other amounts (but not to Kalkine). Further information about the complaints and dispute resolution process, as well as information about Kalkine’s duties are available on Kalkine’s website. Please read our Financial Advice Provider (FAP) disclosure statement and Complaints Handling Guide, which are available on the website.
Past performance is not a reliable indicator of future performance.
 Please wait processing your request...