
.png)
I. Sector Landscape and Outlook
As per the Ministry of Business, Innovation and Employment (MBIE), the energy intensity bettered in the calendar year 2020. It fell 4.6% (A fall in the indicator is considered an improvement) in 2020. Further, the seasonally adjusted greenhouse gas (GHG) emissions from industries and households decreased by 11% in the September 2021 quarter, following a 4.7% rise in the June 2021 quarter. The government forecasts transport energy consumption to rebound by 7.8% in 2021, followed by a growth of 3.8% and 1.3% in 2022 and 2023, respectively.
Significant Jump in Renewable Share in December 2021 Quarter
As per MBIE, the renewable share to net generation grew from 84.3% in December 2020 quarter to 90.7%, up 6.4% YoY, primarily due to a rise in solar generation by 24.8% YoY to 62 GWh in December 2021 quarter from 50 GWh in December 2020. In line with this, wind generation grew by 17.9% YoY to 727 GWh in December 2021 from 617 GWh in December 2020. Hydroelectric generation has played a crucial role in energy systems for over 100 years and contributes to most electricity needs. NZ has over 5,000 MW of installed hydro capacity, primarily in the South Island. Electricity generation from coal, oil, and gas combustion is approximately a quarter of NZ’s electricity generation.
Exhibit 1: Trend in Quarterly Renewable Share Since December 2017 – December 2021
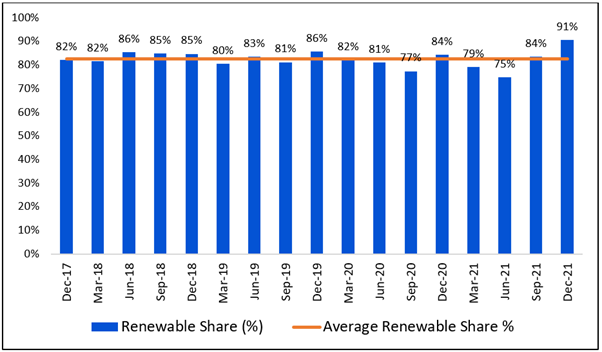
Data Source: This work is owned by the Ministry of Business, Innovation and Employment on behalf of the Crown which are licensed for reuse under the Creative Commons Attribution 4.0 International Licence; Chart Created by Kalkine Group
Housing Utilities Among Top Contributor to Quarterly Inflation
As per Stats.NZ, housing and household utilities were the prime contributors to the 1.4% jump in the CPI in the December 2021 quarter, increasing 2.0%. Transport prices also grew this quarter, up 3.9%, primarily due to higher petrol prices, up 7.7%, and purchase of second-hand motor cars, up 2.7%. The average price for 1 litre of 91 octane petrol stood at $2.45 in the December 2021 quarter, up from $2.27 reported in the September 2021 quarter and $1.87 in the December 2020 quarter. The rise indicates economic revival driven by increased energy consumption by transportation, industries, and households.
Oil Production Rises at Mangahewa and Turangi Locations
As per MBIE, Mangahewa production grew from 0.7 million barrels in 2019 to 1.0 million barrels in 2020, which gradually increased total oil production in 2020. Therefore, Mangahewa now exceeds Maui location, taking third place in total oil production. Similarly, a phenomenal rise in oil production was also seen at Turangi location, which grew by 103% compared to 2019.
As per the provisional date for January 2022, import for crude oil, condensate, and naphtha increased by 94.0% MoM to 437.04 million litres from 225.23 million litres reported in December 2021. The Middle East remains the largest source of NZ’s crude oil import.
Exhibit 2: Indigenous Oil Production in 2020
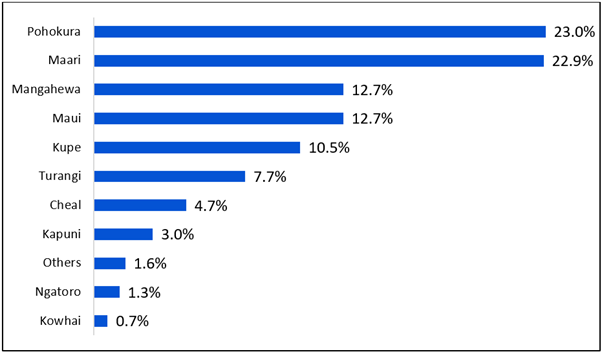
Data Source: This work is owned by the Ministry of Business, Innovation and Employment on behalf of the Crown which are licensed for reuse under the Creative Commons Attribution 4.0 International Licence; Chart Created by Kalkine Group
Index Performance:
The S&P/NZX All Energy (Sector) Index generated a 2-year return of ~27.18% versus ~11.26% by the S&P/NZX 50 Index. Therefore, NZX All Energy Index overperformed NZX50 Index by ~15.92% in 2-year.
Exhibit 3: S&P/NZX All Energy (Sector) vs S&P/NZX50 Index
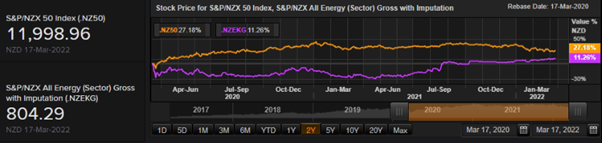
Source: REFINITIV
Key Risks and Challenges:
The Government is considering measures to control climate change. One of the measures was banning new low and medium-temperature coal-fired boilers and connecting with the private sector to help it transition away from fossil fuels.
The geopolitical unrest due to war between Russia and Ukraine has led to a global rise in crude oil, natural gas, coal, and other major commodities. In the short run, these spikes are pushing inflation on fire, resultantly denting the economy and consumers.
Exhibit 4. Key Risks in Utilities & Energy Sector:
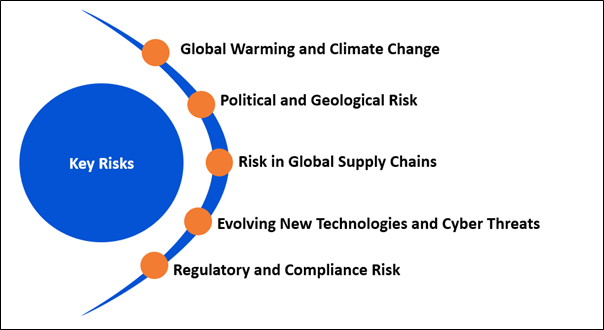
Source: Analysis by Kalkine Group
Outlook:
Hydrogen and energy are new fuel talked about globally as it is light, storable, energy-dense, with no direct emissions of pollutants or greenhouse gases. Hydrogen would play a crucial role in transport, buildings, and power generation. In this regard, the NZ government and Singapore signed a contract on 15 July 2021 regarding cooperation on low-carbon hydrogen.
As per the government, the operators expect a sharp rise in gas production soon, reaching a peak in 2024, mainly led by drilling campaigns at Pohokura in 2022/23 and Maui and the continuing developments at Turangi, Mangahewa and Maui.
Apart from the sector-specific factors, we have also analysed four NZX-listed companies operating in the same sector. This report covers their insights, outlook, performance and potential as expected to be delivered in the near to medium term.
1) Contact Energy Limited (Recommendation: Buy, Potential Upside: Low Double-Digit) (M-Cap: NZ$6.05 billion, Gross Dividend Yield: 5.563%)
Contact Energy Limited (NZX: CEN) is involved in providing electricity, natural gas, and liquefied petroleum gas (LPG), along with broadband services. The electricity is generated through thermal, hydro, and geothermal sources.
Outlook
The company is looking forward to its role in decarbonising the NZ economy over the next decade. The guidance provided by the company is:-
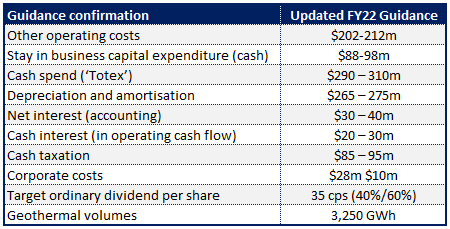
On 16 March 2022, the company released its February 2022 operating report where the customer business recorded an increase in mass-market electricity and gas sales of 262GWh (February 2021: 246GWh). The wholesale business also increased contracted electricity sales, including that sold to the customer business, totalling 557GWh (February 2021: 530GWh).
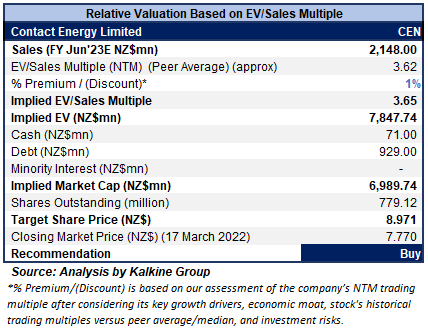
Valuation Methodology: EV/Sales Based Relative Valuation (Illustrative)
Technical Overview:
Daily Price Chart
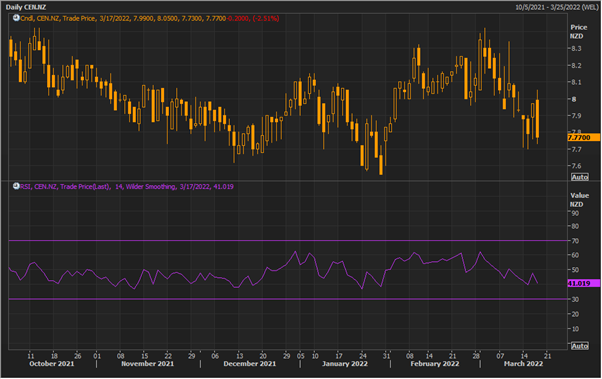
Source: REFINITIV, Note: Purple color line reflects Relative Strength Index (14-Period)
Stock Recommendation
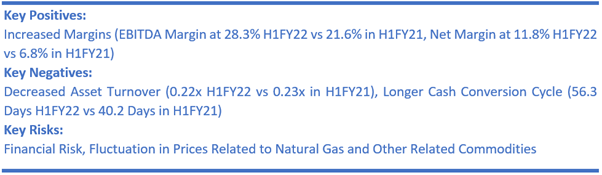
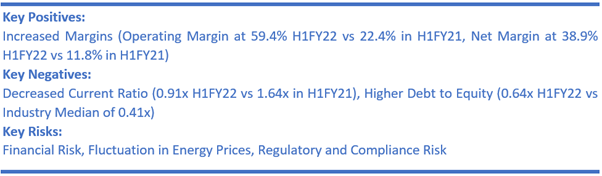
The stock has been valued using an EV/Sales multiple-based illustrative relative valuation, and the target price so arrived reflects a rise of low double-digit (in % terms). Accordingly, a slight premium has been applied to EV/Sales Multiple (NTM) (Peer Average), considering its strong financial performance in H1FY22 and robust balance sheet.
Considering the factors above, the current trading levels, and the associated business risks, we give a “Buy” recommendation on the stock at the closing market price of $7.77 per share, down 2.51% as of 17th March 2022.
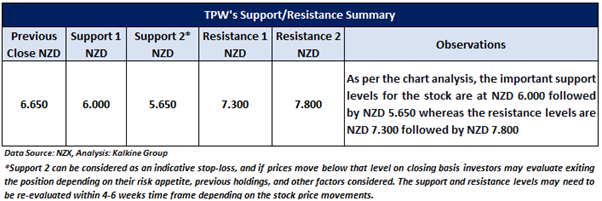
2) Trustpower Limited (Recommendation: Buy, Potential Upside: Low Double-Digit) (M-Cap: NZ$2.08 billion, Gross Dividend Yield: 7.251%)
Business Description:
Trustpower Limited (NZX: TPW) is engaged in the electricity generation and retail business of electricity, gas, and telecommunication products.
Outlook
The recent market, hydrological, and other factors have resulted in downward pressure on the earnings for H2FY22. The company has revised its EBITDAF guidance range for FY 2022 to $205-$220 million (excluding the costs of selling the retail business of ~$9.0 million and assuming that the retail business is held for the whole year). This reflects the change from previous guidance of $210-$225 million on the same basis.
Meanwhile, Manawa Energy’s core focus areas are leveraging on the relative strengths of TPW and developing and building the new renewable generation assets.
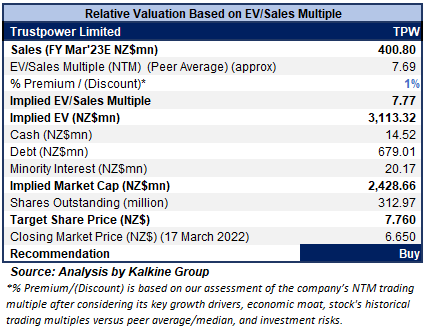
Valuation Methodology: EV/Sales Based Relative Valuation (Illustrative)
Technical Overview:
Daily Price Chart
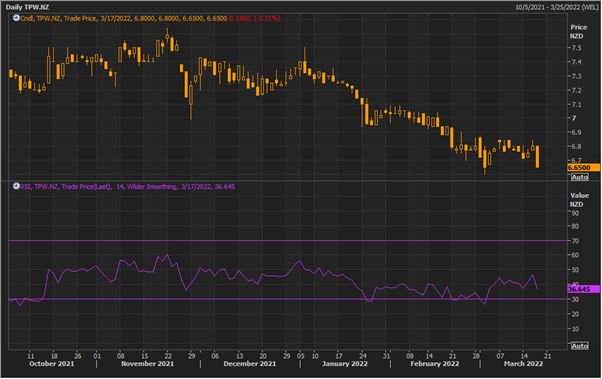
Source: REFINITIV, Note: Purple color line reflects Relative Strength Index (14-Period)
Stock Recommendation
The stock has been valued using an EV/Sales multiple-based illustrative relative valuation, and the target price so arrived reflects a rise of low double-digit (in % terms). Accordingly, a slight premium has been applied to EV/Sales Multiple (NTM) (Peer Average), considering a decent outlook for FY22 and higher EBITDAF from continuing operations in H1FY22.
Considering the factors above, the current trading levels, and the associated business risks, we give a “Buy” recommendation on the stock at the closing market price of $6.65 per share, down 2.21% as of 17th March 2022.
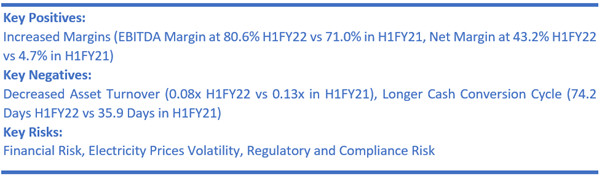
3) NZ Windfarms Limited (Recommendation: Speculative Buy, Potential Upside: Low Double-Digit) (M-Cap: NZ$59.05 million, Gross Dividend Yield: 3.750%)
Business Description:
NZ Windfarms Limited (NZX: NWF) is engaged in operating a wind power generation asset to generate and sell electricity.
Outlook
Reduced average wind speeds have impacted FY22 EBITDAF expectations. The revised FY22 generation is projected to be ~106 GWh based on actual generation. (FY21: 110.5 GWh). This generation impact is partially nullified by an increased fixed price for electricity in H2FY22 due to the VVFPA. Factoring the generation and an increased fixed price, FY22 EBITDAF is anticipated to be in the ambit of $6.5-$7.5 million, which is higher than $5.1 million EBITDAF in FY21.
Technical Overview:
Daily Price Chart
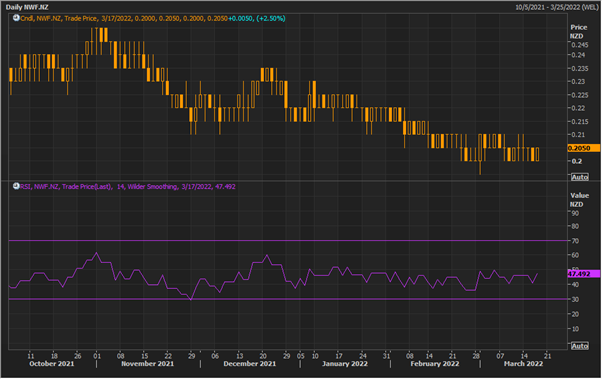
Source: REFINITIV, Note: Purple color line reflects Relative Strength Index (14-Period)
.png)
Stock Recommendation:
Considering the aforementioned factors, decent outlook, and the associated business risks, a “Speculative Buy” recommendation has been assigned on the stock at the closing market price of $0.205 per share, up 2.50% as of 17th March 2022.
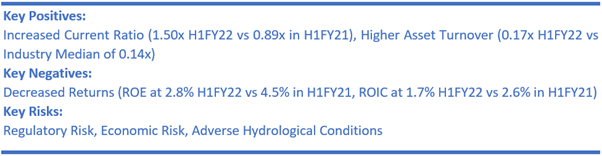
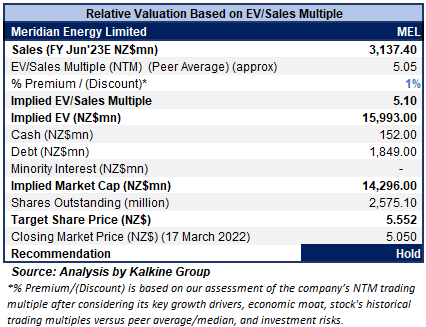
4) Meridian Energy Limited (Recommendation: Hold, Potential Upside: Low Double-Digit) (M-Cap: NZ$13.00 billion, Gross Dividend Yield: 4.388%)
Meridian Energy Limited (NZX: MEL) is engaged in generating 100% renewable energy from renewable sources - wind, water, and sun. It supplies electricity to its customers from the electricity grid, which combines electricity supplied from renewable and non-renewable sources.
Outlook
The company released the renewable development pipeline where the solar development is projected to complement battery at Ruākākā Energy Park. Further, the assessments are underway on additional solar sites, so the company acquired a land option at Bunnythorpe. The development options for 2.3 GW (5,700 GWh) are in progress; 1 GW is secured. Meanwhile, the company decided not to proceed with Central Wind development ($1.4M impairment expected in H2FY22).
On 15 March 2022, the company released its monthly operating report for February 2022, where national hydro storage fell from 117% to 102% of historical average, South Island storage fell to 97% of average and North Island storage fell to 137% of average by 10 March 2022.
Valuation Methodology: EV/Sales Based Relative Valuation (Illustrative)
Technical Overview:
Daily Price Chart
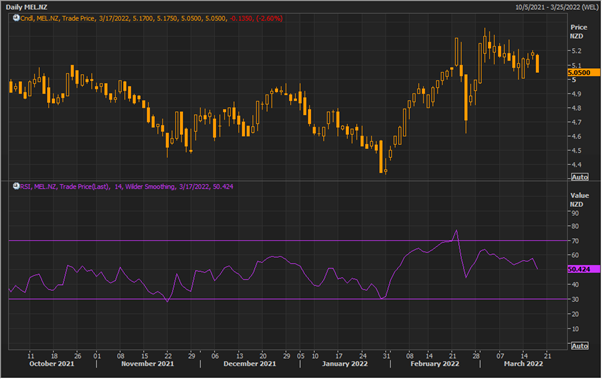
Source: REFINITIV, Note: Purple color line reflects Relative Strength Index (14-Period)
Stock Recommendation
The stock has been valued using an EV/Sales multiple-based illustrative relative valuation, and the target price so arrived reflects a rise of low double-digit (in % terms). Accordingly, a slight premium has been applied to EV/Sales Multiple (NTM) (Peer Average), considering continued growth in customer sales and its focus on developing the Harapaki wind farm.
Considering the aforementioned factors, we recommend a “Hold” rating on the stock at the closing market price of $5.05 per share, down by 1.50% as of 17th March 2022.
Markets are trading in a highly volatile zone currently due to certain macro-economic issues and geopolitical tensions prevailing. Therefore, it is prudent to follow a cautious approach while investing.
Note 1: The reference data in this report has been partly sourced from REFINITIV.
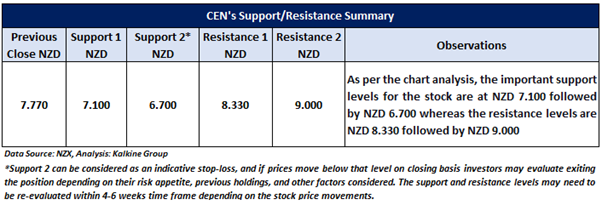
Note 2: Investment decisions should be made depending on the investors’ appetite on upside potential, risks, holding duration, and any previous holdings. Investors can consider exiting from the stock if the Target Price mentioned as per the analysis has been achieved and subject to the factors discussed above alongside support levels provided.
Technical Indicators Defined: -
Support: A level where-in the stock prices tend to find support if they are falling, and downtrend may take a pause backed by demand or buying interest.
Resistance: A level where-in the stock prices tend to find resistance when they are rising, and uptrend may take a pause due to profit booking or selling interest.
Stop-loss: It is a level to protect further losses in case of unfavourable movement in the stock prices.
Disclaimer
Kalkine New Zealand Limited is authorised to provide general advice only. The information on this website does not take into account any of your investment objectives, financial situation or needs. Before you make a decision about whether to acquire a financial product, you should obtain the Product Disclosure Statement from the product issuer. You should consider the appropriateness of advice taking into account your own objectives, financial situation and needs and seek independent financial advice before making any financial decisions.
Past performance is not a reliable indicator of future performance.
 Please wait processing your request...