
Company Overview:
Infratil Limited (NZX: IFT) owns renewable energy, transport, data and connectivity, and social infrastructure businesses in growth sectors. Contact Energy Limited (NZX: CEN) is a New Zealand-based energy generators and retailers.
Kalkine’s Sector Report covers the Investment Highlights, Key Financial Metrics, Risks, Outlook, Technical Analysis along with the Valuation, Target Price, and Recommendation on the stock.
1. Sector Landscape and Outlook
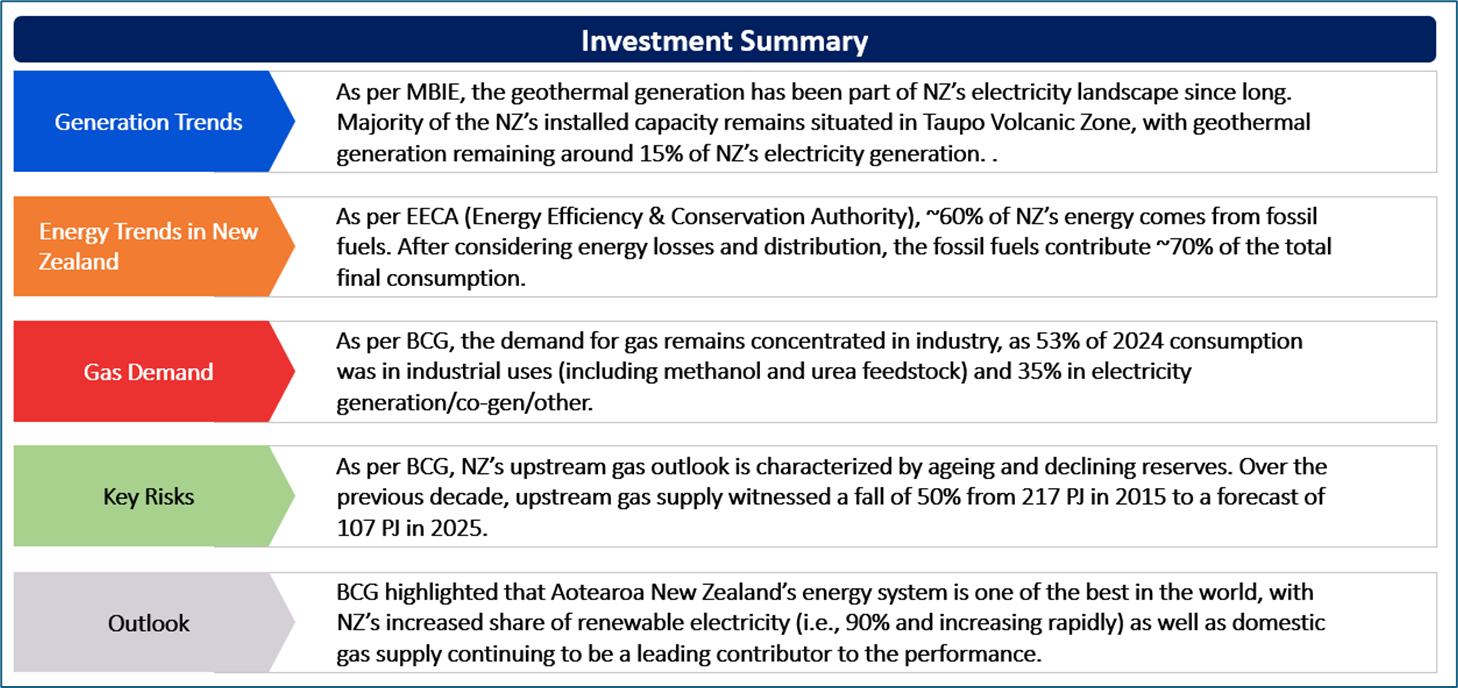
As per MBIE, hydroelectric generation continues to be a part of NZ’s energy system for several decades and has offering majority of NZ’s electricity needs. There is more than 5,000 MW of installed hydro capacity, and a major portion of this is found in South Island. Notably, the geothermal generation has been part of NZ’s electricity landscape since long. Majority of the NZ’s installed capacity remains situated in Taupo Volcanic Zone, with geothermal generation remaining around 15% of NZ’s electricity generation.
Furthermore, the wind generation accounts for ~5% of NZ’s electricity generation and most of NZ’s wind farms are situated in North Island. As per MBIE, this includes NZ’s 2 largest farms i.e., Tararua Wind Farm and West Wind Makara, located in lower North Island. The electricity generation from the combustion of coal, oil, and gas offers baseload, backup and peaker electricity supply. Notably, the generation from such fuels is makes up around a quarter of NZ’s electricity generation.
Exhibit 1: Quarterly Electricity Generation, Net Generation (GWh)
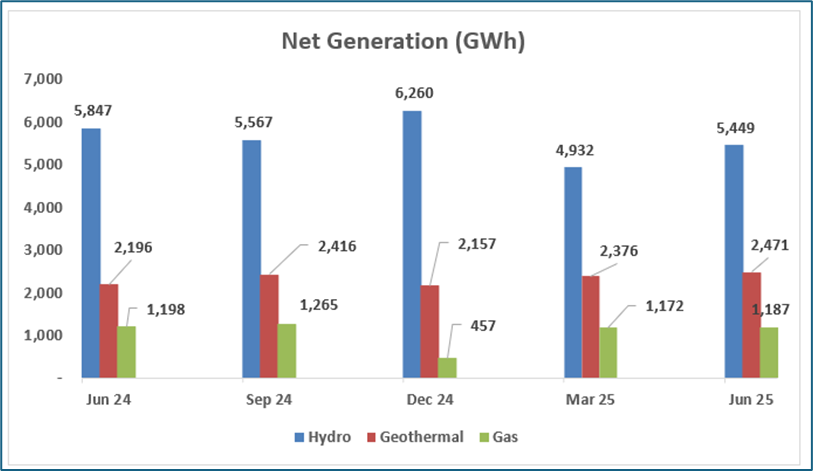
Data Source: This work is owned by the Ministry of Business, Innovation and Employment on behalf of the Crown which are licensed for reuse under the Creative Commons Attribution 4.0 International Licence; Chart Created by Kalkine Group
Energy Trends in New Zealand
As per EECA (Energy Efficiency & Conservation Authority), ~60% of NZ’s energy comes from fossil fuels. After considering energy losses and distribution, the fossil fuels contribute ~70% of the total final consumption. Notably, this consists of petrol and diesel for vehicles, coal and gas for industrial boilers as well as household gas and LPG. NZ’s electricity mostly (80-85%) comes from renewable energy sources. This is mainly because its geographical advantage, considering an island nation with mountains, lakes, comparatively consistent wind and rainfall, and good access to geothermal resources.
EECA highlighted that the percentage of NZ’s electricity generated from renewable energy sources tends to differ each year. This depends on the amount of rainfall, and to a lesser extent, the wind.
Gas Industry: A Broad Overview
As per BCG, the Gas remains foundational to NZ’s energy mix and economy. NZ’s domestic gas supply witnessed a decline of ~50% since 2015, despite the recent development efforts, while the largest field decline was witnessed in Pohokura. The demand for gas remains concentrated in industry, as 53% of 2024 consumption was in industrial uses (including methanol and urea feedstock) and 35% in electricity generation/co-gen/other. Notably, the remaining 12% was throughout commercial and residential loads. As per BCG, the commercial and residential demand remains stable considering the relatively small individual volumes and higher willingness to pay for gas as the source of heating and cooking.
Exhibit 2: Gas Production (Gross Petajoules (PJ)) (Quarterly)
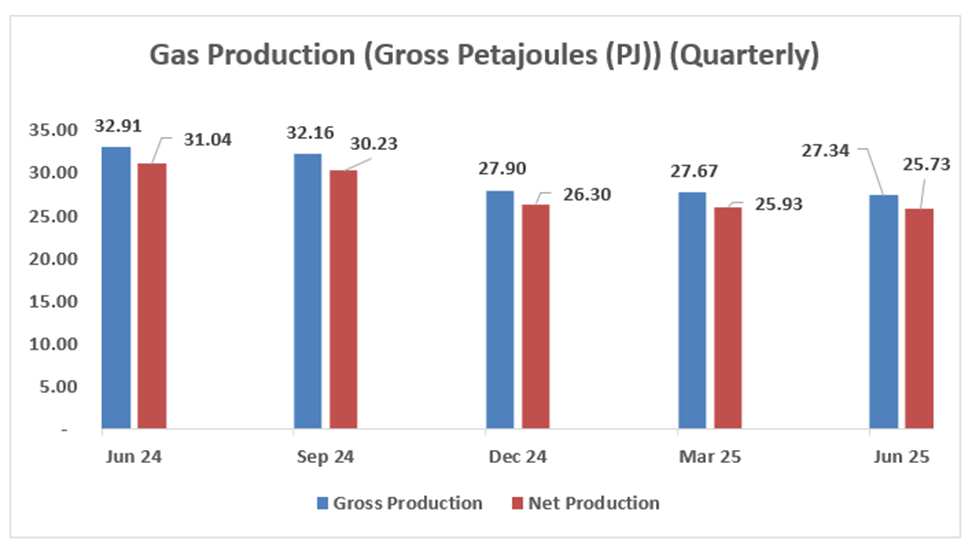
Data Source: This work is owned by the Ministry of Business, Innovation and Employment on behalf of the Crown which are licensed for reuse under the Creative Commons Attribution 4.0 International Licence; Chart Created by Kalkine Group
Key Risks and Challenges:
As per BCG, NZ’s upstream gas outlook is characterized by ageing and declining reserves. Over the previous decade, upstream gas supply witnessed a fall of 50% from 217 PJ in 2015 to a forecast of 107 PJ in 2025. Talking about the performance of H1 2025, BCG highlighted that the fall in gas supply remains structural and persistent and was not a one-off event. NZ’s dependency on the small set of maturing Taranaki fields results in reduced options, with more than 70% of production coming from top 3 fields in 2019, which are now making up for less than 50% in 2025.
Exhibit 3. Key Risks in Utilities Sector:
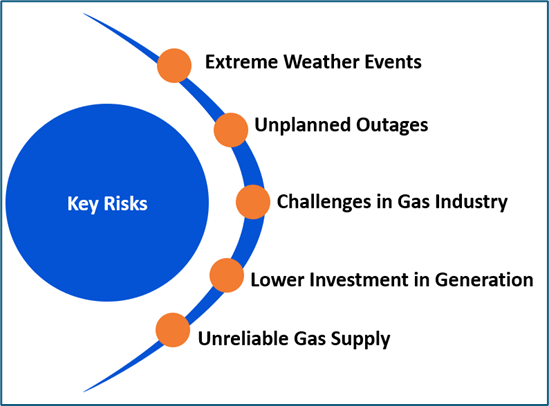
Source: - Analysis: Kalkine Group
Outlook:
As per BCG, Aotearoa New Zealand’s energy system is one of the best in the world, with NZ’s increased share of renewable electricity (i.e., 90% and increasing rapidly) as well as domestic gas supply continuing to be a leading contributor to the performance. This allowed NZ to affordably produce energy and be resilient to the broader energy shocks. BCG believes that, in order to reduce imbalance between the gas supply and demand, most effective actions revolve around accelerating drilling efforts in existing fields and help users in transitioning an incremental 10 PJ of gas to biomass and electricity by 2030. This is in addition to the ongoing and planned conversions.
BCG also highlighted that, if electricity industry focuses on building renewables at today’s pace, it would be increasing renewable generation to 95% by 2027 and 98% by 2030. Notably, a stronger domestic energy market is expected to provide base for capitalising on economic opportunity of up to $70 Bn in data centres to 2035.
Apart from the sector-specific factors, an analysis on 2 NZX-listed companies is provided. This report covers their insights, outlook, performance and potential as expected to be delivered in the near to medium term.
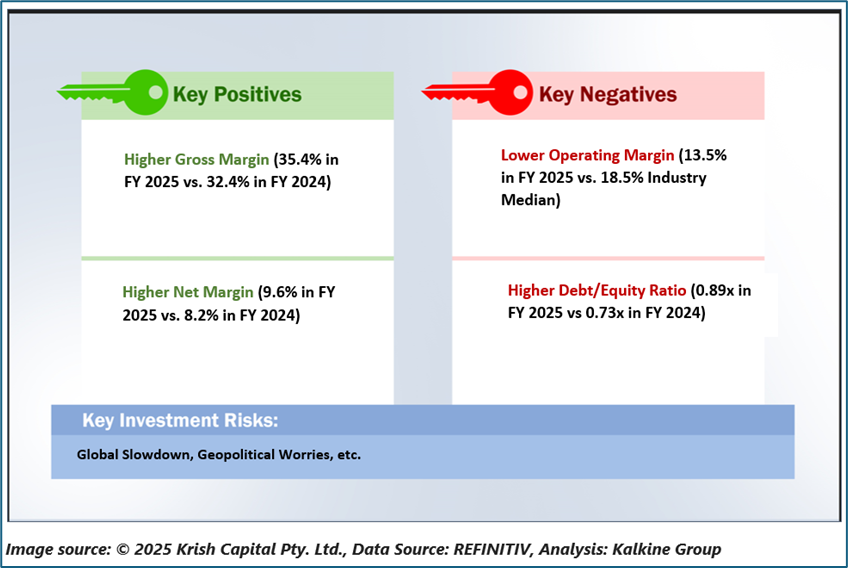
1) Contact Energy Limited (NZX: CEN) (Recommendation: Hold, Potential Upside: ) (M-Cap: NZD 9.4 Bn, Annual Dividend Yield: ~5.21%)
Business Description:
Contact Energy Limited (NZX: CEN) is a New Zealand-based energy generators and retailers.
Outlook:
CEN highlighted that, in FY 2026, it expects generation of 11.8TWh throughout hydro, geothermal, solar and thermal plants and wind PPAs, with more than 95% to be renewable. Also, it is anticipating normalised EBITDAF of $980 Mn. CEN highlighted that 3 - 5 TWh of new demand over the upcoming 5 years is projected to support new development, mainly driven by gas electrification.
Technical Overview:
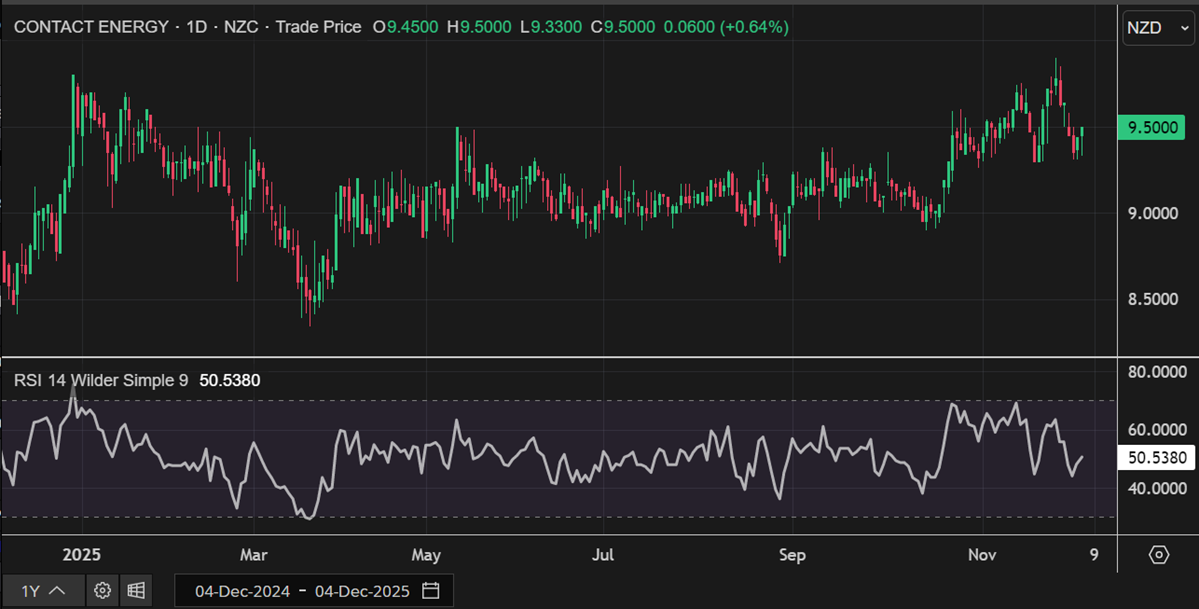
CEN Daily Technical Chart, Data Source: REFINITIV
Technical Commentary:
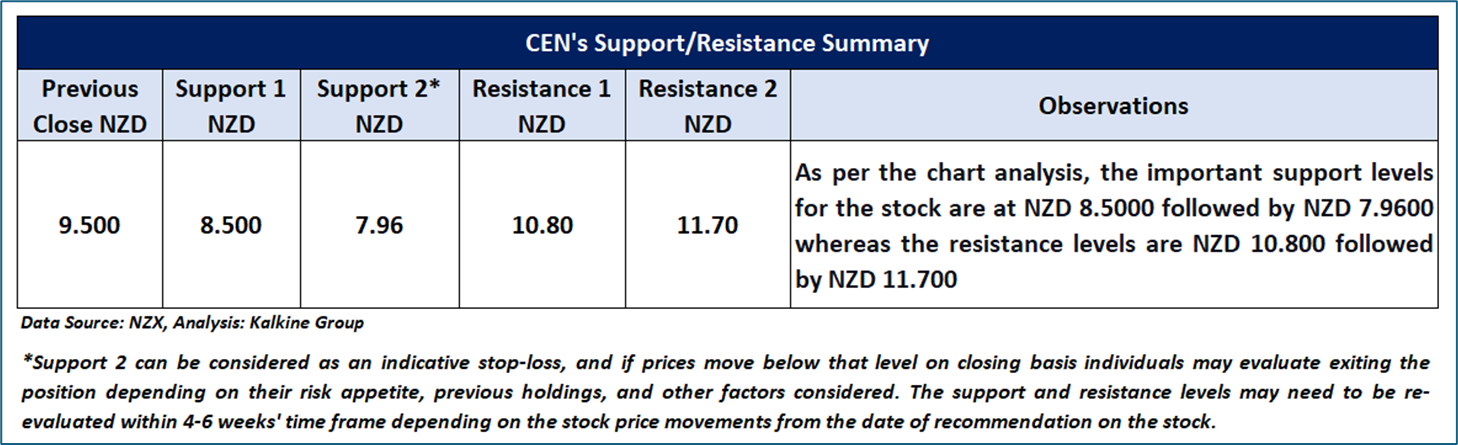
On the daily chart, CEN’s stock price broke above an Inverse head and shoulder pattern, indicating a positive trend. Currently, while undergoing a minor pullback, the stock is approaching the pattern’s Neckline, anticipating a potential rally. Moreover, the momentum oscillator RSI (14-period) is trading above its midpoint, adding more evidence to the previous observation. Price is trading between its previous peak and trough, which might serve as resistance and support levels for the stock, respectively. A significant support level is located at NZD 8.5, while a key resistance level is positioned at NZD 10.8
Fundamental Valuation
P/E Based Relative Valuation
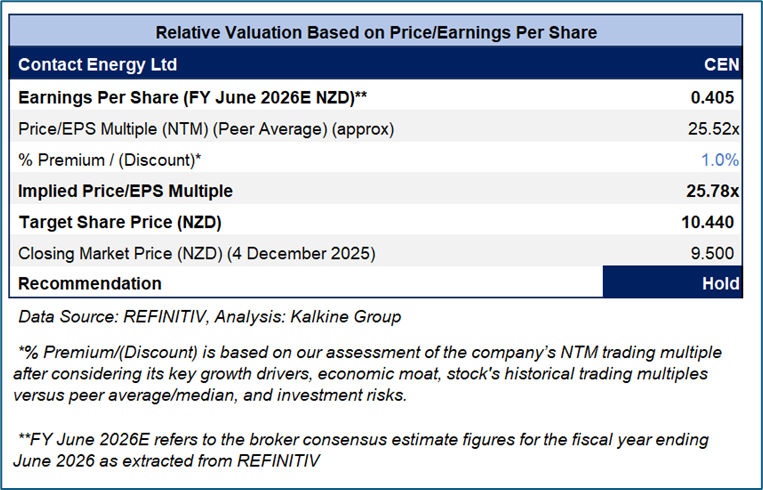
Stock Recommendation
Considering the facts above, a ‘Hold’ recommendation on the stock has been provided at the closing market price of NZD 9.50 per share, up by 0.64% as on 4 December 2025.
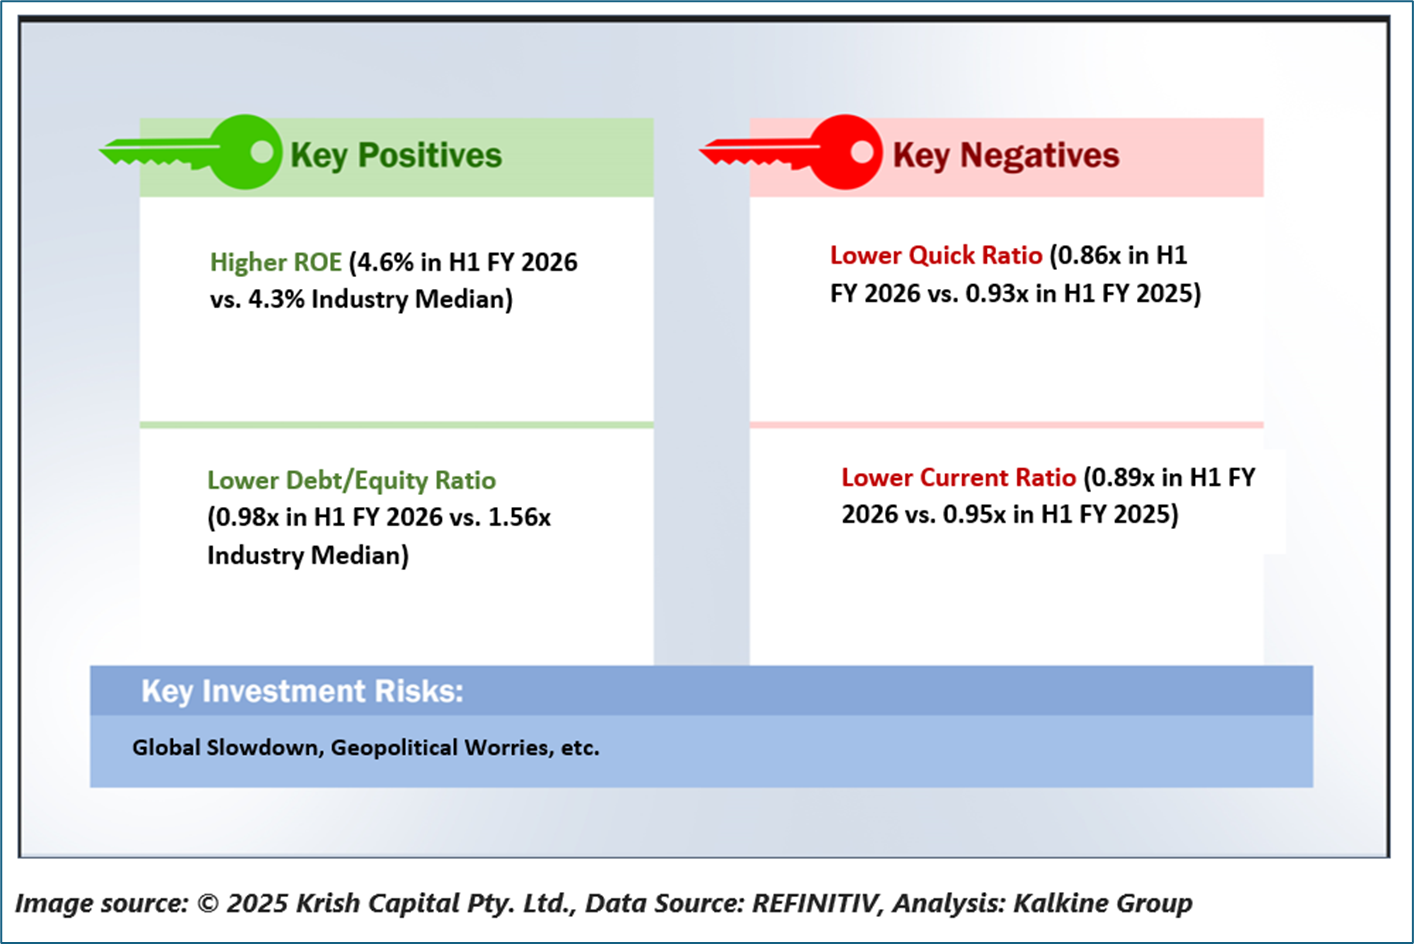
2) Infratil Limited (Recommendation: Buy, Potential Upside: Low Double-Digit) (M-Cap: NZD 11.6 Bn, Annual Dividend Yield: ~1.91%)
Business Description:
Infratil Limited (NZX: IFT) owns renewable energy, transport, data and connectivity, and social infrastructure businesses in growth sectors.
Outlook:
In the recent newsletter (November 2025), IFT stated that it remains confident in CDC’s outlook. CDC has been witnessing robust broad-based demand for the data centres as well as possesses a diversified customer base throughout national critical infrastructure, public sector, and hyperscale & AI. Furthermore, Australia happens to be an attractive market for hyperscalers, considering the mature data centre system, lease rates as well as cost-effective power. CDC’s recent 140 megawatts (MW) of new contract announcements can help it in delivering forecast revenue in order to achieve the aim of doubling the FY 2025 EBITDAF of A$330 Mn in FY 2027.
Technical Overview:
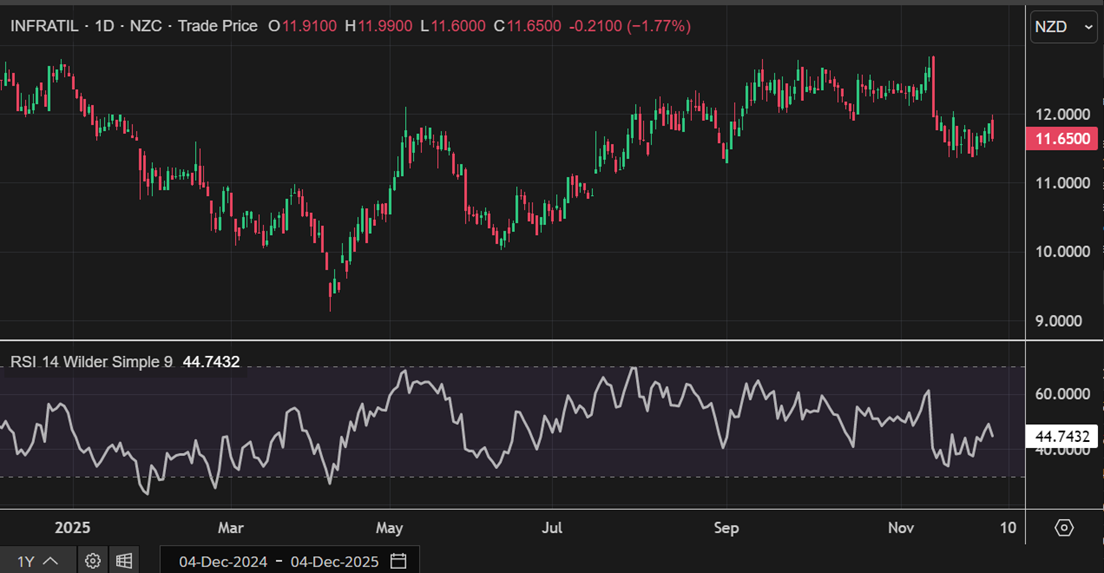
IFT Daily Technical Chart, Data Source: REFINITIV
Technical Commentary
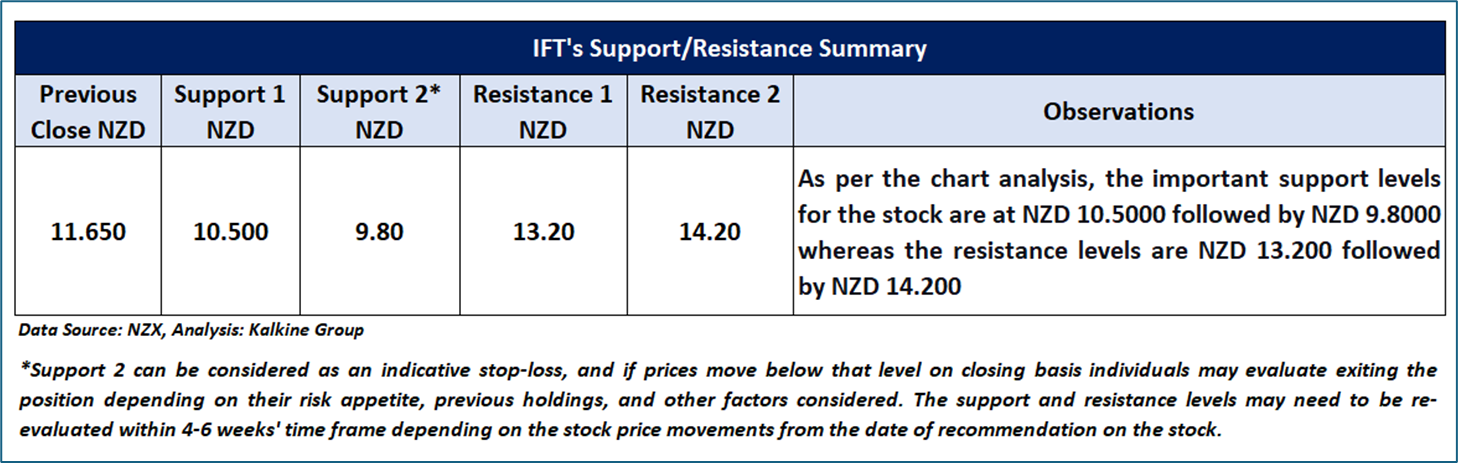
On the daily chart, IFT’s stock price is fluctuating between a trading range characterized by identical peaks and troughs, suggesting that the current sideways period in the stock might continue to persist in the near future. Additionally, the momentum oscillator RSI (14-period) is trading near its midpoint, adding more evidence to the mentioned recommendation. Price is trading between its previous peak and trough, which might serve as resistance and support levels for the stock, respectively. A significant support level is located at NZD 10.5, while a key resistance level is positioned at NZD 13.2.
P/CF Based Relative Valuation
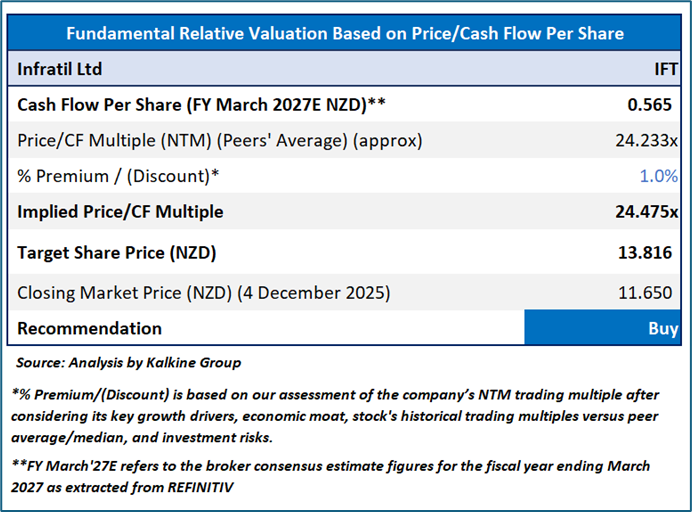
Stock Recommendation
Considering the aforementioned factors, a “Buy” rating is given on the stock at the closing market price of NZD 11.65 per share, down by 1.77% as on 4 December 2025.
Markets are trading in a highly volatile zone currently due to certain macro-economic issues and geopolitical tensions prevailing. Therefore, it is prudent to follow a cautious approach while investing.
Note 1: Past performance is neither an indicator nor a guarantee of future performance.
Note 2: The reference date for all price data, currency, technical indicators, support, and resistance levels is 4 December 2025. The reference data in this report has been partly sourced from REFINITIV.
Note 3: Investment decisions should be made depending on an individual's appetite for upside potential, risks, holding duration, and any previous holdings. An 'Exit' from the stock can be considered if the Target Price mentioned as per the Valuation and or the technical levels provided has been achieved and is subject to the factors discussed above.
Note 4: Kalkine reports are prepared based on the stock prices captured either from REFINITIV or Trading View. Typically, REFINITIV or Trading View may reflect stock prices with a delay which could be a lag of 25-30 minutes. There can be no assurance that future results or events will be consistent with the information provided in the report. The information is subject to change without any prior notice.
Technical Indicators Defined: -
Support: A level at which the stock prices tend to find support if they are falling, and a downtrend may take a pause backed by demand or buying interest. Support 1 refers to the nearby support level for the stock and if the price breaches the level, then Support 2 may act as the crucial support level for the stock.
Resistance: A level at which the stock prices tend to find resistance when they are rising, and an uptrend may take a pause due to profit booking or selling interest. Resistance 1 refers to the nearby resistance level for the stock and if the price surpasses the level, then Resistance 2 may act as the crucial resistance level for the stock.
Stop-loss: It is a level to protect further losses in case of unfavourable movement in the stock prices.
This report (“Report”) has been issued by Kalkine New Zealand Limited (FSP691351) (NZBN:9429047678101) (“Kalkine”). Kalkine is a Financial Advice Provider (“FAP”) and is authorised by a Class 1 Financial Advice Provider Licence issued by Financial Markets Authority (“FMA”) to provide financial advice. Kalkine provides only general financial advice through its research reports following a person becoming a member. The reports contain buy/sell/hold and other recommendations in relation to equity securities, managed funds and other managed investment schemes and other financial advice products. The recommendations and opinions in this Report and on Kalkine website do not take into account any of your investment objectives, financial situation or needs. Before you make a decision about whether to acquire a financial product, you should obtain the Product Disclosure Statement from the product issuer. You should consider the appropriateness of advice taking into account your own objectives, financial situation and needs and seek independent financial advice before making any financial decisions. If you act on the advice in the research reports, you may have to pay fees, expenses or other amounts (but not to Kalkine).
The information in this Report and on the Kalkine website has been prepared from a wide variety of sources, which Kalkine, to the best of its knowledge and belief, considers accurate. Kalkine has made every effort to ensure the reliability of the information contained in its reports (including this Report), newsletters and websites. All information represents our views at the date of publication and may change without notice.
Kalkine does not issue, sell or deal in any financial products. The information in this Report does not constitute an offer to sell securities or other financial products or a solicitation of an offer to buy securities or other financial products. Our reports contain general recommendations to invest in securities and other financial products. Kalkine is not responsible for, and does not guarantee, the performance of, or returns on, any investments mentioned in this Report.
This Report may contain information on past performance of particular investments. Past performance is not a reliable indicator of future performance. Returns stated do not take into account transaction costs and taxes.
Further information about the complaints and dispute resolution process, as well as information about Kalkine’s duties are available on Kalkine’s website. Please read our Financial Advice Provider (FAP) disclosure statement and Complaints Handling Guide, which are available on the website.
Copyright 2025 Krish Capital Pty. Ltd. (ABN 61629651510). All Rights Reserved. No part of this Report, or its content, may be reproduced in any form without our prior consent.
Past performance is not a reliable indicator of future performance.
 Please wait processing your request...