
Company Overview:
Manawa Energy Limited (NZX: MNW) is one of Aotearoa New Zealand’s largest renewable electricity generators. Chatham Rock Phosphate Limited (NZX: CRP) is an exploration and development company which is focused towards becoming a diversified phosphate developer and trader.
Kalkine’s Sector Report covers the Investment Highlights, Key Financial Metrics, Risks, Outlook, Technical Analysis along with the Valuation, Target Price, and Recommendation on the stock.
A new report published by EECA (or the Energy Efficiency and Conservation Authority) explains a path for the South Island's industrial sector to shift from fossil fuels to renewable energy. This would be enhancing energy efficiency as well as preparing industry for the low-carbon economy. The South Island Regional Energy Transition Accelerator (or RETA) report consolidates the findings from 6 regional reports, explaining energy demands and renewable supply options for the medium to large businesses. The programme helps the key players throughout the energy sectors and large energy users to drive the transition.
The South Island RETA report consolidates all the findings from regional reports in Nelson Marlborough Tasman, North Canterbury, Mid-South Canterbury, West Coast, Otago, and Southland. As per the report, nearly 1Mt CO₂e per annum of process heat emissions reductions might be economic within the upcoming 15 years and energy efficiency could reduce the use of fossil fuels by 32% to 39% in the South Island RETA. Also, completed or confirmed fuel-switching projects would be delivering a 29% reduction in process heat emissions as compared to 2022 and demand reduction and thermal efficiency projects might further reduce emissions by 25%.
As of now, South Island industrial sites make up for ~80% of NZ's coal and 11% of LPG use, emitting 28% of the country’s process heat emissions. The South Island has some of the largest as well as most diverse industrial heat users in the country, utilising primarily coal, which highlights the opportunities for switching to renewables.
Electricity Statistics
As per the statement of performance expectations (1 July 2024 – 30 June 2025), the electrification would be playing a significant role in the transition away from fossil fuels. For much of NZ’s energy needs, electrification happens to be the most suitable (and cheapest) option to lower emissions. As per the release, ~40% of the energy, industrial process, and product emissions in NZ are well-suited to electrify, with the further 20% which may be suited to electrify.
This is because several technologies such as electric boilers, heat pumps, and electric vehicles are already or are soon anticipated to be cost competitive with fossil fuel alternatives. Where electrification is not feasible, energy users are required to be supported to utilise alternative renewable fuels like biomass, biogas, and green hydrogen (if feasible and economic).
With respect to electricity demand, approximately a third of NZ’s electricity demand is from households and over a third is from industrial sectors. Notably, the commercial sectors utilise around a quarter of NZ’s electricity demand. The remaining demand is from transport sectors and the agriculture, forestry, and fishing sectors, which use only a small amount.
Exhibit 1: Net Generation (GWh)
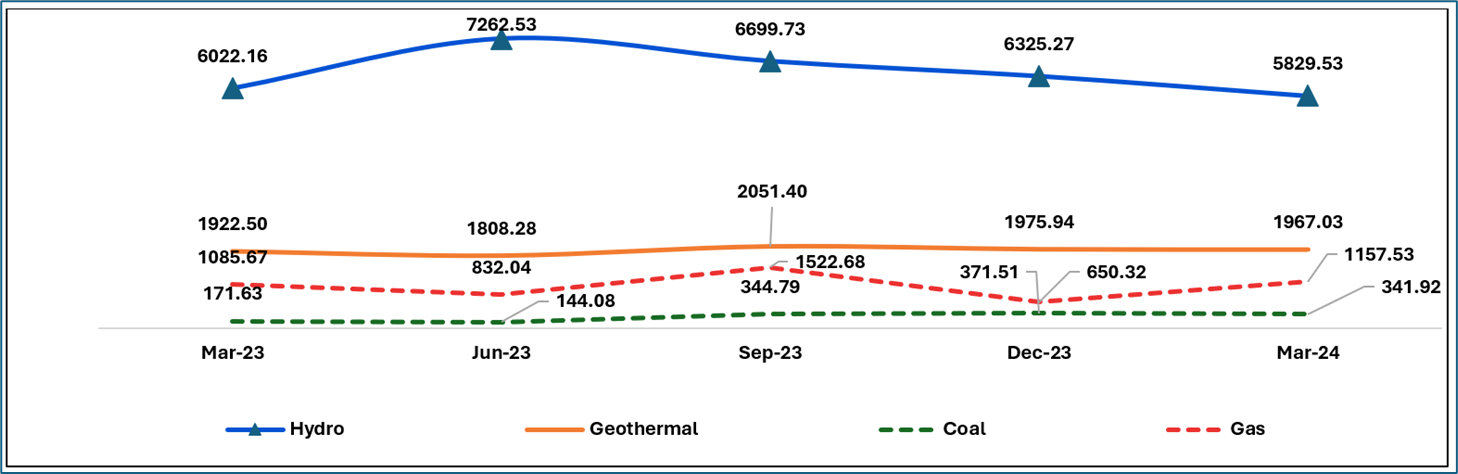
Data Source: This work is owned by the Ministry of Business, Innovation and Employment on behalf of the Crown which are licensed for reuse under the Creative Commons Attribution 4.0 International Licence; Chart Created by Kalkine Group
Domestic Oil Production
Oil is extracted from several fields in the Taranaki region as well as exported. Nowadays, the Maari, Pohokura and Maui fields account for over half of domestic oil production. Maui, which was discovered in 1969 and begun production in 1979, formerly gave the majority of domestic oil production, but has since declined in significance.
NZ is a net importer of oil. In the month of April 2022, Channel Infrastructure started operating as a fuel import terminal at Marsden Point in Northland. Most oil gets imported from refineries which are present in Singapore, South Korea and Japan. With respect to consumption, diesel and petrol are dominating petroleum product consumption in NZ.
Exhibit 2: Oil Supply (Gross Petajoules (PJ)) (Monthly) (Indigenous Production)
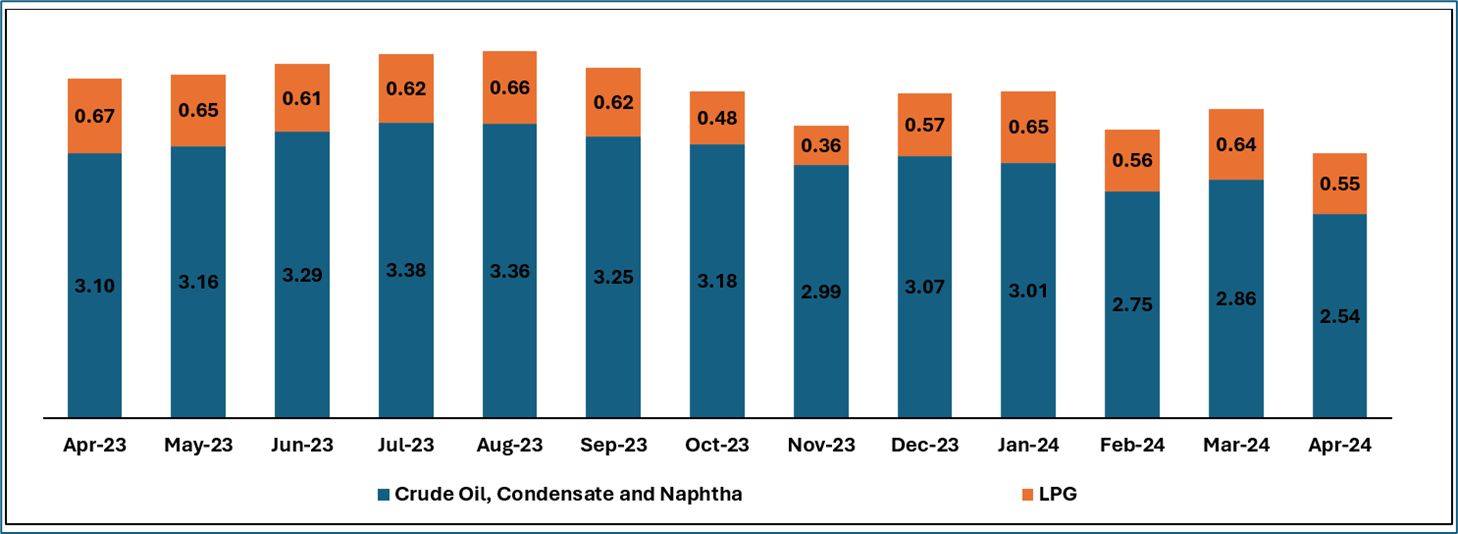
Data Source: This work is owned by the Ministry of Business, Innovation and Employment on behalf of the Crown which are licensed for reuse under the Creative Commons Attribution 4.0 International Licence; Chart Created by Kalkine Group
Key Risks and Challenges:
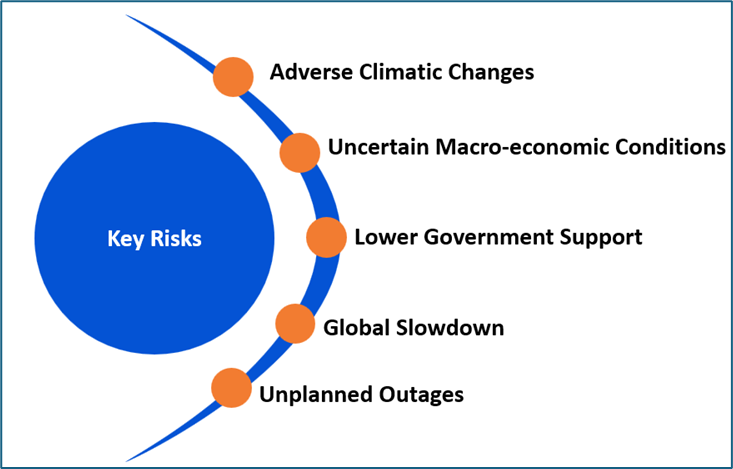
The companies operating in the energy sector might face risks including increased generation costs, unplanned outages, etc. Notably, fluctuation in the fuel costs might also pose a challenge for the broader utilities sector. The sector could might get adversely impacted because of climate-related risks, physical risks of slips and trips and confronting weather conditions, etc.
The broader utilities sector is also exposed to the risks such as uncertain macro-economic environment, lesser government support, etc.
Exhibit 3. Key Risks in Utilities Sector:
Source:- Analysis: Kalkine Group
Outlook:
NZ is well-positioned to transition to the sustainable energy system which supports NZ’s future generations. Energy use is responsible for more than 40% of NZ’s total greenhouse gas emissions. Non-renewable energy sources such as oil, gas, and coal produce large quantities of greenhouse gas emissions when burned. NZ is relying on these fossil fuels for more than 70% of the energy needs. Enabling energy users to increase energy efficiency as well as conservation and switch to renewable, low-emissions energy sources is the country’s largest opportunity to reduce the energy-related emissions, particularly in the transport and business sectors.
EECA is of the view that New Zealanders and businesses would not make the switch to efficient, low-emissions vehicles if they are doubtful on whether or not they can charge them as and when required. There would be maximisation of private sector investment in order to help accelerate the roll-out of comprehensive, nationwide network of public electric vehicle (or EV) charging infrastructure, helping electrification of transport and futureproofing NZ’s charging network for higher demand.
Notably, productive and low-emissions business, efficient and low-emissions transport, energy efficient homes, etc. are some of the strategic focus areas of EECA.
Apart from the sector-specific factors, an analysis on two NZX-listed companies is provided. This report covers their insights, outlook, performance and potential as expected to be delivered in the near to medium term.
1) Manawa Energy Limited (Recommendation: Hold, Potential Upside: Low Double-Digit) (M-Cap: NZD 1.31 Billion, Annual Dividend Yield (TTM)1: 6.28%)
Business Description:
Manawa Energy Limited (NZX: MNW) is one of Aotearoa New Zealand’s largest renewable electricity generators.
Outlook:
MNW is expecting FY 2025 EBITDAF in the range of $130 Mn - $150 Mn, with capital expenditure expected to be between $40 Mn - $50 Mn. The company would be spending ~$6.5 Mn on operational expenditure and $4.0 Mn of capital expenditure on the progression and growth of the new development pipeline in FY 2025. The company is in a strong position to realise the potential of diverse fleet of hydro assets.
Technical Overview:
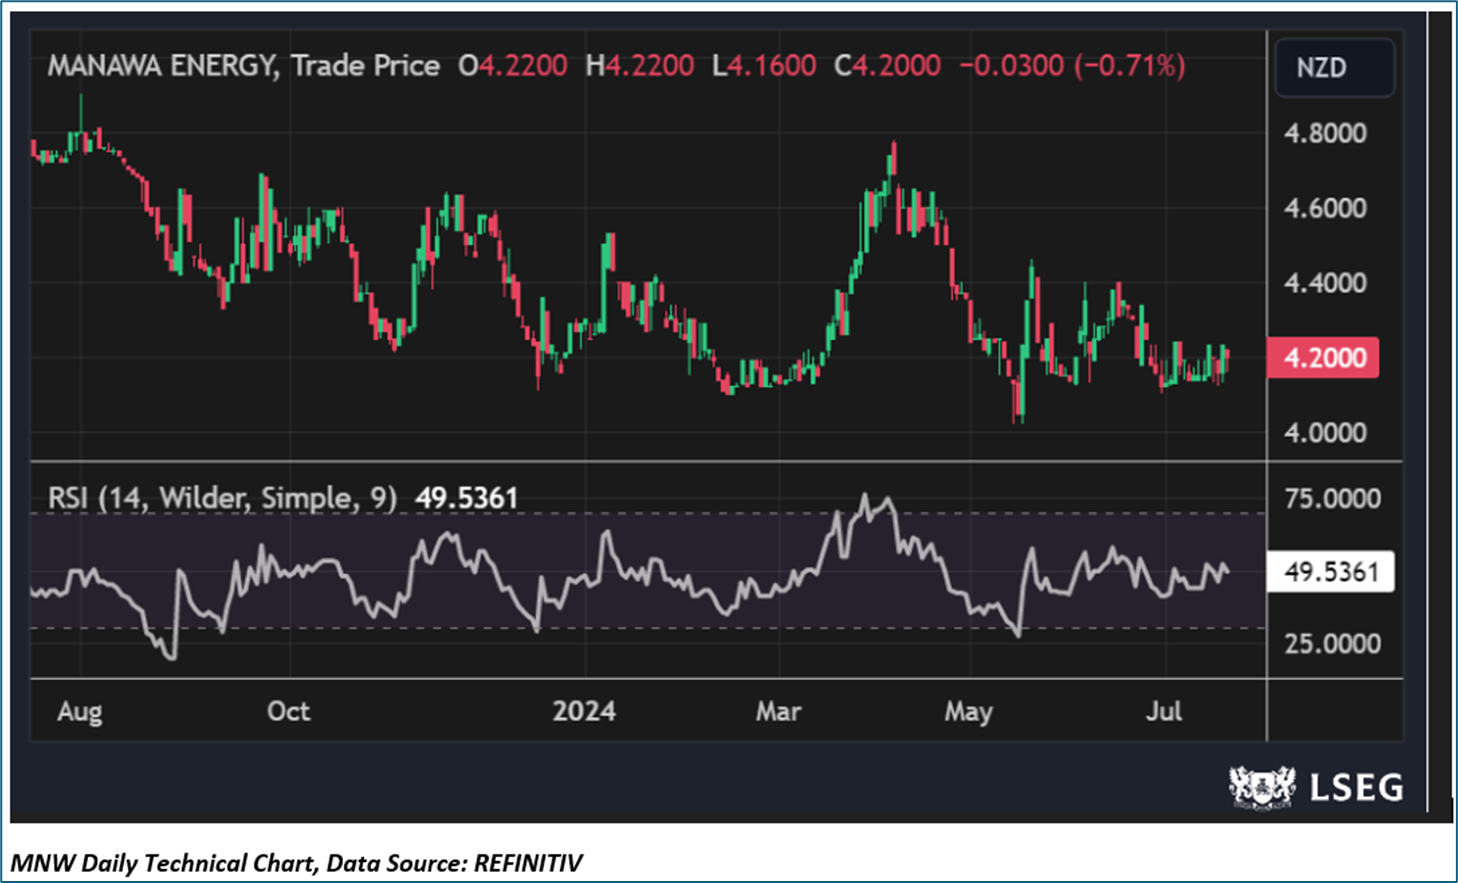
Technical Commentary:
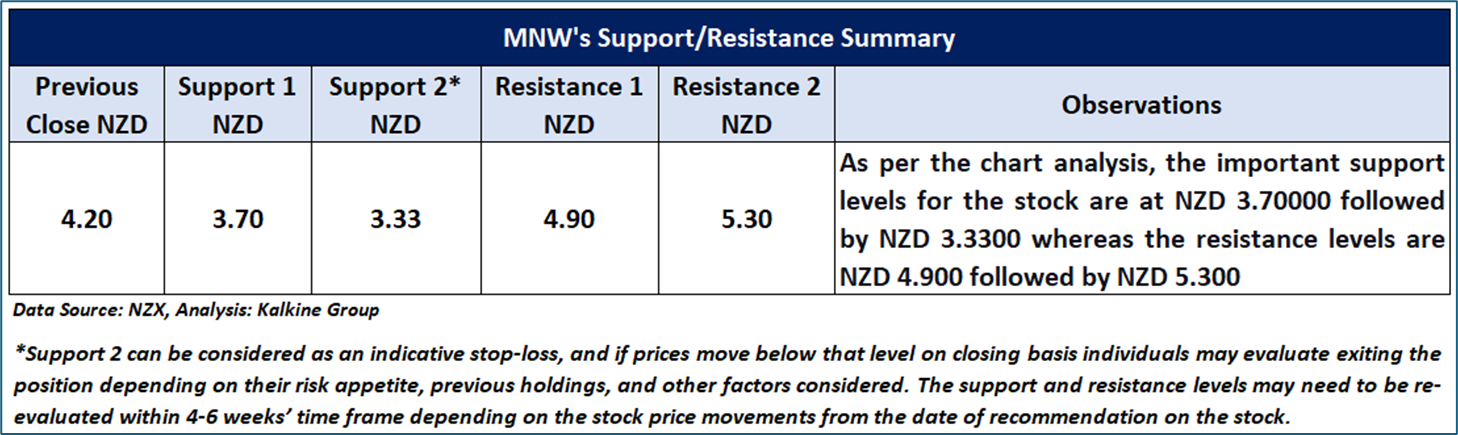
MNW's daily chart indicates a potential uptrend near range-bound support, with a white candle signalling bullish sentiment. The 14-period RSI at 49.54 reflects moderate bullish momentum. The 21-day SMA below the current price suggests potential support, while the 50-day SMA above may act as resistance. Key levels: support at NZD 3.70 and NZD 3.33 and resistance at NZD 4.90 and NZD 5.30.
Fundamental Valuation:
Price/EPS Based Relative Valuation
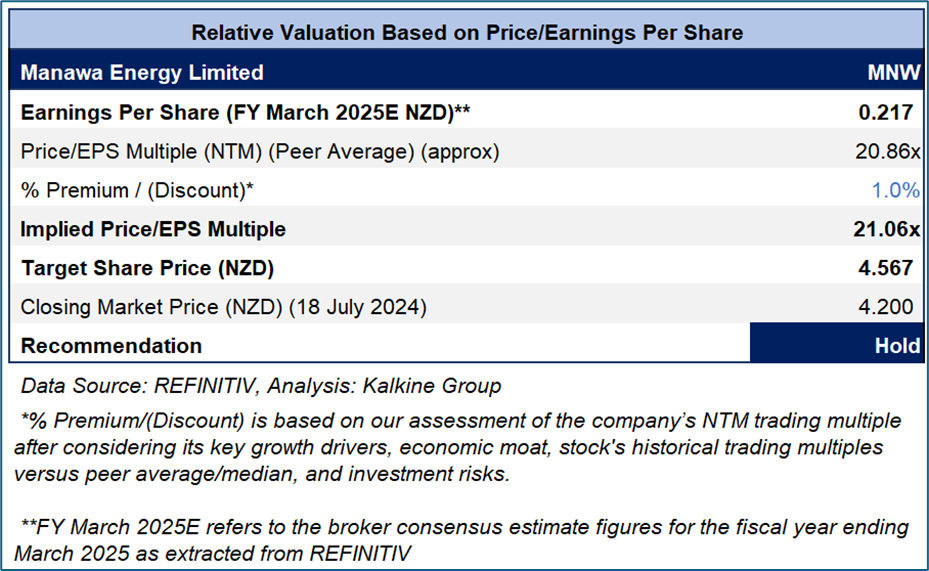
Stock Recommendation
Considering the facts above, a ‘Hold’ recommendation on the stock has been provided at the closing market price of NZD 4.20 per share, down by 0.71% as on 18 July 2024.
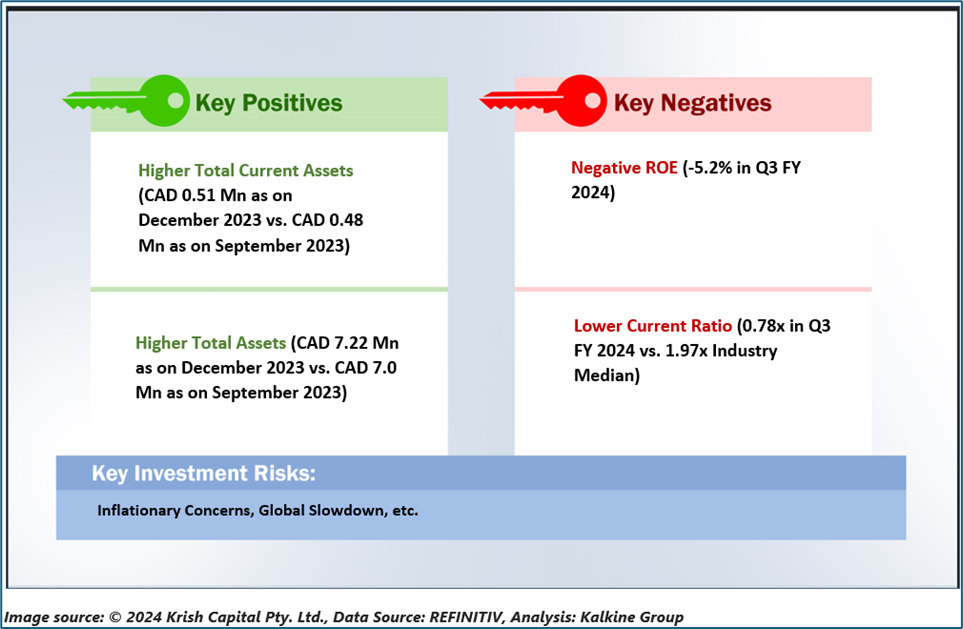
2) Chatham Rock Phosphate Limited (Recommendation: Speculative Buy, Potential Upside: Low Double-Digit) (M-Cap: NZD 10.5 million)
Business Description:
Chatham Rock Phosphate Limited (NZX: CRP) is an exploration and development company focused towards becoming diversified phosphate developer and trader.
Outlook:
CRP advised that the Korella North Mine ML100379 permitting process took another major move forward today with Environmental Approval for granting of the mining lease. The Company has future multi-year work program obligations to maintain the tenure of its mineral permits.
CRP advised on June 28, 2024 that the submission window for subscriptions in its non-brokered share private placement closed that day. On the same day, it announced that Share Purchase Plan offer would be made to all the shareholders in the jurisdictions where such an offering is lawfully permitted. This is mainly in New Zealand. The company would be using net proceeds towards fast tracking the development of the Korella North mine, general working capital, etc.
Technical Overview:
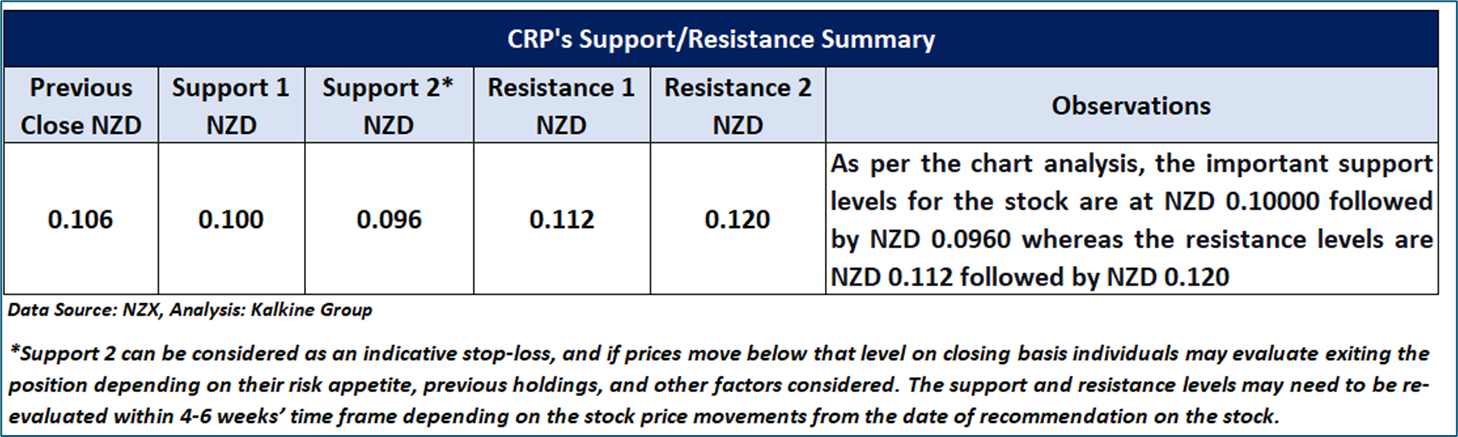
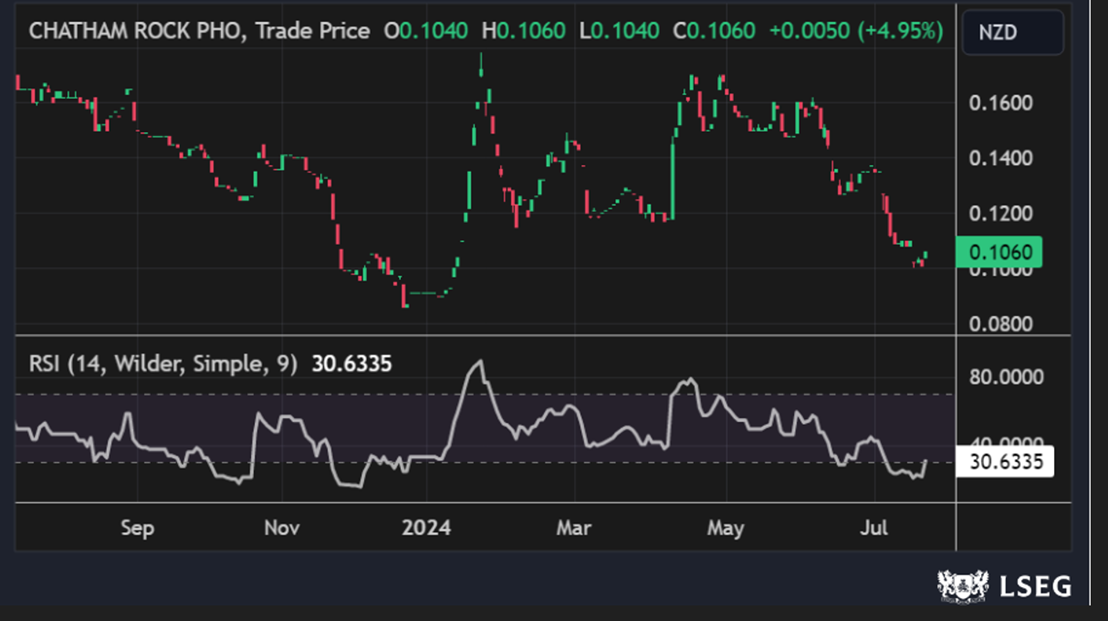
CRP Daily Technical Chart, Data Source: REFINITIV
Technical Commentary
CRP's daily chart suggests a potential uptrend with a bullish reversal pattern forming solid support. A white candle indicates bullish sentiment, and the 14-period RSI at 30.63 shows a pullback from oversold levels, showing moderate bullish momentum. The 21-day SMA and 50-day SMA above may pose resistance. Key levels include support at NZD 0.100 and NZD 0.096, with resistance noted at NZD 0.112 and NZD 0.120.
Stock Recommendation
Considering the aforementioned factors, a “Speculative Buy” rating is given on the stock at the closing market price of NZD 0.106 per share, up by 4.95% as on 18 July 2024.
Markets are trading in a highly volatile zone currently due to certain macro-economic issues and geopolitical tensions prevailing. Therefore, it is prudent to follow a cautious approach while investing.
Note 1: Past performance is neither an indicator nor a guarantee of future performance.
Note 2: The reference date for all price data, currency, technical indicators, support, and resistance levels is 18 July 2024. The reference data in this report has been partly sourced from REFINITIV.
Note 3: Investment decisions should be made depending on an individual's appetite for upside potential, risks, holding duration, and any previous holdings. An 'Exit' from the stock can be considered if the Target Price mentioned as per the Valuation and or the technical levels provided has been achieved and is subject to the factors discussed above.
Technical Indicators Defined: -
Support: A level at which the stock prices tend to find support if they are falling, and a downtrend may take a pause backed by demand or buying interest. Support 1 refers to the nearby support level for the stock and if the price breaches the level, then Support 2 may act as the crucial support level for the stock.
Resistance: A level at which the stock prices tend to find resistance when they are rising, and an uptrend may take a pause due to profit booking or selling interest. Resistance 1 refers to the nearby resistance level for the stock and if the price surpasses the level, then Resistance 2 may act as the crucial resistance level for the stock.
Stop-loss: It is a level to protect further losses in case of unfavourable movement in the stock prices.
Disclaimer This report has been issued by Kalkine New Zealand Limited (FSP691351) (NZBN:9429047678101) (“Kalkine”). Kalkine is a Financial Advice Provider (“FAP”) and is authorised by a Class 1 Financial Advice Provider Licence issued by Financial Markets Authority (“FMA”) to provide financial advice. Kalkine provides only general financial advice through its research reports following a person becoming a member. The reports contain buy/sell/hold and other recommendations in relation to equity securities, managed funds and other managed investment schemes and other financial advice products. The recommendations and opinions in this report and on Kalkine website do not take into account any of your investment objectives, financial situation or needs. Before you make a decision about whether to acquire a financial product, you should obtain the Product Disclosure Statement from the product issuer. You should consider the appropriateness of advice taking into account your own objectives, financial situation and needs and seek independent financial advice before making any financial decisions. If you act on the advice in the research reports, you may have to pay fees, expenses or other amounts (but not to Kalkine). Further information about the complaints and dispute resolution process, as well as information about Kalkine’s duties are available on Kalkine’s website. Please read our Financial Advice Provider (FAP) disclosure statement and Complaints Handling Guide, which are available on the website.
Past performance is not a reliable indicator of future performance.
 Please wait processing your request...