
Company Overview:
Vector Limited (NZX: VCT) is the NZ energy and digital solutions company, running a portfolio of businesses offering energy, technology and communication services. Genesis Energy Limited (NZX: GNE) is a NZ-owned energy company which fosters strong links with its customers and community stakeholders.
Kalkine’s Sector Report covers the Investment Highlights, Key Financial Metrics, Risks, Outlook, Technical Analysis along with the Valuation, Target Price, and Recommendation on the stock.
1. Sector Landscape and Outlook
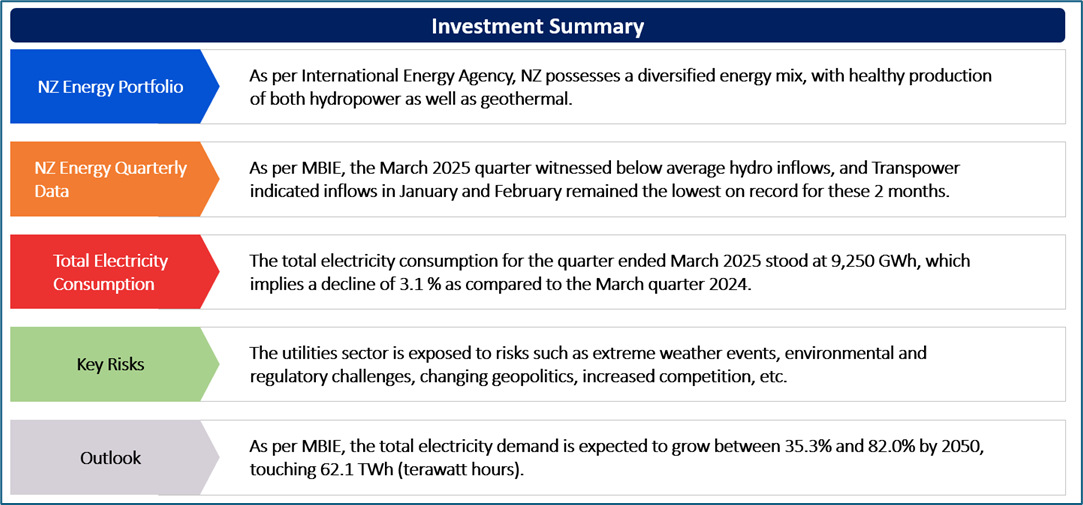
As per International Energy Agency, NZ possesses a diversified energy mix, with healthy production of both hydropower as well as geothermal. With the country focusing on energy transition, it has many natural advantages. These include healthy renewable resource base. NZ has a low-emissions electricity system, with more than 80% of electricity resulting from renewable sources. Notably, the transport sector makes up for the highest share of emissions and is almost entirely reliable on the oil, while industry is also dependent on the fossil fuels. As per MBIE, a significant amount of NZ’s total primary energy supply (TPES) is coming from the renewable resources. Notably, the hydro, geothermal, wind and bioenergy are utilised for producing electricity in NZ.
Also, oil is NZ’s largest source of energy, and it has a robust influence on the broader economy. New Zealand exports local crude as well as imports refined petroleum products. Diesel and petrol have been dominating the petroleum product consumption in NZ. While the diesel remains the primary fuel utilised for commercial land transport, its use is also strongly linked to the economic performance. On the other hand, petrol consumption is for the private use.
Exhibit 1: Oil Supply (Indigenous Production) (Gross Petajoules (PJ))
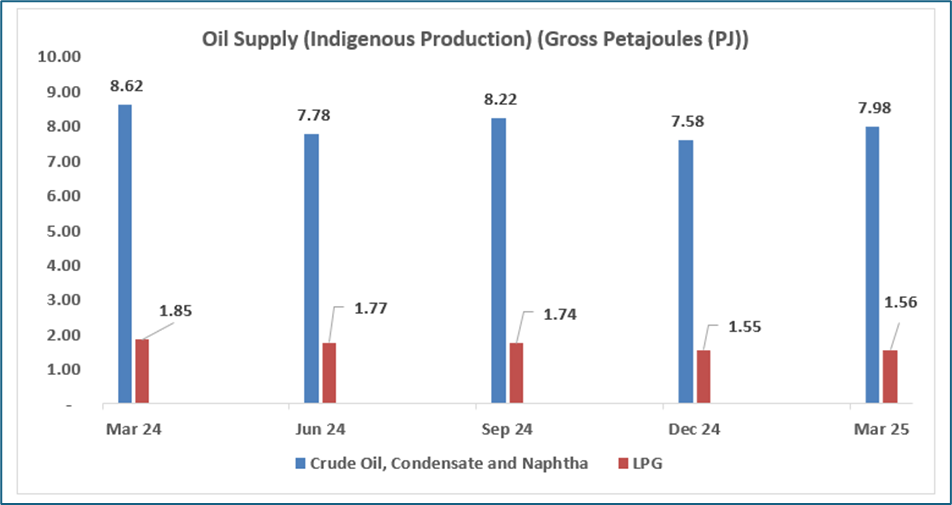
Data Source: This work is owned by the Ministry of Business, Innovation and Employment on behalf of the Crown which are licensed for reuse under the Creative Commons Attribution 4.0 International Licence; Chart Created by Kalkine Group
New Zealand Energy Quarterly Data
As per MBIE, the March 2025 quarter witnessed below average hydro inflows, and Transpower indicated inflows in January and February remained the lowest on record for these 2 months. At 4,960 GWh, the hydro generation declined by 15.1% as compared to the quarter ended March 2024. The similar downturn was also witnessed in the wind generation, declining 21.1 % as compared to the March quarter 2024 to 726 GWh. Notably, coal and gas fired generation rose 54.4% and 1%, respectively to compensate.
The total electricity consumption for the quarter ended March 2025 stood at 9,250 GWh, which implies a decline of 3.1 % as compared to the March quarter 2024. Furthermore, the electricity consumption from Agriculture, Forestry and Fishing declined 15.4 %, from Commercial fell 2.0%, from Industrial declined 2.3%, and from Residential stayed steady with a fall of 0.8%.
Exhibit 2: Quarterly Electricity Generation (Net) (Gigawatt hours (GWh))
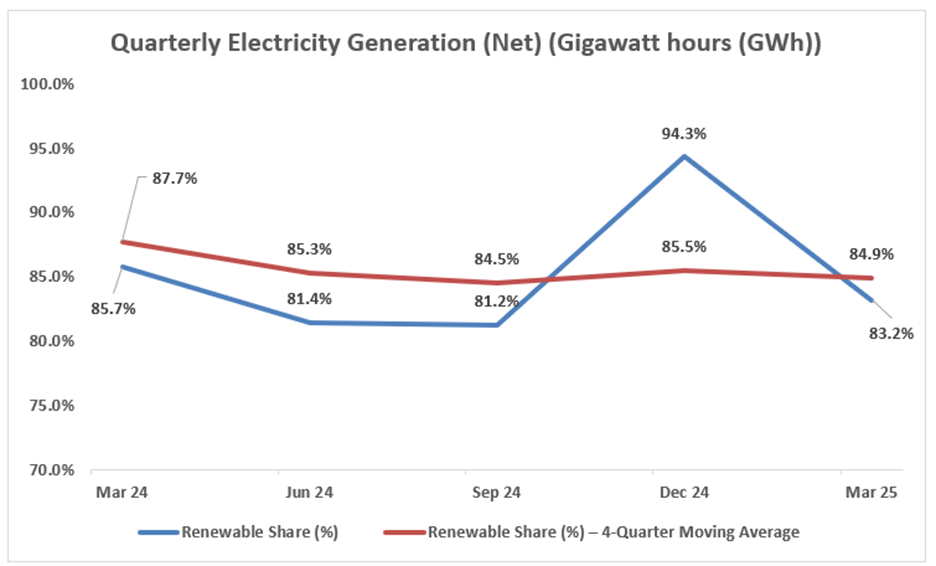
Data Source: This work is owned by the Ministry of Business, Innovation and Employment on behalf of the Crown which are licensed for reuse under the Creative Commons Attribution 4.0 International Licence; Chart Created by Kalkine Group
Key Trends Impacting Electricity Demand
Around a third of the NZ’s electricity demand stems from the households and over a third is coming from the industrial sectors, as per MBIE. Notably, the majority of industrial electricity demand is coming from the wood, pulp, paper as well as printing sectors and the basic metals sectors. Also, the Tiwai Point aluminium smelter is the largest single user of electricity in the country. MBIE also stated that the commercial sectors are consuming around a quarter of the country’s electricity demand. Therefore, the remaining demand is from the transport sectors and the agriculture, forestry, and fishing sectors, which tend to use only a small amount.
Key Risks and Challenges:
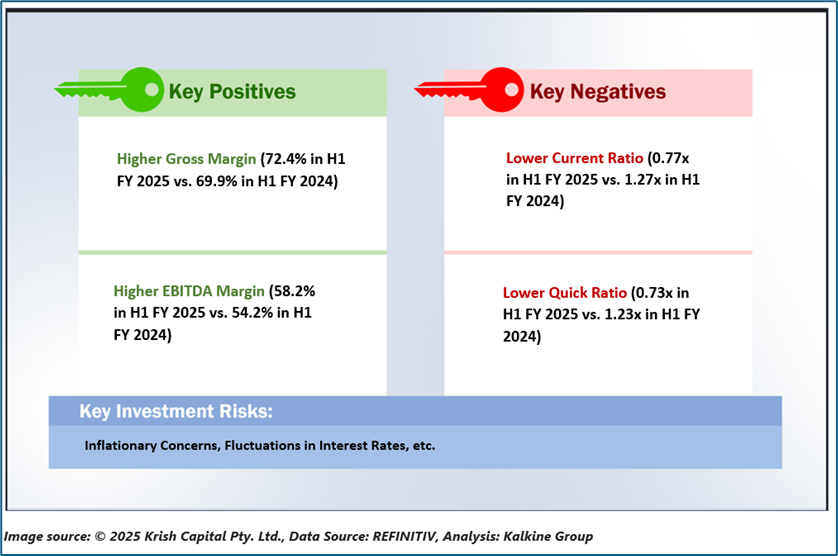
As per the recent FEU dated July 4, the evidence for increased short-term inflation has been mounting. There is also a risk about annual inflation slipping above 3% in H2 FY 2025. Notably, the household energy prices are being hit by the supply issues as well as increased transmission charges. Furthermore, the price increases for public transport and 2025/26 local body rates have been adding to the upside risk. The government energy subsidies supported in reducing price pressure. However, their impact is expected to wane in coming months. Overall, the utilities sector is exposed to risks such as extreme weather events, environmental and regulatory challenges, changing geopolitics, increased competition, etc.
Exhibit 3. Key Risks in Utilities Sector:
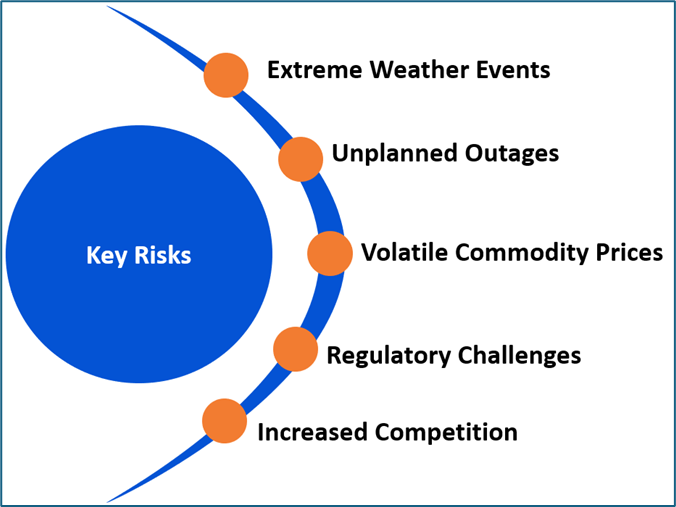
Source: - Analysis: Kalkine Group
Outlook:
As per MBIE, the total electricity demand is expected to grow between 35.3% and 82.0% by 2050, touching 62.1 TWh (terawatt hours). By the 2050, throughout the scenarios, around half of all the energy demand is expected to be met by electricity. Over the short term, the commercial and industrial sectors can act as the main sectors fuelling this growth momentum. From the late 2030s, the electrification of transport is expected to play a significant role with higher uptake of EVs. Contributing to the increased demand is the level of switching of existing fossil fuel use to electricity, which happens to be a critical uncertainty. The higher total demand fuels an increase in peak demand to between 9.1 GW - 12.5 GW by 2050.
MBIE also stated that the alternative electrical heating technologies might become more attractive over time. With the similar heating demand, users can convert to electrical heating, depending upon the investment and running costs. Furthermore, the renewable share of generation is expected to reach between 96.2% and 98.3% by 2050.
from the sector-specific factors, an analysis on 2 NZX-listed companies is provided. This report covers their insights, outlook, performance and potential as expected to be delivered in the near to medium term.
1) Vector Limited (NZX: VCT) (Recommendation: Buy, Potential Upside: Low Double-Digit) (M-Cap: NZD 4.4 Bn, Annual Dividend Yield: ~6.0%)
Business Description:
Vector Limited (NZX: VCT) is a NZ-based energy and digital solutions company, which runs a portfolio of businesses delivering energy, technology and communication services.
Outlook:
The 9 months ended 31 March 2025 saw network connection numbers grow throughout VCT’s Auckland electricity and gas networks. For the year ended 31 March 2025, total electricity connection numbers witnessed a rise of 1.3%. Moving forward, the company is focused towards investing in the core networks as well as towards exploring growth opportunities, which include through Vector Technology Solutions. Its investment in Bluecurrent continues are performing within the expected range.
Technical Overview:
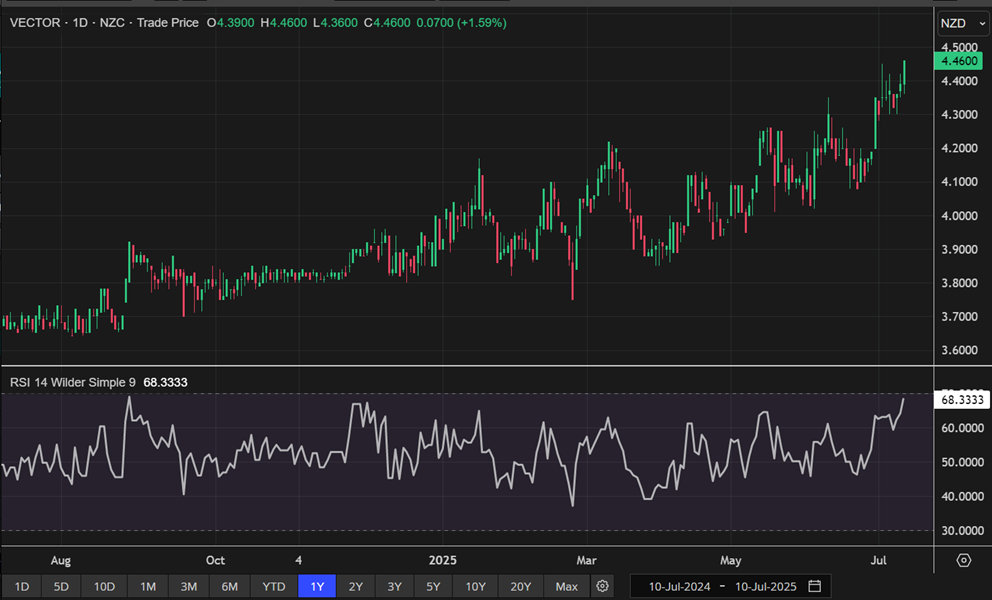
VCT Daily Technical Chart, Data Source: REFINITIV
Technical Commentary:
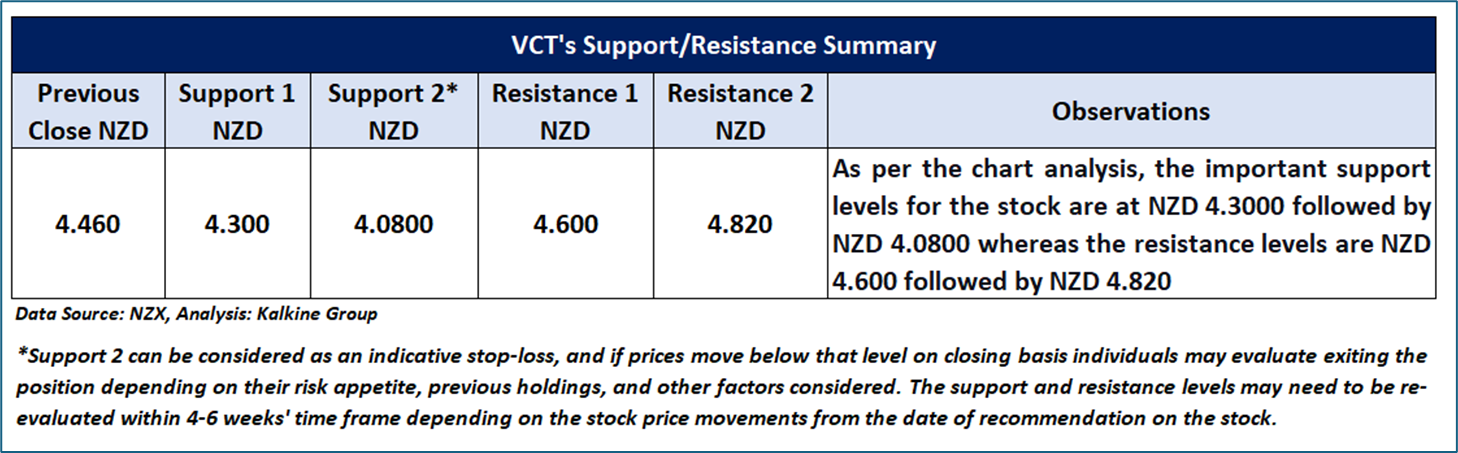
On the daily chart, VCT’s stock prices are undergoing an uptrend characterized by higher highs and higher lows, indicating a positive bias. Moreover, the momentum oscillator RSI (14-period) is heading north from its midpoint, adding more evidence to the mentioned recommendation. Prices are trading above both trend-following indicators 21-day and 50-day SMAs, which might function as dynamic support levels for the stock; in contrast, the stock’s historical high may serve as a resistance. A significant support level for the stock is positioned at NZD 4.30, while critical resistance level is located at NZD 4.60.
Fundamental Valuation
P/E Based Relative Valuation
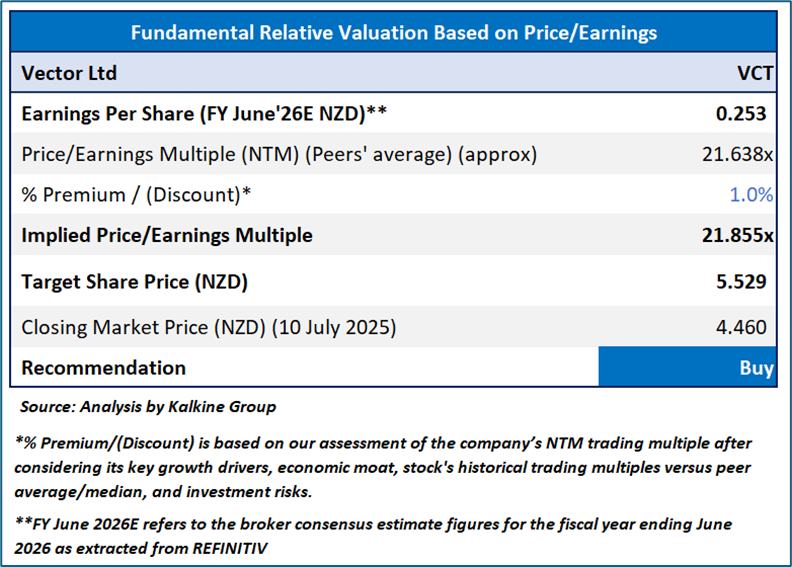
Stock Recommendation
Considering the facts above, a ‘Buy’ recommendation on the stock has been provided at the closing market price of NZD 4.46 per share, up by 1.59% as on 10 July 2025.
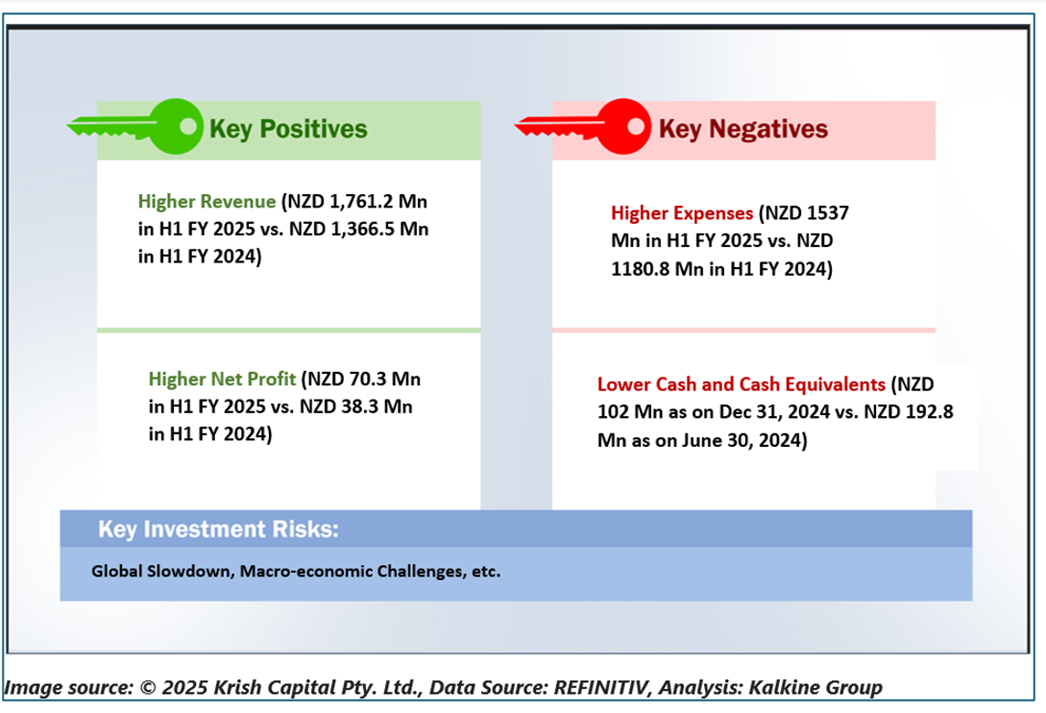
Genesis Energy Limited (Recommendation: Hold, Potential Upside: Low Double-Digit) (M-Cap: NZD 2.5 Bn, Annual Dividend Yield: 8.31%)
Business Description:
Genesis Energy Limited (NZX: GNE) is a New Zealand-based diversified energy company.
Outlook:
Genesis, Mercury, Meridian, and Contact have signed the detailed non-binding term sheet as a basis for developing a strategic energy reserve focused towards Huntly Power Station in support of the national security of supply. GNE’s renewable generation pathway is focused towards solar development because of speed to market, lower capital costs as well as overall improving economics. The company also highlighted that flexible assets, fuels and market products are supporting the need for peaking and firming capacity amidst increasing renewable energy market.
Technical Overview:
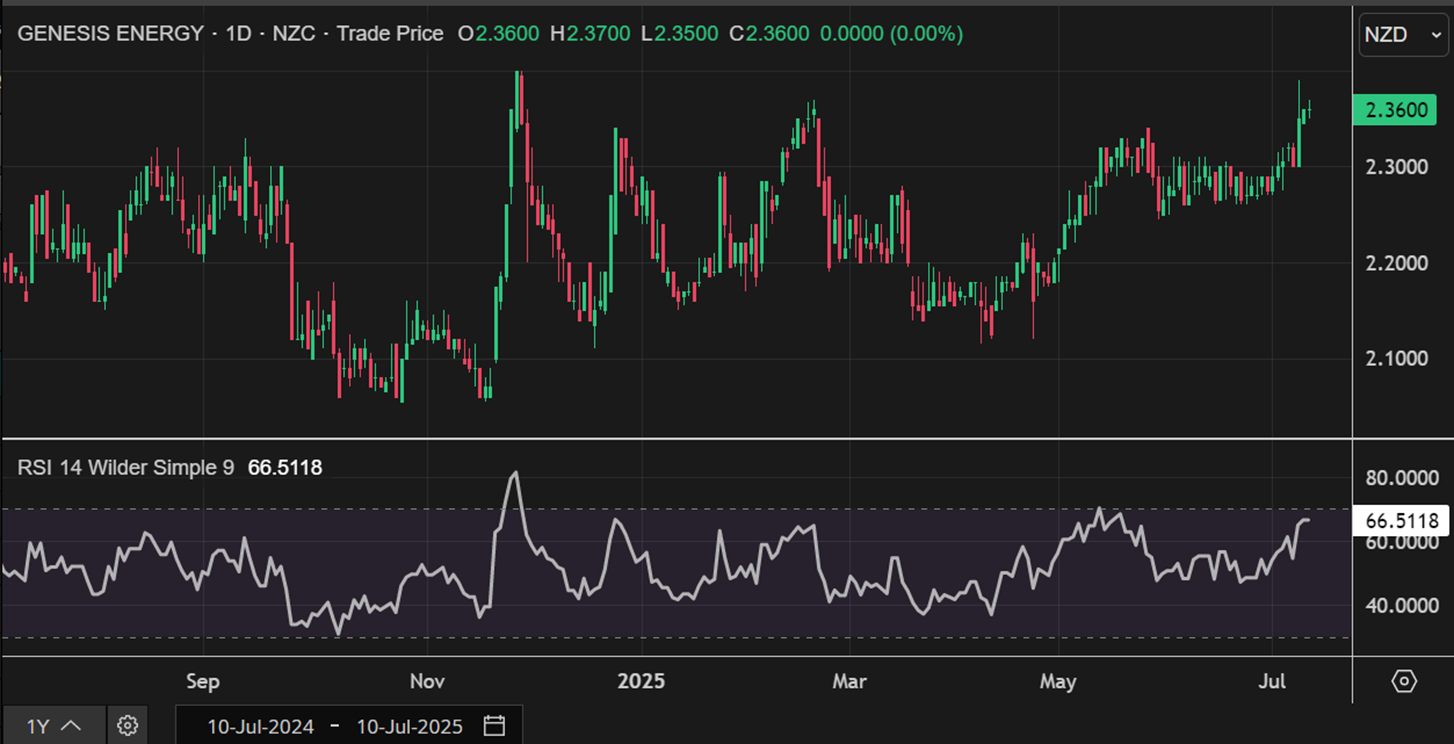
GNE Daily Technical Chart, Data Source: REFINITIV
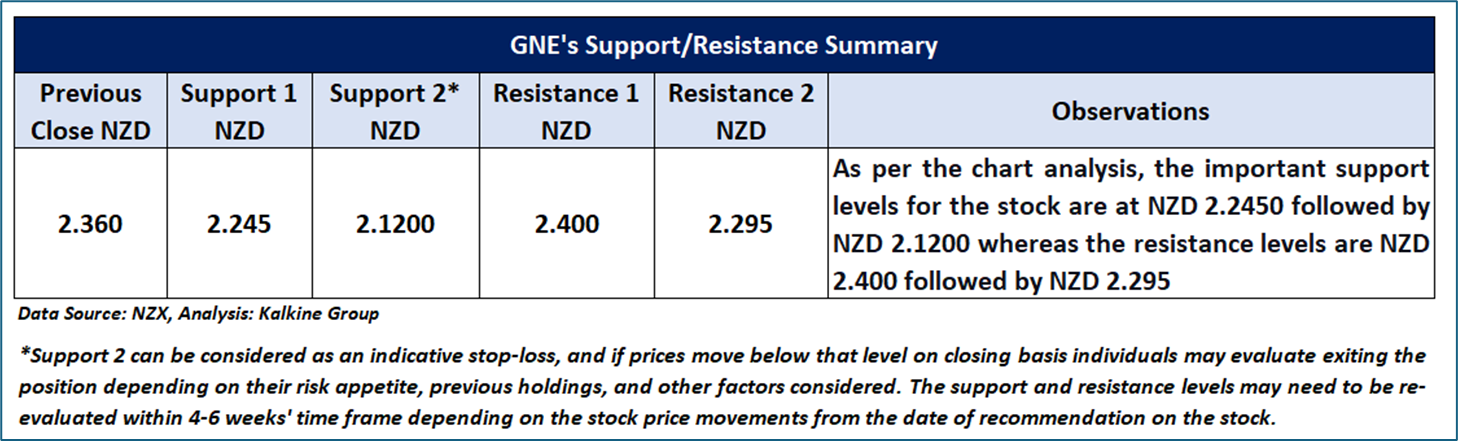
Technical Commentary
On the daily chart, GNE’s stock prices are forming a trading range characterized by lower highs and higher lows, suggesting that the sideways period in the stock might continue to persist in the near future. Additionally, the momentum oscillator RSI (14-period) is fluctuating around its midpoint, providing further support to the previous observation. Prices are trading between its previous peak and trough, which might function as resistance and support levels for the stock, respectively. A crucial support level for the stock is positioned at NZD 2.245, while key resistance level is located at NZD 2.400.
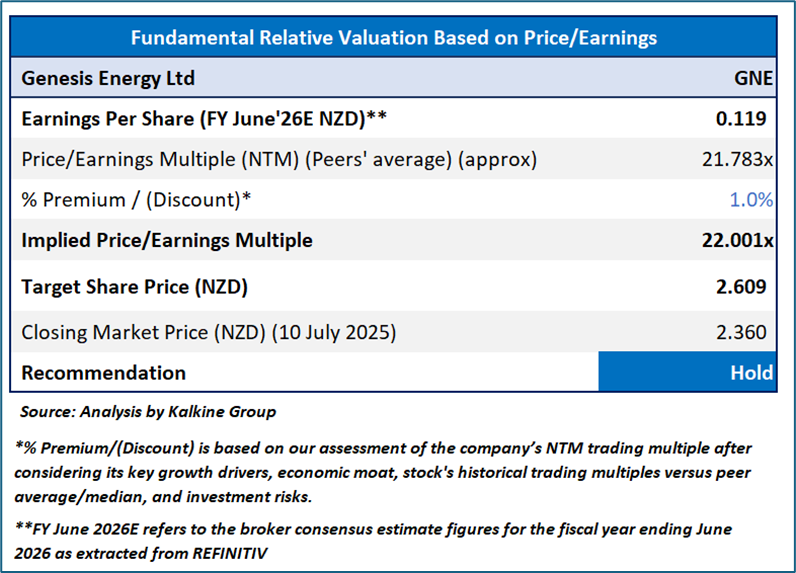
P/E Based Relative Valuation
Stock Recommendation
Considering the aforementioned factors, a “Hold” rating is given on the stock at the closing market price of NZD 2.36 per share as on 10 July 2025.
Markets are trading in a highly volatile zone currently due to certain macro-economic issues and geopolitical tensions prevailing. Therefore, it is prudent to follow a cautious approach while investing.
Note 1: Past performance is neither an indicator nor a guarantee of future performance.
Note 2: The reference date for all price data, currency, technical indicators, support, and resistance levels is 10 July 2025. The reference data in this report has been partly sourced from REFINITIV.
Note 3: Investment decisions should be made depending on an individual's appetite for upside potential, risks, holding duration, and any previous holdings. An 'Exit' from the stock can be considered if the Target Price mentioned as per the Valuation and or the technical levels provided has been achieved and is subject to the factors discussed above.
Note 4: Kalkine reports are prepared based on the stock prices captured either from REFINITIV or Trading View. Typically, REFINITIV or Trading View may reflect stock prices with a delay which could be a lag of 25-30 minutes. There can be no assurance that future results or events will be consistent with the information provided in the report. The information is subject to change without any prior notice.
Technical Indicators Defined: -
Support: A level at which the stock prices tend to find support if they are falling, and a downtrend may take a pause backed by demand or buying interest. Support 1 refers to the nearby support level for the stock and if the price breaches the level, then Support 2 may act as the crucial support level for the stock.
Resistance: A level at which the stock prices tend to find resistance when they are rising, and an uptrend may take a pause due to profit booking or selling interest. Resistance 1 refers to the nearby resistance level for the stock and if the price surpasses the level, then Resistance 2 may act as the crucial resistance level for the stock.
Stop-loss: It is a level to protect further losses in case of unfavourable movement in the stock prices.
Disclaimer This report has been issued by Kalkine New Zealand Limited (FSP691351) (NZBN:9429047678101) (“Kalkine”). Kalkine is a Financial Advice Provider (“FAP”) and is authorised by a Class 1 Financial Advice Provider Licence issued by Financial Markets Authority (“FMA”) to provide financial advice. Kalkine provides only general financial advice through its research reports following a person becoming a member. The reports contain buy/sell/hold and other recommendations in relation to equity securities, managed funds and other managed investment schemes and other financial advice products. The recommendations and opinions in this report and on Kalkine website do not take into account any of your investment objectives, financial situation or needs. Before you make a decision about whether to acquire a financial product, you should obtain the Product Disclosure Statement from the product issuer. You should consider the appropriateness of advice taking into account your own objectives, financial situation and needs and seek independent financial advice before making any financial decisions. If you act on the advice in the research reports, you may have to pay fees, expenses or other amounts (but not to Kalkine). Further information about the complaints and dispute resolution process, as well as information about Kalkine’s duties are available on Kalkine’s website. Please read our Financial Advice Provider (FAP) disclosure statement and Complaints Handling Guide, which are available on the website.
Past performance is not a reliable indicator of future performance.
 Please wait processing your request...