
Company Overview:
Scott Technology Limited (NZX: SCT) is mainly engaged in the design, manufacture, sales and servicing of automated and robotic production lines and processes for several industries in New Zealand and abroad. Move Logistics Group (NZX: MOV) is one of NZ’s largest private domestic freight and logistics platforms, with a nationwide network of branches, depots and warehouses.
Kalkine’s Sector Report covers the Key Financial Metrics, Risks, Outlook, Technical Analysis along with the Valuation, Target Price, and Recommendation on the stock.
Sector Landscape and Outlook
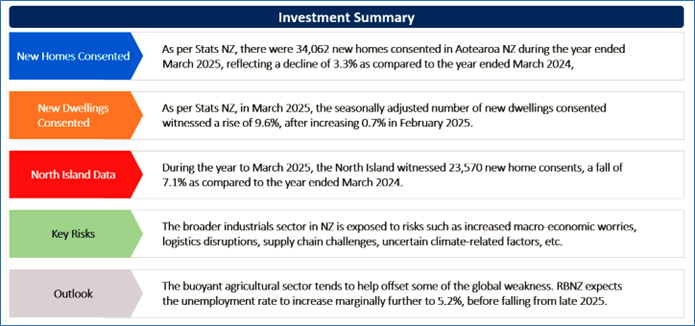
As per Stats NZ, there were 34,062 new homes consented in Aotearoa NZ during the year ended March 2025, reflecting a decline of 3.3% as compared to the year ended March 2024. During the year to March 2025, the North Island witnessed 23,570 new home consents, a fall of 7.1% as compared to the year ended March 2024. On the other hand, the South Island witnessed 6.4% rise over the same period, touching 10,491 new homes consented. The rise in the South Island was because of increased numbers of new homes consented in Otago, Tasman, and Canterbury versus the same period of the last year.
There were 8,179 new homes consented during the March 2025 quarter, implying a rise of 6.0% as compared with the March 2024 quarter. During the March 2025 quarter, there were 3,642 stand-alone houses consented, reflecting 5.7% rise as compared to the March 2024 quarter. There were 4,537 multi-unit homes consented, up by 6.3% over the similar period.
Exhibit 1: New Homes Consented, 12-month Rolling Totals, December 2024 – March 2025
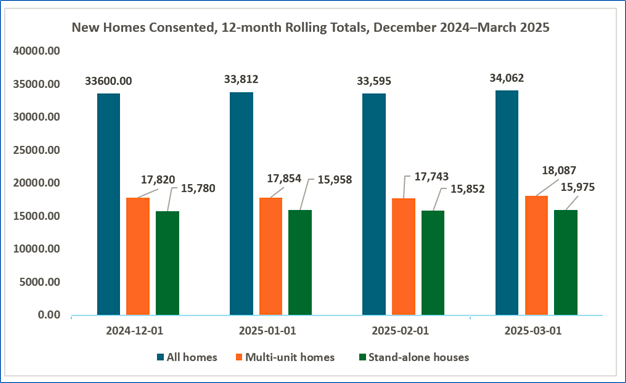
Data Source: This work is based on/includes Stats NZ’s data which are licensed by Stats NZ for reuse under the Creative Commons Attribution 4.0 International Licence; Chart Created by Kalkine Group
Current Trends in Residential Investments
RBNZ recently stated that GDP growth of 0.7% in the December 2024 quarter demonstrated the end of a sharp economic contraction during the middle of 2024. The construction activity witnessed contraction in the quarter, with retail trade and manufacturing recovering marginally after the sharp declines. The residential investment witnessed a fall of 3.9% during the December 2024 quarter. This was a sharper contraction as compared to the 0.9% decline forecasted, stated RBNZ. However, this reflects a continuation of decline in residential investment since the peak witnessed in 2021. Notably, a decline in residential investment demonstrates subdued demand because of previously increased interest rates, reduced house prices as well as slower population growth.
Building Consents Issued (March 2025)
As per Stats NZ, in March 2025, the seasonally adjusted number of new dwellings consented witnessed a rise of 9.6%, after increasing 0.7% in February 2025. For the year to March 2025, the actual number of new dwellings consented stood at 34,062, implying a fall of 3.3% from the year ended March 2024. Notably, the annual value of non-residential building work consented amounted to $8.9 Bn, reflecting a decline of 7.2% from the year ended March 2024.
In March 2025, there were 3,398 new dwellings consented. These comprised of 1,452 townhouses, flats, and units, 1,374 stand-alone houses, 495 apartments and 77 retirement village units.
Exhibit 2: New Dwellings Consented, Monthly
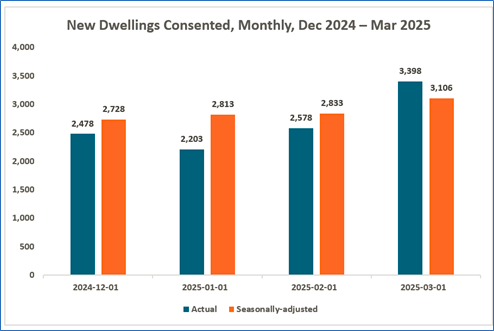
Data Source: This work is based on/includes Stats NZ’s data which are licensed by Stats NZ for reuse under the Creative Commons Attribution 4.0 International Licence; Chart Created by Kalkine Group
Key Risks and Challenges:
RBNZ recently stated that increased global tariffs and heightened economic uncertainty have been impacting the economic activity in NZ and in its trading partners. Notably, the uncertainty related to future tariff levels and global readjustment might prompt companies to delay or cancel the investment plans. Therefore, the outlook for economic growth and inflation has declined in most of NZ’s trading partners. Overall, the broader industrials sector in NZ is exposed to risks such as increased macro-economic worries, logistics disruptions, supply chain challenges, uncertain climate-related factors, etc.
Exhibit 3: Key Risks in Industrials Sector:
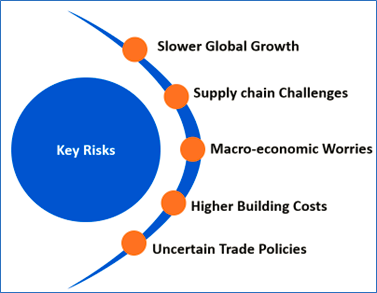
Source: Analysis by Kalkine Group
Outlook:
As per RBNZ, the output gap, which demonstrates the difference between GDP and the economy’s potential output, is expected to be significantly negative. It is expected that the global economic uncertainty would be impacting the output gap over the near term, before the recovery starts at the end of 2025. Furthermore, the buoyant agricultural sector tends to help offset some of the global weakness. RBNZ expects the unemployment rate to increase marginally further to 5.2%, before falling from late 2025.
The NZ economy might be impacted through trade diversion. The tariffs on the US incentivise Chinese beef importers to purchase beef from countries apart from the US, like NZ. In isolation, this can benefit NZ with the help of cheaper manufactured goods as well as higher demand for beef. Notably, the elevated export commodity prices as well as reduced interest rates have been helping the overall economic activity in NZ economy. The employment growth is modest. However, this is expected to increase from H2 FY 2025 in line with the broad-based economic recovery.
Apart from the sector-specific factors, an analysis on 2 NZX-listed companies is provided. This report covers their insights, outlook, performance and potential as expected to be delivered in the near to medium term.
1) Scott Technology Limited (Recommendation: Buy, Potential Upside: Low Double-Digit) (M-Cap: NZD 3 Mn, Annual Dividend Yield (TTM)1: 3.74%)
Business Description:
Scott Technology Limited (NZX: SCT) is mainly engaged in the design, manufacture, sales and servicing of automated and robotic production lines and processes for several industries in New Zealand and abroad.
Outlook:
SCT is expecting that there is a strong momentum heading into upcoming months after a robust Q2, recent large project wins as well as increased standard product sales. The announcements on tariffs are projected to have a limited direct impact on the company for FY 2025. While some of the segments might witness headwinds, there are some opportunities, mainly where its European and Asian competitors witness increased tariff rates as compared to those applicable to the exports from NZ or Australia to the US. The global transition towards nearshoring and regionalised supply chains remains aligned with the company’s strengths.
Technical Overview:
Technical Commentary
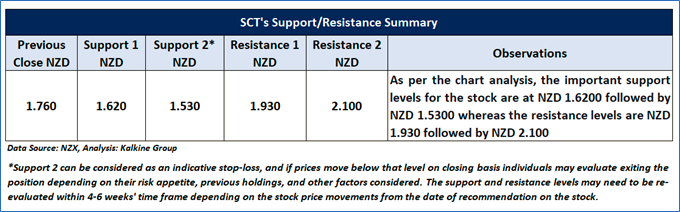
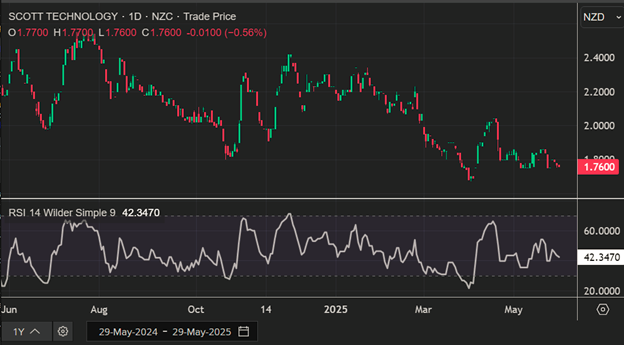
On the daily chart, SCT is currently holding above a key horizontal trendline support, indicating some underlying stability in price action. The Relative Strength Index (RSI), based on a 14-period setting, is hovering around 42.35, stabilizing momentum. However, price action remains below the 21-period Simple Moving Average (SMA), a trend-following indicator that may serve as a near-term resistance. An important support level for the stock is placed at NZD 1.62, while the key resistance levels are placed at NZD 1.93.
SCT Daily Technical Chart, Data Source: REFINITIV
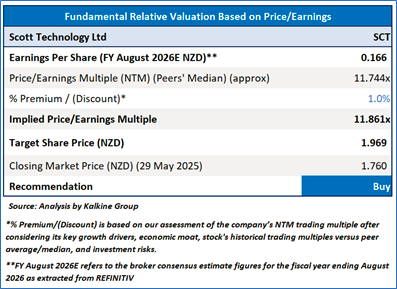
Fundamental Valuation
P/E Based Valuation
Stock Recommendation
Considering the aforementioned factors, a ‘Buy’ rating is given on the stock at the closing market price of NZD 1.76 per share, down by 0.56% as on 29th May 2025.
2) Move Logistics Group Limited (Recommendation: Hold, Potential Upside: Low Double-Digit) (M-Cap: NZD 24.11 million)
Business Description:
Move Logistics Group Limited (NZX: MOV) is one of NZ’s largest private domestic freight and logistics platforms, with a nationwide network of branches, depots and warehouses.
Outlook:
MOV stated that lift in market activity as well as winning in market, along with improvements from transformation plan, are expected to result in earnings growth. The company’s priority focus is towards cost reduction, gross margin improvements, and cashflow generation supported by sales-led recovery. Also, the company is emphasizing productivity improvements and placing itself for stronger market activity and demand.
Technical Overview:
Technical Commentary
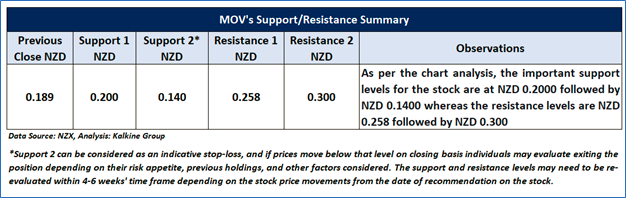
On the daily chart, MOV’s stock prices are undergoing a downtrend characterized by lower lows and lower highs, indicating a negative bias. Currently, though the stock is on a rally, the momentum oscillator RSI (14-period) is approaching its midpoint from the below which suggests that the stock might resume its current downtrend soon. Prices are trading below trend-following indicator 50-day SMA, which might function as dynamic resistance levels for the stock; in contrast, the stock’s previous trough may act as sentimental supports. A significant support level for the stock is located at NZD 0.200, while critical resistance level is placed at NZD 0.258.
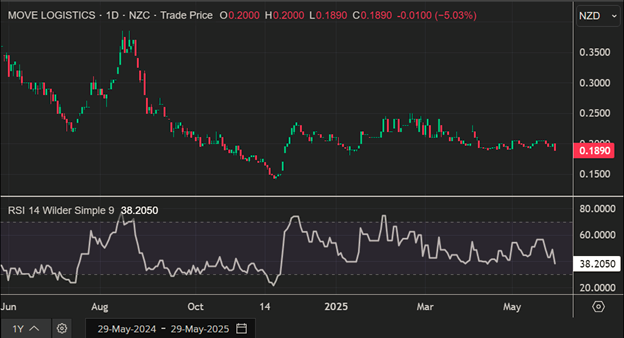
MOV Daily Technical Chart, Data Source: REFINITIV
Stock Recommendation
Considering the aforementioned factors, a ‘Hold’ rating is given on the stock at the closing market price of NZD 0.189 per share as on 29th May 2025.
Markets are trading in a highly volatile zone currently due to certain macro-economic issues and geopolitical tensions prevailing. Therefore, it is prudent to follow a cautious approach while investing.
Note 1: Past performance is neither an indicator nor a guarantee of future performance.
Note 2: The reference date for all price data, currency, technical indicators, support, and resistance levels is May 29, 2025. The reference data in this report has been partly sourced from REFINITIV.
Note 3: Investment decisions should be made depending on an individual's appetite for upside potential, risks, holding duration, and any previous holdings. An 'Exit' from the stock can be considered if the Target Price mentioned as per the Valuation and or the technical levels provided has been achieved and is subject to the factors discussed above.
Note 4: Annual Dividend Yield is on a Trailing Twelve Month (TTM1) basis and are subject to change based on factors such as company performance, stock price changes, etc.
Note 5: Kalkine reports are prepared based on the stock prices captured either from REFINITIV or Trading View. Typically, REFINITIV or Trading View may reflect stock prices with a delay which could be a lag of 25-30 minutes. There can be no assurance that future results or events will be consistent with the information provided in the report. The information is subject to change without any prior notice.
Technical Indicators Defined: -
Support: A level at which the stock prices tend to find support if they are falling, and a downtrend may take a pause backed by demand or buying interest. Support 1 refers to the nearby support level for the stock and if the price breaches the level, then Support 2 may act as the crucial support level for the stock.
Resistance: A level at which the stock prices tend to find resistance when they are rising, and an uptrend may take a pause due to profit booking or selling interest. Resistance 1 refers to the nearby resistance level for the stock and if the price surpasses the level, then Resistance 2 may act as the crucial resistance level for the stock.
Stop-loss: It is a level to protect further losses in case of unfavourable movement in the stock prices.
Disclaimer This report has been issued by Kalkine New Zealand Limited (FSP691351) (NZBN:9429047678101) (“Kalkine”). Kalkine is a Financial Advice Provider (“FAP”) and is authorised by a Class 1 Financial Advice Provider Licence issued by Financial Markets Authority (“FMA”) to provide financial advice. Kalkine provides only general financial advice through its research reports following a person becoming a member. The reports contain buy/sell/hold and other recommendations in relation to equity securities, managed funds and other managed investment schemes and other financial advice products. The recommendations and opinions in this report and on Kalkine website do not take into account any of your investment objectives, financial situation or needs. Before you make a decision about whether to acquire a financial product, you should obtain the Product Disclosure Statement from the product issuer. You should consider the appropriateness of advice taking into account your own objectives, financial situation and needs and seek independent financial advice before making any financial decisions. If you act on the advice in the research reports, you may have to pay fees, expenses or other amounts (but not to Kalkine). Further information about the complaints and dispute resolution process, as well as information about Kalkine’s duties are available on Kalkine’s website. Please read our Financial Advice Provider (FAP) disclosure statement and Complaints Handling Guide, which are available on the website.
Past performance is not a reliable indicator of future performance.
 Please wait processing your request...